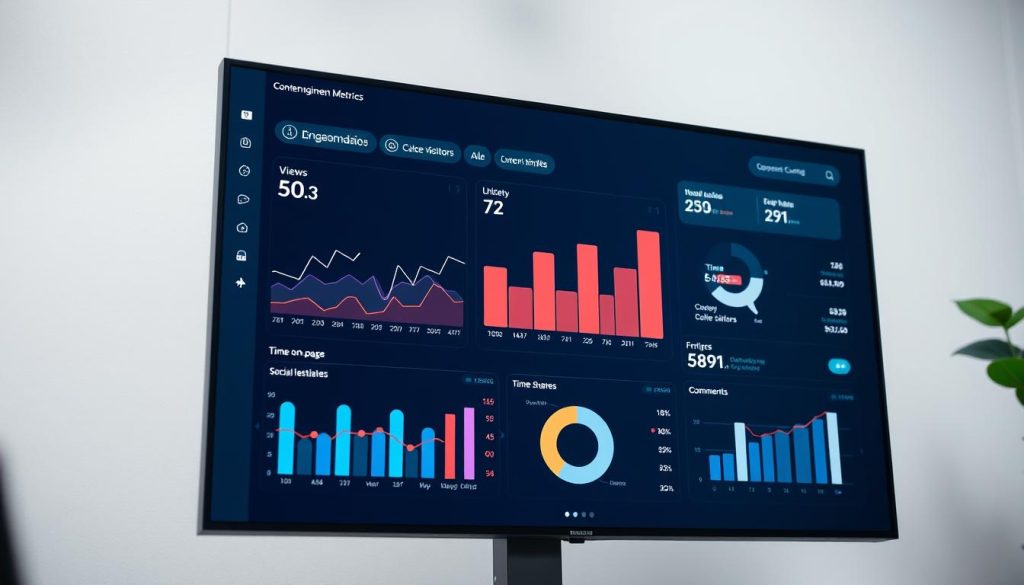
Measuring the success of your content strategy is crucial to understanding its impact on your business. Content Marketing KPIs (Key Performance Indicators) are the measurable values that help you gauge the effectiveness of your efforts. By tracking the right metrics, you can assess your performance and make data-driven decisions to optimize your strategy.
We’re cutting through the noise to focus on the KPIs that actually drive business growth. Most businesses track too many metrics and miss the ones that truly matter. By identifying the right goals and tracking the corresponding KPIs, you can transform your content from a cost center to a revenue-generating machine.
Key Takeaways
- Identify the most impactful content marketing KPIs for your business.
- Understand how to track the right metrics for your goals.
- Transform your content strategy into a revenue-generating machine.
- Learn how to set up effective measurement systems.
- Focus on the KPIs that drive business growth and ROI.
Understanding Content Marketing KPIs
Effective content marketing is heavily reliant on tracking the right performance indicators. In the realm of content marketing, Key Performance Indicators (KPIs) serve as the vital signs that indicate whether your strategy is on track or needs adjustment.

As we delve into the world of content marketing metrics, it’s essential to understand what KPIs are and why they matter. KPIs are quantifiable measurements that directly reflect your content’s performance against strategic business objectives. They help teams determine the success of a particular initiative or program, making it easier to refine and adjust their approach.
What Are Content Marketing KPIs?
Content marketing KPIs are specific metrics that measure the effectiveness of your content marketing efforts. These metrics can include brand awareness goals, engagement with customers or prospects, newsletter open rates, or visits to a website. By tracking these KPIs, businesses can gain valuable insights into their content’s performance and make data-driven decisions.
As noted by industry experts, “The most powerful content marketing KPIs bridge the gap between marketing activities and business outcomes.” This emphasizes the importance of selecting KPIs that align with your business objectives.
Why Tracking the Right KPIs Matters
Tracking the right KPIs is crucial for the success of your content marketing strategy. By focusing on meaningful KPIs, businesses can create accountability in their content program and justify continued investment. As we highlighted earlier, successful content strategies focus on a handful of meaningful KPIs rather than dozens of disconnected numbers.
Moreover, understanding the difference between leading indicators (predictive) and lagging indicators (historical) helps you make proactive decisions. By identifying the right KPIs, you can drive business growth and revenue through your content marketing efforts.
Setting Effective Content Marketing Goals
Effective content marketing begins with setting the right goals. To achieve success in your marketing efforts, it’s crucial to establish clear objectives that align with your overall business strategy. Without well-defined goals, your content efforts may lack direction and effectiveness.

Aligning KPIs with Business Objectives
Your content marketing KPIs should directly support your company’s broader business targets. Whether your focus is on revenue growth, market expansion, or customer retention, your marketing efforts should be designed to drive these outcomes. We’ve seen numerous content strategies fail because they weren’t anchored to clear business objectives from the start.
To avoid this pitfall, ensure that your content marketing goals create a clear line of sight between the content you produce and the business results you need. This alignment is crucial for maintaining focus and clarity in your marketing strategy.
The SMART Approach to Content Marketing Goals
The SMART framework (Specific, Measurable, Achievable, Relevant, Time-bound) transforms vague aspirations into actionable content marketing goals. By applying this framework, you can ensure that your goals are well-defined and achievable within a specified timeframe.
We recommend limiting yourself to 3-5 primary goals for any content initiative to maintain focus and clarity. Regularly reviewing your goals (quarterly at minimum) will keep your content strategy agile and responsive to changing business conditions.
Brand Awareness KPIs
Effective brand awareness campaigns are the backbone of a robust content marketing funnel. Without a solid brand presence, other marketing efforts can fall flat. We track several key performance indicators (KPIs) to measure the success of our brand awareness initiatives.
Website Traffic and Page Views
Website visits are a primary indicator of brand awareness. We monitor the number of visitors to our site, focusing on new visitors as a sign of expanding reach. Page views provide additional insight into how users engage with our content, indicating the depth of interest.
For instance, a surge in website traffic often correlates with successful content marketing campaigns. By analyzing traffic sources, we identify which channels drive the most valuable visitors to our site, allowing us to refine our marketing strategies.

Backlinks and Referral Traffic
Backlinks, or inbound links from other websites, serve as third-party validation of our content’s value. These links not only drive referral traffic but also positively impact our site’s SEO by signaling credibility and authority to search engines.
We measure not just the quantity but also the quality of backlinks, considering factors like relevance and authority. This nuanced approach helps us gauge the true impact of our content on our brand’s visibility and reputation.
Brand Mentions and Social Shares
Brand mentions across the web signal growing awareness, even when they don’t include direct links to our website. Social shares amplify our content’s reach, indicating its resonance with our target audience.
As noted by a marketing expert, “The most sophisticated brand awareness measurement combines quantitative metrics with qualitative analysis of sentiment and context.” We’ve found that consistent growth in brand awareness KPIs typically precedes revenue growth by 3-6 months. For more insights on content marketing strategies, visit our content marketing page.
To maximize brand awareness, we benchmark our metrics against both historical performance and competitor standards. This dual approach ensures we’re not only improving over time but also staying competitive in our industry.
Content Engagement KPIs
Content engagement KPIs provide valuable insights into how your audience consumes and interacts with your content. By analyzing these metrics, you can refine your content marketing strategy to better resonate with your target audience.
Time on Page and Scroll Depth
Google Analytics reveals the time every visitor spends on your web page, serving as a clear signal of how your content lands with your audience. If people spend a lot of time on your content, that’s a good sign—it’s exciting and informative. Time on page is one of the most reliable indicators of content quality and relevance.
Scroll depth analysis shows exactly where you’re losing reader attention and helps identify content optimization opportunities. By understanding how far visitors scroll, you can adjust your content layout and structure to keep readers engaged.

Comments and Social Media Engagement
The most valuable engagement happens when readers take action—comments, shares, and direct responses signal true connection. Social media engagement metrics provide immediate feedback on content performance and audience interests.
Tracking comments and social media engagement helps you understand what type of content sparks conversation and drives interaction. This information is crucial for creating a content strategy that fosters a loyal community.
Pages Per Session and Bounce Rate
We track pages per session to understand how effectively your content creates a journey for visitors rather than a dead end. A higher number indicates that your content is engaging and encourages exploration.
Bounce rate must be interpreted in context—high bounce rates can be acceptable for certain content types but devastating for others. Understanding the nuances of bounce rate helps you optimize your content for better performance.
| KPI | Description | Importance |
|---|---|---|
| Time on Page | Average time spent on a page | Indicates content relevance |
| Scroll Depth | How far users scroll on a page | Helps optimize content layout |
| Pages Per Session | Number of pages viewed in one session | Shows content engagement and exploration |
| Bounce Rate | Percentage of visitors who leave immediately | Indicates content relevance and user experience |
By focusing on these content engagement KPIs, you can significantly enhance your content marketing performance and drive meaningful interactions with your audience.
Lead Generation KPIs
Lead generation is a critical aspect of content marketing, turning attention into tangible business opportunities. We measure the success of our content marketing efforts by their ability to generate high-quality leads that drive business growth.
Lead generation campaigns are crucial because they bring potential sales prospects to the business. Subscribers willingly sign up to receive updates, newsletters, or content from us regularly, providing their contact details such as email addresses or preferred communication channels.

Form Completions and Downloads
We measure form completions and content downloads as primary indicators of prospect interest and qualification. These metrics help us understand how effectively our content is resonating with our target audience and whether it’s compelling enough to encourage them to take the next step.
The quality of leads matters more than quantity; we track lead-to-customer conversion rates to assess lead value. This ensures that our content is not only generating leads but also contributing to the overall business objectives.
Email Subscription Rates
Email subscription rates reveal both content appeal and audience trust in our brand’s ongoing value. A high subscription rate indicates that our content is not only attractive but also perceived as valuable by our audience.
We’ve found that gated content must deliver 10x the value of ungated content to justify the friction of a form. This insight guides our strategy for creating premium content that resonates with our audience.
Cost Per Lead
Cost per lead (CPL) showcases what content performs better and on what platform. By dividing our total marketing spend by the number of leads generated within a specific period, we can assess the effectiveness of our content marketing investments.
Cost per lead calculations expose which content investments deliver the best returns and deserve scaling. This allows us to optimize our marketing budget and focus on the most effective content strategies.
By tracking lead generation KPIs, we can refine our content marketing strategy to better align with our business objectives, ensuring that our efforts drive tangible results.
Conversion KPIs That Drive Revenue
To drive revenue, businesses must focus on conversion KPIs that transform content into a revenue-generating asset. By tracking the right metrics, we can optimize our content marketing strategies to maximize ROI and drive business growth.
Conversion KPIs are crucial because they help us understand how different content formats and channels contribute to our overall revenue. Whether it’s through blog posts, ebooks, or webinars, we need to measure how effectively our content converts audience members into customers.
Conversion Rates
Conversion rates are a key metric for measuring the effectiveness of our content. By determining the number of people who react positively to our campaigns, we can identify which content types have the highest ‘pull.’ This information allows us to refine our content strategy and improve overall conversion performance.
Revenue Attribution
Revenue attribution models are essential for connecting content touchpoints to actual sales. By using multi-touch attribution, we can understand the role of content throughout the buyer’s journey and identify which content deserves credit for driving business results. This insight enables us to optimize our content marketing efforts and maximize revenue.
Customer Acquisition Cost
Customer Acquisition Cost (CAC) is another critical metric that covers all marketing efforts, not just content, to acquire new customers. By calculating CAC, we can determine whether our content-driven acquisition strategy is economically sustainable. We’ve found that content-driven customer acquisition typically costs 30-50% less than paid advertising acquisition, making it a valuable strategy for driving growth.

| KPI | Description | Importance |
|---|---|---|
| Conversion Rate | Measures the percentage of audience members who take a desired action | High |
| Revenue Attribution | Connects content touchpoints to actual sales | High |
| Customer Acquisition Cost | Measures the cost of acquiring new customers through marketing efforts | High |
By focusing on these conversion KPIs, we can transform our content marketing efforts into a revenue-generating machine. By tracking conversion rates, understanding revenue attribution, and optimizing customer acquisition costs, we can drive business growth and achieve our marketing goals.
Customer Retention KPIs
Customer retention is a crucial aspect of content marketing, delivering its highest ROI by keeping existing customers at a significantly lower cost than acquiring new ones. According to Forbes, investing in retaining current customers is five times less expensive than attracting new ones. This underscores the importance of tracking and optimizing customer retention through effective content marketing strategies.
Customer Retention Rate
We track customer retention rate as a primary indicator of content’s ability to nurture ongoing relationships. The proportion of users who stop doing business with your company after their first purchase defines Customer Retention Rate (CRR). Content that drives retention typically focuses on product education, advanced use cases, and community building.
Customer Lifetime Value
Customer Lifetime Value (CLV) is a content marketing KPI that calculates the total revenue you should anticipate from a single client throughout your partnership. We’ve found that customers who engage with your content regularly have 2-3 times higher lifetime value than non-engaged customers. This highlights the importance of creating engaging content that fosters long-term customer relationships.
Net Promoter Score
Net Promoter Score (NPS) provides a standardized measure of customer satisfaction and loyalty that can be tracked over time. It measures the likelihood of customers recommending your product or service to others. By monitoring NPS, businesses can gauge the effectiveness of their content in building customer loyalty and advocacy.
The most sophisticated retention content strategies segment customers by value and engagement, delivering personalized experiences. By doing so, businesses can not only retain customers but also drive expansion revenue through upsells and cross-sells. Customer advocacy metrics further measure how well content transforms satisfied customers into active promoters, a crucial aspect of long-term business growth.
Email Marketing Performance KPIs
With email being a highly effective tool for communicating with both prospects and customers, measuring its performance is essential. Email remains the highest-ROI channel for content distribution, making its performance metrics critical to track. We measure various KPIs to gauge the success of our email marketing campaigns.
Email open rates and click-through rates (CTR) are primary indicators of email campaign effectiveness. Open rates indicate how well the subject line and sender reputation are performing, while CTR reveals the relevance and appeal of the content. These metrics help us understand how our audience engages with our email content.
Open and Click-Through Rates
Open rates are a crucial metric as they reflect the effectiveness of the subject line and the sender’s reputation. A higher open rate suggests that the subject line is compelling and that the recipient recognizes the sender. Click-through rates, on the other hand, measure the percentage of recipients who click on a link within the email, indicating the content’s relevance and appeal.
We segment our email performance data by audience type, content category, and funnel stage to gain deeper insights. This segmentation allows us to tailor our content and improve engagement. Email engagement patterns reveal audience preferences more reliably than surveys, enabling us to create more targeted campaigns.
Email Conversion Metrics
Email conversion metrics connect content engagement to business outcomes, such as form completions and direct purchases. By tracking these metrics, we can assess the direct impact of our email campaigns on revenue generation. Email conversion metrics are vital for understanding how email marketing contributes to our overall business goals.
We’ve found that email performance metrics often predict broader content performance trends 2-3 months in advance. This predictive capability allows us to adjust our content marketing strategies proactively. By analyzing email performance data, we can identify areas for improvement and optimize our approach to achieve better results.
Social Media Content KPIs
To gauge the effectiveness of our content on social media, we track specific KPIs that provide insights into audience engagement and content reach. Social media is a critical channel for content distribution, and understanding its performance is vital for refining our content marketing strategy.
Social media metrics offer immediate feedback on how our content resonates with the audience. By analyzing these metrics, we can adjust our content to better meet the audience’s interests and needs.
Reach and Impressions
We track reach and impressions to measure how visible our content is on social media. While views are important, they don’t necessarily translate to value. It’s crucial to differentiate between mere visibility and meaningful engagement.
Engagement Rate
The engagement rate normalizes interaction metrics across different audience sizes, allowing for fair comparisons between various social media platforms and posts. This KPI is essential for understanding how effectively our content drives audience interaction.
Follower Growth
Follower growth is another critical KPI, indicating the audience’s interest in maintaining an ongoing relationship with our brand. A steady increase in followers suggests that our content is appealing and relevant.
To illustrate the importance of these KPIs, let’s consider the following data:
| KPI | Description | Importance |
|---|---|---|
| Reach and Impressions | Measures content visibility | High |
| Engagement Rate | Normalizes interaction metrics | High |
| Follower Growth | Indicates ongoing audience interest | High |
By focusing on these social media content KPIs, we can refine our content strategy to better engage our audience and drive meaningful results.
Tools for Tracking Content Marketing KPIs
Effective content marketing KPI tracking starts with selecting the appropriate tools. To make data-driven decisions, you need to track and analyze your content’s performance regularly. This involves using a combination of analytics platforms and specialized content marketing tools.
Analytics Platforms
We recommend Google Analytics as the foundation of any content measurement stack for its comprehensive tracking capabilities. It allows you to track website traffic, real-time user behavior, and other key metrics. Custom dashboards can save hours of analysis time by surfacing your most critical KPIs in one view. Additionally, combining quantitative tools like Google Analytics with qualitative tools such as surveys and heatmaps provides a more comprehensive understanding of your content’s performance.
Specialized Content Marketing Tools
Specialized tools like SEMrush, Ahrefs, and BuzzSumo provide competitive intelligence that basic analytics platforms miss. These tools can help you track your content’s performance across different channels and identify areas for improvement. Marketing automation platforms can also connect content engagement to lead nurturing, revealing the full customer journey.
To get the most out of your tracking setup, we recommend starting simple and adding tools only as needed. Regular tracking audits ensure your measurement approach evolves with your business and technology changes. Documenting your measurement processes can also help prevent insights from being lost during team transitions.
Conclusion: Creating a Data-Driven Content Strategy
By understanding and leveraging key performance indicators, businesses can transform their content marketing efforts into predictable drivers of growth. Tracking marketing KPIs provides direction and focus by highlighting critical performance areas relevant to your business.
A truly data-driven content strategy is not just about collecting data; it’s about consistently applying insights gained through measurement to drive results and achieve success. We’ve seen that businesses with measurement-focused content strategies consistently outperform their intuition-driven competitors.
To achieve this, we recommend regularly reviewing your content marketing KPIs to identify trends and adjust your strategy as needed. The right KPIs create alignment between content creators, marketing leaders, and executive stakeholders, ensuring everyone is working towards the same objectives.
By embracing a data-driven approach and continually refining your content marketing strategy, you can drive meaningful outcomes and achieve long-term success.
