

The line “increasing customer retention rates by 5% increases profits by 25% to 95%” is Harvard Business Review’s 2014 wording of research by Frederick Reichheld of Bain & Company. The 25% to 95% range is not in the 1990 “Zero Defections” paper, whose range is 25% to 85%. The earliest place we could verify 25% to 95% is Reichheld and Phil Schefter’s 2000 HBR article on e-commerce. Current benchmarks are more useful for planning: Recurly’s network shows 3.60% overall subscription churn (July 2026 data), ChartMogul puts median B2B SaaS net revenue retention at 82% (2025), and Bluecore measured a 16.5% average repeat purchase rate across 100+ retailers (2023).
Below: the full paper trail for the 5% claim with the exact wording in each source, retention and churn benchmarks with sample and date, the five formulas with a worked cohort table, and a table of which retention stat to cite for which claim.
Where “5% more retention = 25% to 95% more profit” comes from
The claim has been restated at least six times since 1990, and the range, the industry and the unit change along the way. Here is each source in order, with what it actually says.
| Year | Source | Exact claim | Scope behind it |
|---|---|---|---|
| 1990 | “Zero Defections: Quality Comes to Services”, Frederick F. Reichheld and W. Earl Sasser Jr., HBR, September to October 1990 | Bain’s summary of the article: “Companies can boost profits by almost 100% by retaining just 5% more of their customers.” Example: MBNA, whose defection rate fell to about half the industry average; its industry ranking “went from 38 to 4, and profits have increased sixteenfold.” | Service companies; MBNA (credit cards) is the worked example. The public summaries give no sample size. |
| 1993 | “Loyalty-Based Management”, Reichheld, HBR, March 1993 | “At MBNA, a 5% increase in retention grows the company’s profits by 60% by the fifth year.” | One company. |
| 1994 | “Putting the Service-Profit Chain to Work”, Heskett, Jones, Loveman, Sasser and Schlesinger, HBR (reprinted July to August 2008) | “Reichheld and Sasser estimate that a 5% increase in customer loyalty can produce profit increases from 25% to 85%.” | Restates the 1990 work. This is where the 25% to 85% range is stated in HBR’s own words. |
| 1996 | The Loyalty Effect, Reichheld, Harvard Business School Press, as reported by the Christian Science Monitor (March 4, 1996) | A 5 percentage point increase in customer retention “in a typical firm” will “increase profits by more than 25 percent and growth by more than 100 percent.” | A “typical firm”. No range up to 95% in the coverage we could read. |
| 2000 | “E-Loyalty: Your Secret Weapon on the Web”, Reichheld and Phil Schefter, HBR, July to August 2000 | Bain’s summary: by retaining 5% more customers, e-companies can boost profits by 25 to 95 percent. | Online businesses. Earliest verifiable source of the 25% to 95% range. |
| 2001 | “Prescription for cutting costs”, Reichheld, Bain & Company | “In financial services, for example, a 5% increase in customer retention produces more than a 25% increase in profit.” | Financial services. No 95% figure. |
| 2014 | “The Value of Keeping the Right Customers”, Amy Gallo, HBR, October 29, 2014 | “research done by Frederick Reichheld of Bain & Company” shows “increasing customer retention rates by 5% increases profits by 25% to 95%.” | Stated generally, with no industry. The link on that sentence points to the 2001 Bain brief, which says “more than 25%” for financial services and does not contain 25% to 95%. |
So the exact sentence people search for is Amy Gallo’s 2014 paraphrase. The source she links does not contain the range. The range itself is from an article about e-commerce companies in 2000, and the cross-industry original from 1990 tops out at 85%.
“Zero Defections”: 25% to 85% or 25% to 95%?
25% to 85%. HBR’s 1994 service-profit chain article summarizes Reichheld and Sasser as “a 5% increase in customer loyalty can produce profit increases from 25% to 85%.” An Ipsos analysis from 2005 quotes the 1990 claim the same way: “by reducing customer defection by a mere 5%, companies can boost profits by 25% to 85%.” If you have seen “Zero Defections” cited for 25% to 95%, that citation mixes the 1990 paper with the 2000 e-commerce range.
One more trap: some roundups list per-industry results from the 1990 paper (a bank branch system, an insurance brokerage, an auto-service chain). The full 1990 text is paywalled and HBR’s public page shows only the opening paragraph, so we could not check those figures against the original. Leave them out unless you have read the article itself.
What the “5%” actually measured
Professor Byron Sharp of the Ehrenberg-Bass Institute makes three points about the 1990 analysis that change how you should read it:
- The “5%” was a drop of 5 percentage points in defection, from 10% to 5% a year. That halves defection and doubles average customer life from 10 to 20 years. It is not a 5% relative improvement.
- The calculation described customer profitability, not company profit.
- The model assumed the halving of defection cost nothing to achieve.
Sharp calls it a “thought experiment” rather than empirical research. Our customer loyalty statistics page runs the math both ways: halving defection roughly doubles lifetime value, while moving retention from 80% to 84% lifts it about 25%, before the cost of the retention effort.
How old is the stat, and how to cite it
In 2026, the 1990 figure is 36 years old and the 2000 range is 26 years old. Both predate subscription billing, mobile commerce and most of the SaaS market. Copy-ready citations that will survive a fact check:
- General: “Bain’s Frederick Reichheld estimated that retaining 5% more customers could raise profits by 25% to 95% for online businesses (Harvard Business Review, 2000); in financial services he put the effect at more than 25% (Bain, 2001).”
- Original study: “Reichheld and Sasser (HBR, 1990) estimated that a 5% increase in customer loyalty could raise profits by 25% to 85%, as summarized in HBR in 1994.”
- If you must quote the famous line: attribute it to “Amy Gallo, Harvard Business Review, 2014, citing Bain research,” not to Bain directly.
The companion claim, that acquiring a customer costs five to 25 times more than keeping one, is hedged in the same 2014 HBR post: “Depending on which study you believe, and what industry you’re in, acquiring a new customer is anywhere from five to 25 times more expensive than retaining an existing one.” It names no study, so calculate your own ratio from your acquisition and retention costs.
Subscription churn by industry: Recurly, July 2026 data
The freshest cross-industry churn data comes from billing platforms that observe cancellations directly. Recurly’s churn benchmarks, “updated with July 2026 data,” report 3.60% overall churn across its network: 2.34% voluntary (the customer cancels) and 1.25% involuntary (the payment fails). Involuntary churn is about a third of the total (1.25 divided by 3.60 = 35%), which is the part you can often fix with card updaters and payment retries rather than with a better product.
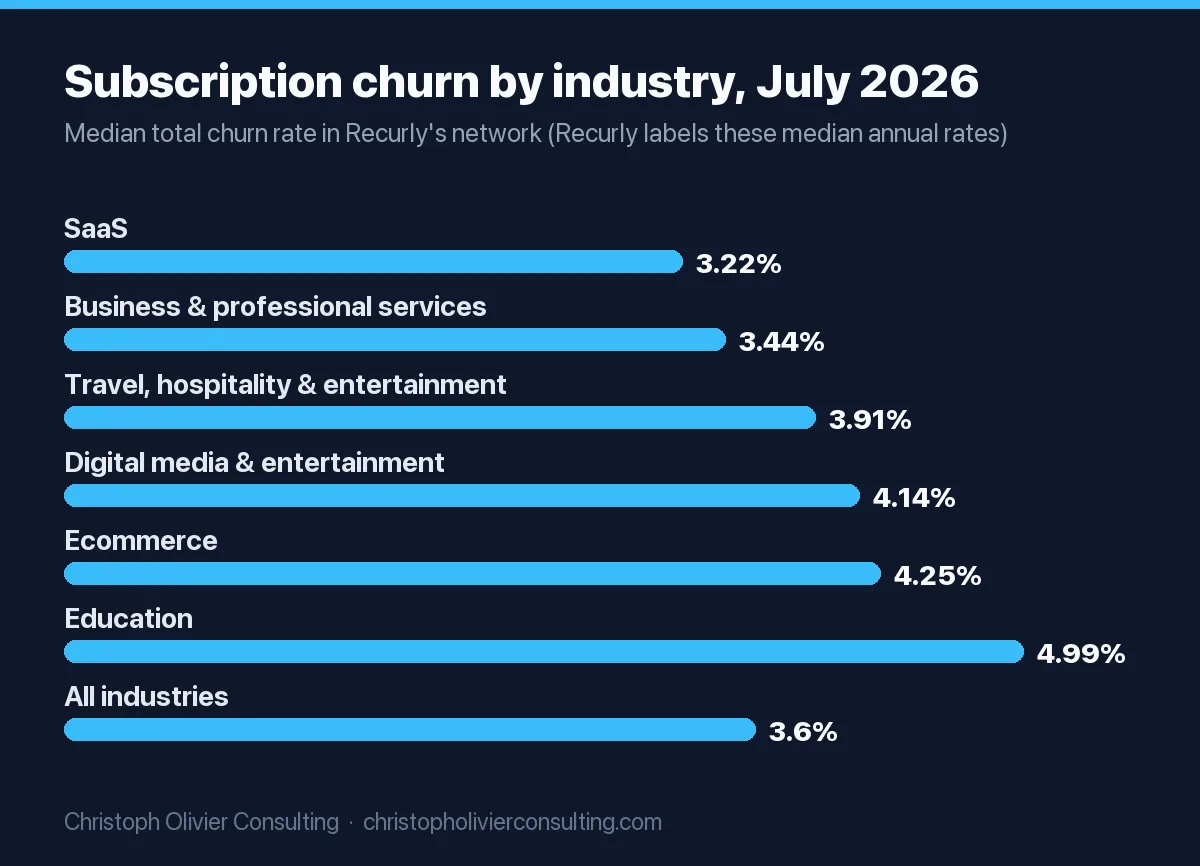
| Industry (Recurly network) | Total churn | Voluntary | Involuntary |
|---|---|---|---|
| SaaS | 3.22% | 2.16% | 1.06% |
| Business & professional services | 3.44% | 2.27% | 1.18% |
| Travel, hospitality & entertainment | 3.91% | 2.63% | 1.28% |
| Digital media & entertainment | 4.14% | 2.55% | 1.59% |
| Ecommerce | 4.25% | 2.87% | 1.38% |
| Education | 4.99% | 3.30% | 1.69% |
| All industries | 3.60% | 2.34% | 1.25% |
Price matters as much as industry. On the same page, involuntary churn drops from 1.30% for subscriptions priced $10 to $25 to 0.18% for those over $250, while total churn falls from 4.29% ($10 to $25) to 2.87% ($100 to $250). Recurly does not explain the pattern, but it is sharpest in failed-payment churn.
Three cautions before you quote Recurly. The industry table is labeled “median annual churn rates,” but Recurly’s own definition says churn is “typically calculated monthly or annually depending on your billing model,” and the headline tiles carry no period. The page also gives 3.04% for SaaS and 3.21% for business services in one section, which do not match its table. And the page does not state how many merchants or subscribers are in the dataset. Quote the table values with “Recurly, July 2026 data” and do not annualize them yourself. Our subscription economy statistics use the same figures.
SaaS retention benchmarks: NRR and GRR
For software and other recurring-revenue businesses, the better benchmarks are revenue retention, not logo churn. Three sources, three methods:
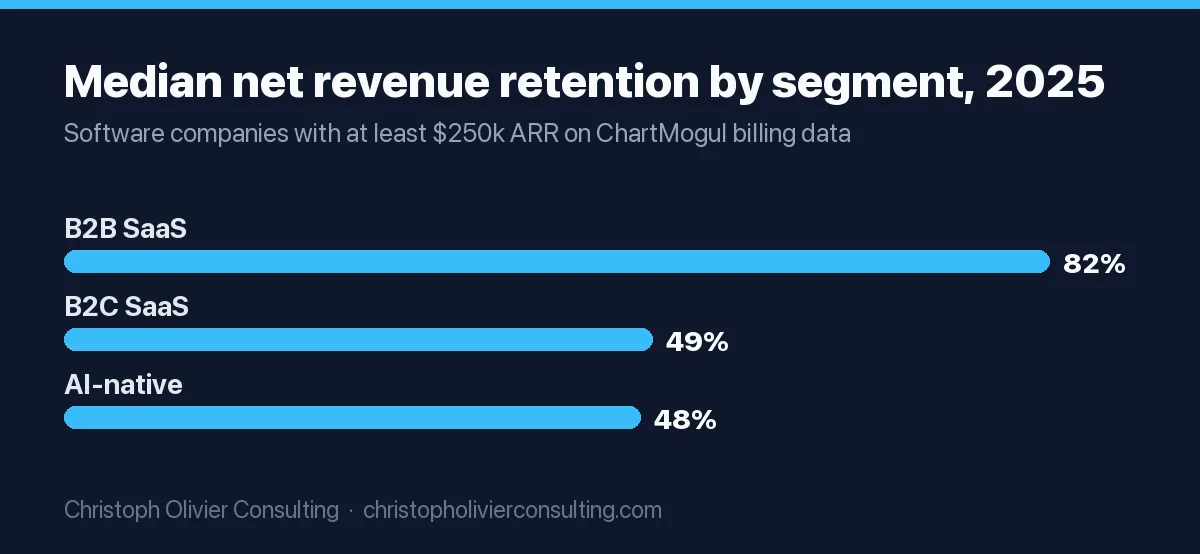
| Source and date | Sample and method | Finding |
|---|---|---|
| ChartMogul “The AI churn wave”, December 10, 2025 | About 3,500 software companies on ChartMogul billing data (about 2,700 B2B SaaS, 600 B2C SaaS, 200 AI-native), each with at least $250k ARR; annualized 2025 retention | Median NRR: B2B SaaS 82% (top quartile 97%), B2C SaaS 49%, AI-native 48%. AI-native products over $250 a month: GRR 70%, NRR 85%; under $50 a month: GRR 23%, NRR 32%. |
| ChartMogul SaaS Retention Report, November 1, 2023 | 2,100+ SaaS businesses, mostly 2022 data, companies active for the full 12 months | Top-quartile NRR: 65.1% at ARPA under $10 a month vs 109.3% at ARPA over $500. Share of companies above 100% NRR: 2.7% vs 41.1%. Top-quartile customer retention: 63.1% vs 85.7%. |
| KeyBanc Capital Markets and Sapphire Ventures SaaS Survey, 2025 edition (16th year; released November 13, 2025) | Self-reported survey of private SaaS companies; the public pages do not state the number of respondents | Gross retention declined to 86% in 2023 and is “expected to approach the 90% threshold”; net retention “has continued to remain above 100%.” |
The 82% median NRR from ChartMogul and the “above 100%” from KeyBanc are not in conflict so much as measuring different groups. ChartMogul reads billing data from companies that use its software, including many small ones (the floor is $250k ARR). KeyBanc surveys private SaaS companies, which report their own figures, and does not publish the respondent count on its public pages. If you sell to mid-market or enterprise buyers, ChartMogul’s 2023 report puts best-in-class NRR at roughly 115% to 125% and best-in-class GRR at about 95%.
Ecommerce and retail repeat purchase rates
Retail does not have contracts, so retention shows up as repeat purchase. The most methodical public number we found is Bluecore’s Customer Growth Benchmarks Report (April 16, 2024), based on the full 2023 calendar year at more than 100 retailers in seven categories:
| Metric (Bluecore, 2023 data) | Figure |
|---|---|
| Average repeat purchase rate, all categories | 16.5% |
| Health and beauty | 21.5% |
| Sporting goods and outdoor | 21.2% |
| Apparel | 20.2% |
| Average reactivation rate (lapsed buyers who return) | 6.6% (health and beauty 9.2%, apparel 8.5%) |
| Orders and spend of active buyers vs new buyers | 57.6% more orders, 69.2% more spend |
| Retailers with shopper ID rates above 40% | Repeat purchase rates 53% above average |
Bluecore sells retail marketing software and the release does not define the measurement window, so treat 16.5% as a one-year rate for mid-size and large retailers, not a law of ecommerce. The “28% average repeat purchase rate” that circulates on statistics roundups has no traceable methodology; we could not match it to a published dataset.
B2B customer retention rate by industry
The most quoted B2B industry table comes from CustomerGauge, which attributes it to its State of B2B Account Experience research. The page (dated June 13, 2026) labels the figures as median retention rates:
| Industry (B2B) | Median retention | Median churn |
|---|---|---|
| Energy / utilities | 89% | 11% |
| IT services | 88% | 12% |
| Computer software (B2B) | 86% | 14% |
| B2B industry services | 83% | 17% |
| Financial services | 81% | 19% |
| Professional services | 73% | 27% |
| Telecommunications | 69% | 31% |
| Manufacturing | 65% | 35% |
| Consumer packaged goods | 60% | 40% |
| Logistics | 60% | 40% |
| Wholesale | 44% | 56% |
Use it as directional only. The page gives no sample size, no survey year and no measurement period, and its text calls a 72.5% figure an “average” while the table says “median.” Note that other roundups quote “professional services 84%” for the same kind of table; that figure does not match CustomerGauge’s current page, and we could not trace it to a source.
Customer retention formulas, with worked math
| Metric | Formula | Worked example |
|---|---|---|
| Customer retention rate (Zendesk) | ((E minus N) ÷ S) × 100, where E = customers at the end of the period, N = customers added during it, S = customers at the start | 200 customers on January 1, 40 added, 204 on December 31: (204 minus 40) ÷ 200 = 82% |
| Customer churn rate (Zendesk) | (Churned customers ÷ original number of customers) × 100 | 36 of the 200 left: 36 ÷ 200 = 18% |
| Net revenue retention (ChartMogul) | (Starting MRR + expansion MRR + reactivation MRR minus contraction MRR minus churn MRR) ÷ starting MRR | ($100,000 + $16,000 + $0 minus $2,500 minus $18,000) ÷ $100,000 = 95.5% |
| Gross revenue retention | (Starting MRR minus contraction MRR minus churn MRR) ÷ starting MRR. Same as NRR without expansion, so it can never exceed 100%. | ($100,000 minus $2,500 minus $18,000) ÷ $100,000 = 79.5% |
| Cohort retention at month n | Customers from a start cohort still active at month n ÷ customers in that cohort at month 0 | 164 of 200 still active at month 12 = 82% |
Two conversions trip people up. Monthly to annual: annual retention = (1 minus monthly churn) to the 12th power, so 3% monthly churn is 0.9712 = 69.4% annual retention, not 64%. And average customer lifetime = 1 ÷ churn rate: at 18% annual churn, the average customer stays 1 ÷ 0.18 = 5.6 years. Our customer relationship guide uses the same Zendesk formulas for a service firm’s lifecycle metrics.
Worked cohort table: one year of a 200-customer cohort
This is an illustrative cohort, not data from a real company. It starts with 200 customers paying $500 a month each ($100,000 MRR) and tracks them for 12 months. Churned customers are counted at their starting $500.
| Month | Active customers | Logo retention | Churned MRR (cumulative) | Contraction (cumulative) | Expansion (cumulative) | Cohort MRR | GRR | NRR |
|---|---|---|---|---|---|---|---|---|
| 0 | 200 | 100% | $0 | $0 | $0 | $100,000 | 100% | 100% |
| 3 | 184 | 92% | $8,000 | $1,000 | $3,000 | $94,000 | 91% | 94% |
| 6 | 174 | 87% | $13,000 | $1,500 | $7,000 | $92,500 | 85.5% | 92.5% |
| 9 | 168 | 84% | $16,000 | $2,000 | $11,000 | $93,000 | 82% | 93% |
| 12 | 164 | 82% | $18,000 | $2,500 | $16,000 | $95,500 | 79.5% | 95.5% |
How to read it against the benchmarks above:
- NRR 95.5% sits well above ChartMogul’s 82% B2B SaaS median and just under its 97% top quartile. Expansion of $16,000 is doing most of that work.
- GRR 79.5% is below the 86% gross retention KeyBanc reported for 2023. This cohort has a leak that upsells are hiding.
- Logo retention 82% means 18% annual churn. Most of the loss happens in the first three months (16 of the 36 churned customers), which points to onboarding, not price.
- The fix with the clearest math: halve first-quarter churn from 16 to 8 customers and keep everything else equal. Twelve-month churned MRR drops from $18,000 to $14,000, GRR rises to 83.5% and NRR to 99.5%.
Service firms without monthly billing can run the same table on annual fees or engagement value. Our guide to client retention for coaches and consultants shows the renewal math for a practice of 13 clients. And because retention is a lagging number, pair it with a leading one: a quarterly Net Promoter Score survey flags detractors months before they fail to renew.
Why customers cancel, and what brings them back
Recurly’s 2026 State of Subscriptions report, drawn from 76 million subscribers, gives the clearest current reasons and save tactics:
- 52% of consumers canceled at least one subscription in the past year because they did not use it.
- Pause usage rose 337% year over year among merchants offering “pause before cancel,” and three in four subscribers who pause eventually return.
- Former subscribers drive nearly 1 in 4 new sign-ups, so win-back is part of acquisition.
- Annual plans generate 50% to 60% higher revenue per user.
On failed payments, Recurly’s 2024 report release (January 23, 2024) says its recovery tools saved 72% of at-risk subscribers in 2023, recovered subscriptions ran a median of 141 days longer, and 38% of a subscriber’s lifetime came after a recovery event. If your churn split looks like Recurly’s network (about a third involuntary), payment recovery is the cheapest retention project you can run.
Which customer retention statistic to cite
| Claim you want to make | Cite this | Avoid | Caveat to state |
|---|---|---|---|
| Retention raises profit | Reichheld and Schefter, HBR 2000: 25% to 95% for e-companies; or Reichheld, Bain 2001: more than 25% in financial services | “25% to 95% in all industries” or “Zero Defections found 25% to 95%” | 26 to 36 years old; modeled, not measured across firms |
| What the 1990 paper found | Reichheld and Sasser via HBR 1994: 25% to 85% | Per-industry figures from roundups you cannot check | 5 points of defection, from 10% to 5% |
| Acquisition costs more than retention | HBR 2014: “five to 25 times,” with its own hedge | “5x more, according to Bain” | No named study behind it |
| Typical subscription churn | Recurly, July 2026 data: 3.60% total, 2.34% voluntary, 1.25% involuntary | Annualized figures you computed from it | Period labeling is ambiguous; sample not stated |
| SaaS net revenue retention | ChartMogul, Dec 2025: 82% median B2B SaaS NRR (at least $250k ARR) | “Median SaaS NRR is above 100%” without naming the KeyBanc sample | Billing data vs self-reported survey |
| SaaS gross retention | KeyBanc and Sapphire, 2025 survey: 86% in 2023 | Mixing it with ChartMogul’s AI-native GRR | Respondent count not public |
| Ecommerce repeat purchase | Bluecore, 2023 data: 16.5% average, 100+ retailers | “28% average repeat purchase rate” | Vendor data; window not defined |
| B2B retention by industry | CustomerGauge: professional services 73%, financial services 81% | “Professional services 84%” | No sample, year or period disclosed |
| Selling to existing customers is easier | Your own win rates on existing vs new accounts | “60% to 70% vs 5% to 20%,” attributed to the textbook Marketing Metrics | We could not verify it from a readable copy of the book |
My rule of thumb: if a retention stat does not name the publisher, the year of the data and the sample, do not put it in a board deck. If your own cohort numbers are messy and you want a second pair of eyes on them, you can book a consultation.
Frequently asked questions
Is "increasing customer retention rates by 5% increases profits by 25% to 95%" a real statistic, and what is the source?
The exact sentence is from Amy Gallo's October 29, 2014 Harvard Business Review post, citing Bain's Frederick Reichheld. The link in that post goes to a 2001 Bain brief that says only "more than 25%" in financial services. The 25% to 95% range first appears, in sources we could verify, in Reichheld and Schefter's July to August 2000 HBR article about e-commerce companies.
Does "Zero Defections" say 25% to 85% or 25% to 95%?
25% to 85%. HBR's 1994 article "Putting the Service-Profit Chain to Work" summarizes Reichheld and Sasser's 1990 paper as estimating that a 5% increase in customer loyalty can produce profit increases from 25% to 85%. Bain's own summary of the 1990 paper says profits can rise by almost 100%. The 95% upper bound comes from the 2000 e-commerce article, not from Zero Defections.
Is the 5% customer retention, 25% to 95% profit stat from Bain?
Yes, in the sense that the author, Frederick Reichheld, was at Bain. But the range is about online businesses (HBR, 2000) and the 1990 analysis behind it is modeled, not measured across many firms. Ehrenberg-Bass's Byron Sharp notes the 5% meant cutting defection from 10% to 5%, a halving, at assumed zero cost. Cite the year and the industry when you use it.
What is a good customer retention rate?
It depends on the model. ChartMogul's December 2025 analysis of about 3,500 software companies found a median B2B SaaS net revenue retention of 82% with the top quartile at 97%. KeyBanc and Sapphire's 2025 survey reported SaaS gross retention of 86% in 2023. CustomerGauge lists professional services B2B retention at 73%, but discloses no sample or year.
What is the average churn rate in 2026?
Recurly's churn benchmarks, updated with July 2026 data, show 3.60% overall churn across its subscription network: 2.34% voluntary and 1.25% involuntary from failed payments. By industry it ranges from 3.22% for SaaS to 4.99% for education. Recurly labels the industry figures as median annual rates but its definition allows monthly or annual, so do not annualize them yourself.
How do you calculate customer retention rate?
Use ((E minus N) divided by S) times 100, where E is customers at the end of the period, N is customers added during the period and S is customers at the start. Example: 200 customers on January 1, 40 added, 204 on December 31 gives (204 minus 40) divided by 200, or 82%. For revenue, use net revenue retention and gross revenue retention.
Is it really 5 to 25 times more expensive to acquire a customer than retain one?
Harvard Business Review's 2014 post says acquiring a new customer is "anywhere from five to 25 times more expensive" than retaining one, but prefaces it with "depending on which study you believe, and what industry you're in" and names no study. Treat it as a range of opinion and calculate your own ratio from your acquisition cost and cost to retain.