

US advertisers will spend about $12.4 billion on local radio in 2026, according to BIA Advisory Services: $10.08 billion on over-the-air spots and $2.38 billion on stations’ digital products. That figure is a forecast, it includes election-year political money, and it measures local advertising, so treat it as local radio rather than every radio dollar. Stations’ own digital sales hit $2.3 billion in 2025, about a quarter of radio ad revenue, while the separate IAB/PwC count of all US digital audio (podcasts, streaming music and streaming radio) reached $8.4 billion.
Below, every statistic carries its source, sample, date and method, because most “radio spend” numbers online mix forecasts with measured revenue, or add totals that overlap. Figures from before 2023 are labeled historical.
Radio spend in 2026: the numbers, with source and method
“Radio spend” here means what advertisers pay radio companies. The table separates three measures that are often confused: BIA’s local radio forecast, the RAB’s measured station digital revenue, and the IAB’s digital audio total.
| Statistic | Figure | Source and date | Sample or base | Method |
|---|---|---|---|---|
| US local radio ad revenue, 2026 (over the air plus digital) | About $12.4 billion | BIA Advisory Services, April 9, 2026, as reported by Radio Ink | US local ad market; BIA models 18 media channels and 96 verticals | Forecast, includes political |
| Over-the-air radio, 2026 | $10.08 billion, up 1.8% from $9.91 billion in 2025 | BIA via Radio Ink, April 9, 2026 | Same | Forecast |
| Radio stations’ digital revenue, 2026 | $2.38 billion, up 5.0% | BIA via Radio Ink, April 9, 2026 | Same | Forecast |
| Total US local advertising, all media, 2026 | $184.5 billion, up about 8.1%; $176.1 billion excluding political | BIA press release, April 9, 2026 | US local markets | Forecast; full detail for BIA ADVantage clients |
| Radio digital ad revenue, 2025 | $2.3 billion, up 7.8%; 24.4% of radio ad revenue | RAB, February 9, 2026 (Borrell Associates report) | Ad revenue data from nearly 3,800 stations; surveys of 406 advertisers, 126 local agencies, 242 radio managers; estimates for 513 markets | Measured revenue plus surveys |
| Average digital revenue per station, 2025 | $511,873 per station; $2,263,431 per market cluster | RAB/Borrell, February 9, 2026 | Same | Same |
| Radio digital revenue, 2026 | About $2.5 billion, up 9.5% | Borrell projection in the RAB release, February 9, 2026 | Same | Forecast |
| US digital audio ad revenue, 2025 | $8.4 billion, up 10.2% from $7.6 billion | IAB/PwC Internet Advertising Revenue Report, April 16, 2026, as reported by Radio Ink | Revenue reported by companies selling internet ads | Compiled by PwC, not audited; covers podcasts, streaming music and streaming radio, no AM/FM broadcast line |
| US podcast ad revenue, 2025 | $2.9 billion ($2.862 billion), up 17.6% | IAB/PwC, April 16, 2026 | Same | Same; a subset of digital audio |
| Political ad spend on radio, 2025 to 2026 cycle | $273 million of an $11.6 billion total, about 2% | AdImpact Political Projection Report, June 2026 | Political ads AdImpact tracks across broadcast, cable, CTV, digital, radio, satellite | Projection |
| Audio’s share of global ad revenue | 4.48% in 2024, 3.95% forecast for 2026, 3.08% by 2030 | WPP Media This Year Next Year, December 2025, as reported by Radio Ink, December 9, 2025 | Global media-owner ad revenue | Forecast; full report for WPP clients only |
WPP Media’s public midyear 2026 update (June 16, 2026) raised its US ad revenue growth forecast to 11.9% for 2026 but publishes no US radio line. That 11.9% is the same figure our US advertising industry statistics carry, next to the full IAB/PwC format table.
Which radio spend number should you quote?
Most errors come from adding numbers that overlap or come from different universes. Pick the row that matches your question.
| Your question | Use this | Do not |
|---|---|---|
| How big is the US radio ad market? | BIA local radio, about $12.4 billion for 2026 (forecast) | Add the IAB digital audio $8.4 billion on top. IAB digital audio includes streaming radio, which overlaps with stations’ digital revenue. |
| How much of radio is digital now? | RAB/Borrell: $2.3 billion, 24.4% of radio ad revenue in 2025 (measured) | Use BIA’s older $2.9 billion forecast for 2025 (see below) |
| How big is all digital audio, including Spotify and podcasts? | IAB/PwC: $8.4 billion in 2025 | Call it “radio.” It has no AM/FM broadcast line. |
| How much do political campaigns spend on radio? | AdImpact: $273 million for the 2025 to 2026 cycle | Add it to BIA, which already includes political in its total |
| What did a named radio company earn? | The 8-K earnings release (iHeartMedia, Cumulus below) | Treat one company’s trend as the market’s |
Old forecast vs what happened: 2025
In September 2024, BIA projected US local radio at $12.9 billion for 2025, with $2.9 billion of it digital, in a September 16, 2024 RAB release, after $13.6 billion projected for 2024. That 2025 number still circulates, including on our own types-of-ads guide, and it was a forecast. BIA’s April 2026 release now puts 2025 over-the-air radio at $9.91 billion. Its 2026 digital figure of $2.38 billion, up 5.0%, implies about $2.27 billion of digital in 2025 ($2.38 billion divided by 1.05). Added together, 2025 lands near $12.2 billion, roughly $0.7 billion under the 2024 forecast, and nearly all of the miss is digital. That is our arithmetic on BIA’s published numbers, not a BIA total. It also lines up with the RAB/Borrell measured $2.3 billion of 2025 digital.
The lesson for anyone budgeting off “radio spend” headlines: radio’s total is roughly flat in dollars, election years lift it, and digital forecasts have run ahead of what stations actually booked.
Company-reported radio revenue: iHeartMedia and Cumulus
Public radio groups report their own revenue every quarter. These are company figures for one company each, filed with the SEC, not market totals.
| Company and line, full year 2025 | Revenue | Change vs 2024 | Source |
|---|---|---|---|
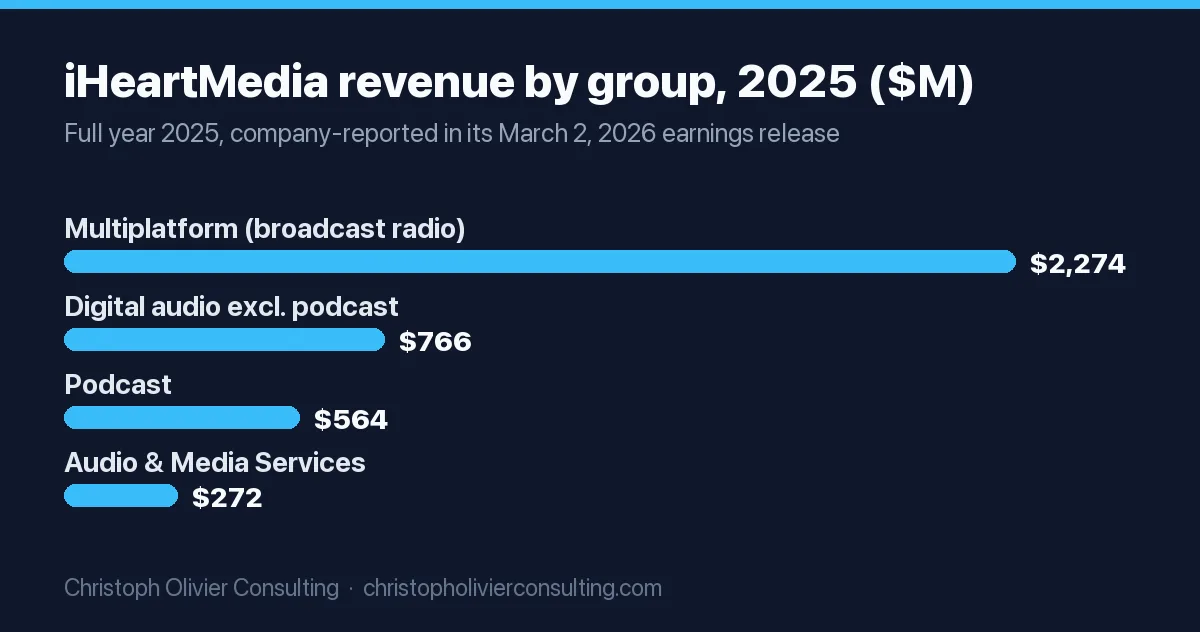
| iHeartMedia, Multiplatform Group (broadcast radio, networks, events) | $2,273.5 million | Down 4.2% (broadcast radio down 5.4%) | iHeartMedia 8-K, Exhibit 99.1, March 2, 2026; broadcast radio split per Radio Ink |
| iHeartMedia, Digital Audio Group, excluding podcast | $765.7 million | Up 7.0% | |
| iHeartMedia, podcast | $563.7 million | Up 25.6% | |
| iHeartMedia, consolidated | $3,865.0 million | Up 0.3%; up 3.6% excluding political | |
| Cumulus Media, broadcast radio spot | $338.6 million | Down 12.9% | Cumulus 8-K, Exhibit 99.1, April 10, 2026 |
| Cumulus Media, broadcast radio network | $135.9 million | Down 22.5% | |
| Cumulus Media, digital | $151.3 million | Down 1.9% | |
| Cumulus Media, net revenue | $741.7 million | Down 10.3% |
The two groups tell the same story at different speeds. At iHeartMedia, digital audio grew 14.2% to $1,329.4 million, so digital audio is now about 34% of the company’s revenue, while broadcast radio shrank. At Cumulus, broadcast fell much faster than the market, and the company says it filed prepackaged Chapter 11 petitions on March 5, 2026. If you buy national radio, that matters: Cumulus owns Westwood One, its network radio arm.
Who listens: radio reach and share of ear in 2026
Radio’s selling point is reach. The most quoted figure is often wrong in one detail: Nielsen’s headline number is monthly reach, not weekly.
| Statistic | Figure | Source and date | Sample or base | Method |
|---|---|---|---|---|
| Radio monthly reach, US adults | 92%, more than 242 million people | Nielsen, “Everyone. Everywhere.”, October 2026 | US adults | Nielsen Comparable Metrics, 1H 2026 (NPower, Nielsen Media Impact) |
| Same measure, other platforms | TV-connected devices 90%, smartphones 87%, live and time-shifted TV 85% | Nielsen, October 2026 | Same | Same |
| Radio monthly reach, adults 18 to 34 | 87% | Nielsen, October 2026 | Adults 18 to 34 | Same |
| Radio monthly reach, previous edition | 93% of adults 18+, 241.9 million | Nielsen Audio Today 2026, March 2026 | Adults 18+ | Nielsen Audience Insights, Q3 2025 |
| Radio listeners who hear a network-affiliated station each week | 93% | Nielsen Audio Today 2026 | Persons 12+ | Nielsen Audio National Regional Database, Spring 2025 |
| Ad-supported audio as a share of all listening | 63%, Q4 2025 | Edison Research Share of Ear, in Nielsen Audio Today 2026 | Adults 18+ | Edison quarterly time-spent study |
| Share of ad-supported audio time, Q2 2026 | AM/FM 62%, podcasts 22%, ad-supported Spotify 6%, ad-supported Pandora 5% | Edison Share of Ear, via Westwood One, July 27, 2026 | Persons 18+; Edison at SSRS surveys 4,000 Americans a year | Daily reach and time spent by audio source |
| AM/FM share of in-car ad-supported audio, Q2 2026 | 82%; 75% among adults 18 to 34 | Same | Same | Same |
| Online audio listening (includes AM/FM streams) | 81% monthly (about 233 million), 76% weekly (about 219 million) | Edison Infinite Dial 2026 | 2,050 people 12+, January 2026 | Online survey, half probability-based SSRS panel, weighted to US 12+ |
| Podcast consumption (listened or watched) | 58% monthly (about 167 million), 45% weekly | Edison Infinite Dial 2026 | Same | Same |
| AM/FM radio used in primary car | 73% in 2026, down from 84% in 2016; online audio 48%, up from 21% | Edison Infinite Dial 2026 | US 18+ who drove or rode in a car in the last month | Same |
On return, the same October 2026 Nielsen piece cites its 2025 Global Annual Marketing Survey and Global Compass benchmark: radio delivered a weighted ROI of $2.00, second only to social media at $2.22, yet marketers ranked radio last of ten channels for perceived effectiveness. Those are global figures, not US.
Two cautions. Westwood One is owned by Cumulus, a radio seller, so read its framing with that in mind; the shares themselves are Edison’s. And reach is not attention: radio reaches 92% of adults in a month, but its share of ad-supported listening time is in the low 60s, while podcasts’ share has risen to 22% after three years at 19%.
AM/FM vs streaming audio vs podcasts: share of listening time
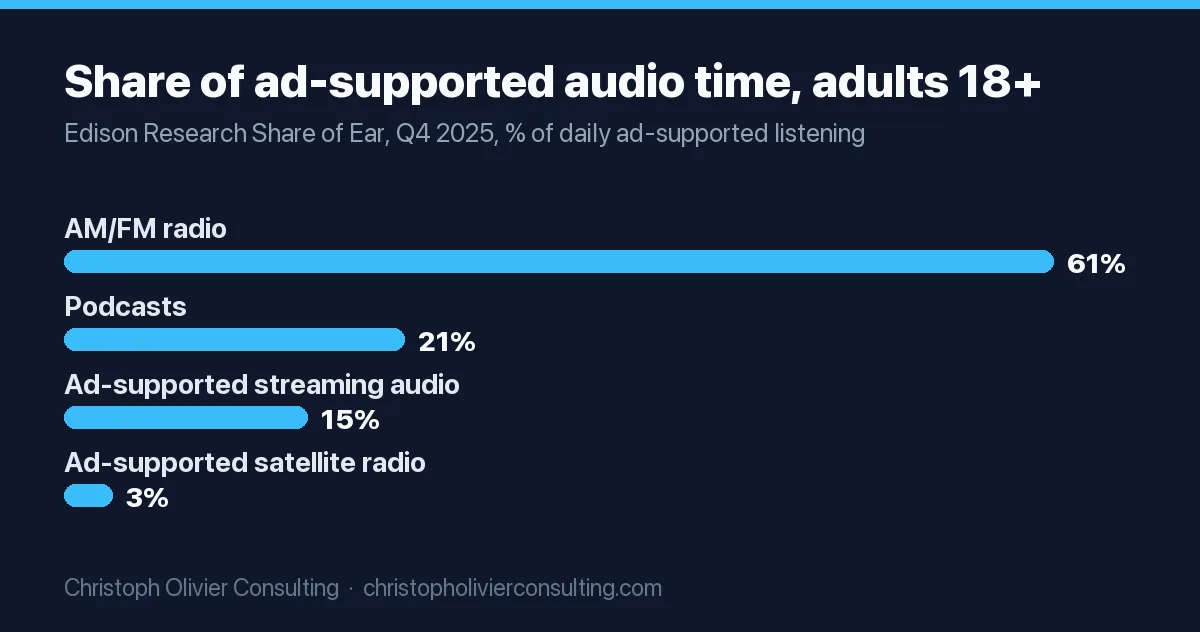
The cleanest single-source split is Edison’s Q4 2025 Share of Ear for adults 18+, published in Nielsen’s Audio Today 2026: radio 61%, podcasts 21%, ad-supported streaming audio 15% and ad-supported satellite channels 3%. The mix differs sharply by audience. Among Black adults 18+, radio holds 70% and podcasts 12%. Among Hispanic adults 18+, radio holds 55%, podcasts 23% and streaming 20%. Nielsen also reports that 77% of ad-supported audio time among 18 to 34 year olds goes to radio and podcasts, and that more than 80% of in-car ad-supported audio time went to AM/FM in Q4 2025.
If you plan podcasts alongside radio, Nielsen’s Podcast Fusion data (adults 18 to 34, March 2025) shows radio alone reaching 88.8% and radio plus podcasts 94.4%, about 5.6 points of incremental reach. Our podcast advertising buyer guide covers how to buy that layer, from CPMs to the IAB definition of a download.
What a radio spot costs: published rate cards we found
We looked for current, station-published US commercial rate cards. Most commercial stations quote privately, and the “radio ad cost” figures online are mostly agency estimates with no named station. These are the named-station cards we could verify:
| Station | Card | Published rates | Caveats |
|---|---|---|---|
| WGLT, Illinois State University public radio, central Illinois | 2026 program schedule and rate card | Weekday drive time $43; weekday midday and evening $35; drive-time local news adjacent $48; weekend $35; Total Audience Plan $33 | Noncommercial underwriting, not commercial spots. Announcement length not stated on the card. WGLT reports 11,300 weekly broadcast listeners. |
| KLJZ-FM and KCYK-AM, Yuma, Arizona (MonsterMedia LLC) | 2020 political rate card, from the FCC public file | FM :30, 7 to 8 a.m. weekdays $23.53; FM :30, 6 to 9 a.m. weekdays $16.44; FM :30 run of schedule $8.24; AM :30, 6 to 9 a.m. weekdays except Thursday $6.63; FM :60, 6 a.m. to midnight weekdays $23.00 | Historical (2020). Lowest unit rates for candidates, agency commissionable. |
We did not find a current commercial station rate card from a top-50 market published online, so we do not quote a “typical” big-market spot price. Treat any blog average without a named station as a guess.
How to see what a real station charges: the FCC political file
Every licensed full-service US radio and TV station keeps an online public inspection file, and federal rules force a rare look at real prices. Under 47 CFR 73.1943, a station’s political file must record, for each political ad request, “the rate charged for the broadcast time,” the air dates and times, and the class of time bought, and keep it online for two years. Under 47 CFR 73.1942, during the 45 days before a primary and the 60 days before a general election, a candidate pays no more than the station’s “most favored commercial advertisers for the same classes and amounts of time.” So a station’s political rates in those windows show you the floor its best commercial clients pay.
- Go to publicfiles.fcc.gov and search the station’s call sign (for example KLJZ).
- Open the station’s political file folder for the current election year. 2026 files cover the run-up to the November 3, 2026 general election.
- Look for a political rate card or the order and invoice records. Note the daypart, the spot length, the class of time (the rule recognizes non-preemptible, preemptible with notice, immediately preemptible and run of schedule) and the rate.
- Compare the same daypart and class across two or three stations in your market. That gives you a defensible opening number before you talk to a sales rep.
Worked example. At WGLT’s 2026 card, 3 weekday drive-time announcements a day for 4 weeks (60 announcements) costs 60 × $43 = $2,580. At KLJZ-FM’s historical 2020 rate of $16.44 for a weekday 6 to 9 a.m. :30, the same 60 spots would have cost $986.40 at the candidate rate. Use these for scale only: one is noncommercial underwriting, the other is six years old.
How to buy radio: spot vs network vs programmatic audio
Radio is sold three ways, and the route decides your minimum spend, your targeting and how you measure results. The programmatic route works the way it does for display and video, through a DSP or a self-serve platform, and our media buying guide covers direct, programmatic and fraud checks across channels.
| Route | What you buy | How it is priced | Data point | Best for |
|---|---|---|---|---|
| Local spot | Spots on one station or a cluster, booked with the station’s sales team or a local buyer | Per spot, by daypart, length and class of time; negotiated off the rate card | Cumulus spot revenue $338.6 million in 2025, down 12.9% | One metro, a store or service area, a dated offer |
| Network and syndicated radio | National inventory inside syndicated shows and services carried by affiliate stations (Westwood One at Cumulus, Premiere Networks at iHeartMedia) | Negotiated national buys | 93% of radio listeners 12+ tune to a network affiliate each week (Nielsen, Spring 2025); Cumulus network revenue $135.9 million, down 22.5% | National brands that want one buy across many markets |
| Programmatic and self-serve streaming audio | Audio ads in station streams, music apps and podcasts, bought on a platform | Auction or “dynamic” CPM pricing; AdsWizz AudioGO budgets start from $250 per campaign; Spotify Ads Manager from 250.00 in local currency per campaign | AudioGO lists digital radio streams of “thousands of local radio stations across major DMAs,” targetable down to ZIP code | Small tests, tight geography, buyers who want impression reporting |
Our guide to the different types of ads shows where radio sits next to TV, podcast, out-of-home and direct mail on price and buying method. If you are weighing radio against streaming TV for local reach, compare it with the CPMs in our connected TV advertising statistics.
Timing: election years crowd radio inventory
AdImpact reports that August through November historically accounts for 58% to 67% of all political ad spending in a cycle, and October alone for 28% to 36%. It also reports that in 2024, ad rates rose 38% from the April to June period to September (the report does not split that figure out for radio). In even years, if your flight must run in October, my advice is to book non-preemptible or fixed-position time early, or move the flight to a quieter month.
Copy-ready questions for a radio sales rep
Nielsen’s Audio Today 2026 tells advertisers to judge radio on as-run delivery rather than planned GRPs, to read results at the DMA level, and to analyze by week. Turn that into your pre-buy email:
- Send your current rate card by daypart, spot length (:15, :30, :60) and class of time, with your package discounts in writing.
- What are the Nielsen audience estimates for my target age group in this DMA, by daypart, and which survey period are they from?
- Will you send as-run affidavits or logs showing the date and time each spot aired?
- What is your make-good policy if a spot is preempted or misses its daypart, and how does political demand in September and October affect my schedule?
- Does the schedule include the station’s stream, and is that counted separately in the audience estimate?
- Are production, voice talent and copy changes included, and what is the copy deadline?
- Can I see two local advertisers in a similar category who renewed this year?
Ask every station on your list the same seven questions so the answers compare. If you want a second opinion on a radio plan or a stack of quotes, you can book a consultation.
Data notes: definitions and dates
- Forecast vs measured. BIA’s 2026 radio figures and Borrell’s $2.5 billion are forecasts. RAB/Borrell’s 2025 digital, IAB/PwC’s 2025 totals and company 8-K figures are reported revenue.
- Local vs national. BIA forecasts local advertising. For network radio, the company filings (Cumulus network revenue, iHeartMedia’s Multiplatform Group) are the public numbers.
- Population bases. Nielsen reach is US adults; Share of Ear figures above are adults 18+; Infinite Dial is persons 12+, with in-car questions asked of adults 18+.
- Historical. The KLJZ-FM rate card (2020) is older than 2023 and labeled historical. BIA’s September 2024 projections are kept only to show forecast error.
- Not additive. IAB digital audio includes streaming radio, which overlaps with the station digital revenue BIA and the RAB count. Do not add them.
Frequently asked questions
How much is spent on radio advertising in the US?
BIA Advisory Services forecasts about $12.4 billion of US local radio ad revenue in 2026: $10.08 billion over the air and $2.38 billion from stations' digital products, up from $9.91 billion over the air in 2025. It is a forecast that includes political spending. Network radio sales are reported separately by companies such as iHeartMedia and Cumulus.
What does radio spend mean?
Radio spend is the money advertisers pay radio companies for airtime and related digital ads: on-air spots, network radio, and station streams, websites and other digital products. It is not the same as digital audio spend, which the IAB measures at $8.4 billion for 2025 and which includes podcasts and music streaming such as Spotify and Pandora.
Is radio ad spend growing or declining?
Roughly flat. BIA puts over-the-air revenue at $9.91 billion in 2025 and forecasts a 1.8% rise in 2026, helped by midterm political ads. Stations' digital revenue grew 7.8% to $2.3 billion in 2025, per the RAB. At company level, iHeartMedia's broadcast radio fell 5.4% in 2025 and Cumulus broadcast revenue fell 15.9%.
How much does a radio ad cost?
It depends on station, market, daypart and class of time, and most commercial stations do not publish rates. Two published examples: WGLT, a public station in central Illinois, lists weekday drive-time underwriting at $43 in 2026; KLJZ-FM in Yuma, Arizona listed a weekday 6 to 9 a.m. :30 at $16.44 on its 2020 political card. Station political files on publicfiles.fcc.gov show rates charged.
How many people does radio reach?
Nielsen reports that radio reaches 92% of US adults every month, more than 242 million people, based on its Comparable Metrics for the first half of 2026. That is monthly reach, not weekly. Among adults 18 to 34 the figure is 87%. Nielsen's March 2026 Audio Today edition put monthly reach at 93% of adults 18+ for Q3 2025.
What share of audio listening goes to AM/FM radio vs podcasts and streaming?
In Edison Research's Q2 2026 Share of Ear for adults 18+, AM/FM radio held 62% of ad-supported audio time, podcasts 22%, ad-supported Spotify 6% and ad-supported Pandora 5%. In the car, AM/FM held 82%. In Q4 2025 the adult split was radio 61%, podcasts 21%, streaming 15% and satellite 3%.
How do you buy radio advertising?
Three routes: local spot buys from a station or cluster, priced per spot by daypart and class of time; network radio through syndicators such as Westwood One or Premiere Networks for national reach; and programmatic or self-serve streaming audio, where platforms such as AdsWizz AudioGO start at $250 per campaign. Ask for as-run logs and a written make-good policy.
Advertising & ad-tech research