

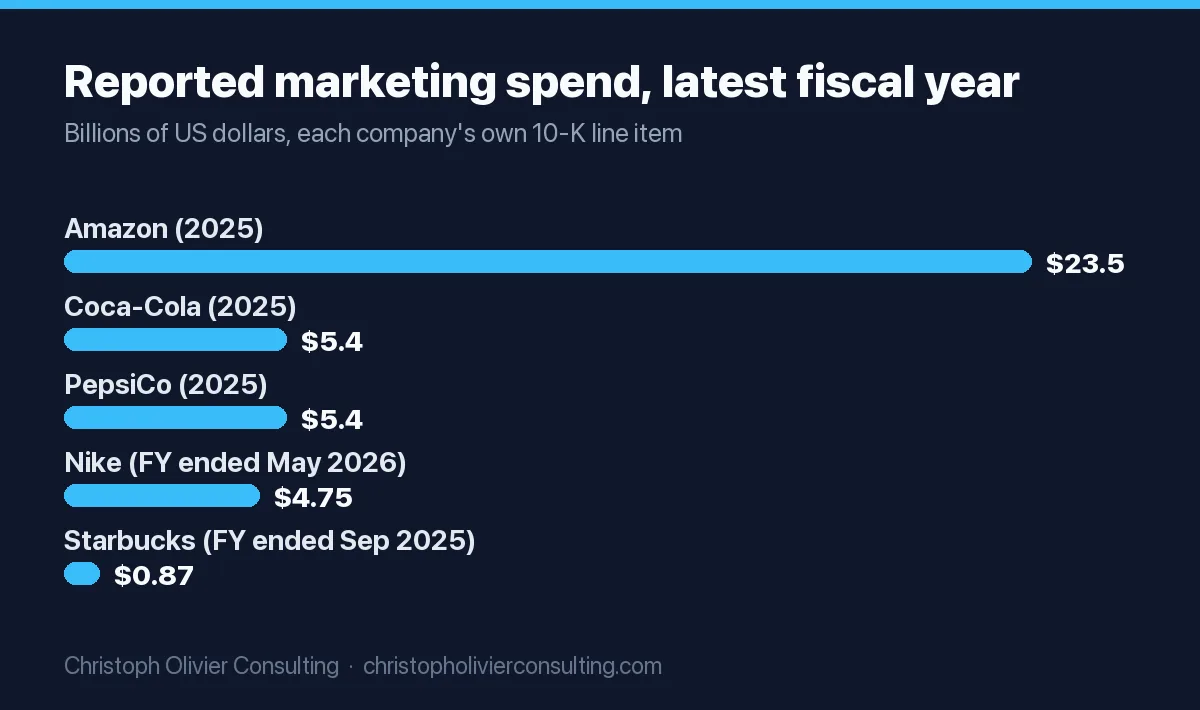
Amazon spent $23.5 billion on “advertising and other promotional costs” in 2025, the largest disclosed figure among the big brands people ask about. Coca-Cola reported $5.4 billion of advertising, PepsiCo $5.4 billion of advertising and other marketing activities, Nike $4,754 million of “demand creation” in the fiscal year to May 2026, and Starbucks $869.5 million in fiscal 2025. Apple, Tesla and Zara owner Inditex publish no figure, Red Bull is private, and LVMH states its advertising and promotion only as a share of revenue: 11.4%.
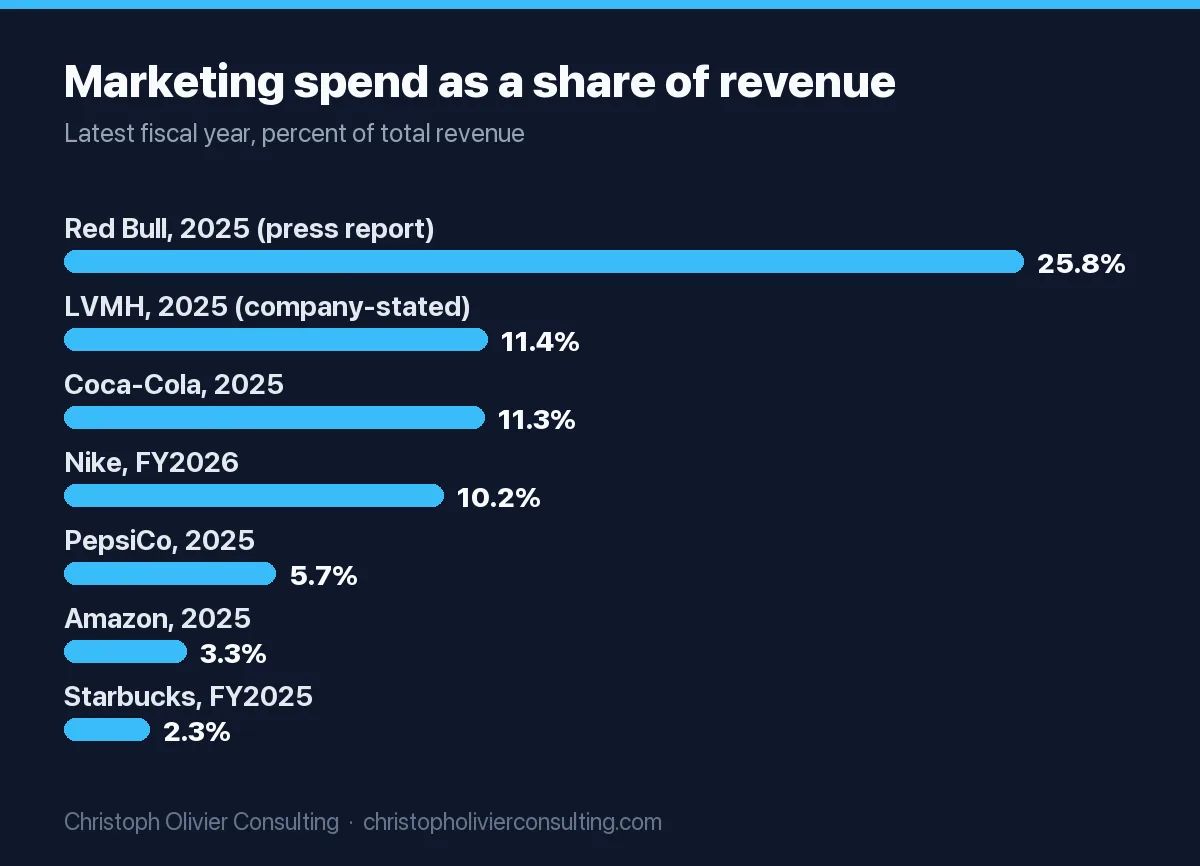
Short answer: Nike: $4.75 billion of demand creation (FY2026, 10.2% of revenue). Coca-Cola: $5.4 billion of advertising (2025, 11.3%). Amazon: $23.5 billion (2025, 3.3%). PepsiCo: $5.4 billion (5.7%). Starbucks: $869.5 million (2.3%). Apple, Tesla and Zara do not disclose a number. Red Bull: about EUR 3.15 billion per press reports of its 2025 group accounts.
Every number below comes from the company’s own annual filing, read on SEC EDGAR or the company’s investor site in November 2026. The one exception is Red Bull, a private company, where the marketing figure is a press report and is labeled that way. Each row keeps the company’s exact line-item name, because “marketing budget” covers something different in almost every filing.
Big brand marketing budgets compared (latest fiscal year)
Spend and revenue in each row come from the same filing. The percentage is calculated, with one formula for every company:
Marketing spend as % of revenue = disclosed spend ÷ total revenue × 100. Worked example, Nike FY2026: $4,754 million ÷ $46,398 million × 100 = 10.2%.
| Company (brand searched) | Exact line item in the filing | Fiscal year end | Spend (reported) | Revenue (same filing) | % of revenue | Source |
|---|---|---|---|---|---|---|
| Amazon | “Advertising and other promotional costs” | Dec 31, 2025 | $23.5 billion | $716,924 million | 3.3% | Amazon 10-K, 2025 |
| Coca-Cola | “Advertising costs” (MD&A: “advertising expenses”) | Dec 31, 2025 | $5.4 billion | $47,941 million | 11.3% | Coca-Cola 10-K, 2025 |
| PepsiCo (Pepsi) | “Advertising and other marketing activities”, including “advertising expenses” of $3.4 billion | Dec 27, 2025 | $5.4 billion | $93,925 million | 5.7% (advertising alone: 3.6%) | PepsiCo 10-K, 2025 |
| Nike | “Demand creation expense” | May 31, 2026 | $4,754 million | $46,398 million | 10.2% | Nike 10-K, FY2026 |
| Starbucks | “Advertising expenses” | Sep 28, 2025 | $869.5 million | $37,184.4 million | 2.3% | Starbucks 10-K, FY2025 |
| LVMH (Louis Vuitton) | “Advertising and promotion expenses”, stated only as a share of revenue | Dec 31, 2025 | Not stated in euros (11.4% implies about EUR 9.2 billion) | EUR 80,807 million | 11.4% (company-stated) | LVMH 2025 Financial Documents |
| Red Bull | Private, no filing. Marketing spend per press report of the 2025 group accounts | 2025 | About EUR 3.15 billion (press report) | EUR 12.196 billion (company) | 25.8% (press report) | trend.at, Red Bull |
| Apple | Not disclosed since fiscal 2015 | Sep 26, 2026 | Not disclosed | $478,834 million | n/a | Apple 10-K, FY2026 |
| Tesla | Not disclosed; called “immaterial” for 2019 to 2021 | Dec 31, 2025 | Not disclosed | $94,827 million | n/a | Tesla 10-K, 2025 |
| Inditex (Zara) | No advertising line in the consolidated accounts | Jan 31, 2026 | Not disclosed | EUR 39,864 million | n/a | Inditex 2025 annual accounts |
Three reading notes. Coca-Cola and PepsiCo round their figures to the nearest $0.1 billion, so their percentages can move by about a tenth of a point. LVMH and Inditex report in euros; the euro figures are shown as filed, never converted. “Not disclosed” means the latest annual filing contains no dollar or euro figure for advertising, not that the company spends nothing.
Why the percentages range from 2% to 26%
Size does not decide the ratio. Amazon has the biggest budget and one of the lowest percentages. Red Bull has a fraction of Amazon’s budget and the highest percentage. Four things explain the spread, and every one of them is visible in the filings.
- What the line includes. Nike’s demand creation includes athlete endorsement contracts. PepsiCo’s $5.4 billion leaves out the in-store payments and discounts it records as a reduction of revenue. Amazon’s $23.5 billion leaves out the cost of Prime and shipping offers, which it calls marketing tools but books elsewhere. LVMH separates advertising and promotion (11.4%) from its much larger marketing and selling expenses (37.0%).
- What the revenue includes. Coca-Cola earns a significant portion of its revenue by selling concentrates and syrups to independent bottlers, so its revenue base is small relative to the drinks consumers buy, and its percentage looks high. Amazon’s $716.9 billion of net sales includes AWS and third-party seller services, which dilutes the ratio.
- Whether the brand is the product. Red Bull, at roughly 26%, and LVMH, at 11.4%, sell a brand as much as a drink or a handbag.
- Whether the company owns its storefront. Starbucks (2.3%) and Amazon (3.3%) put their own stores, app and website in front of customers every day. That traffic does marketing work that never appears in the advertising line.
Marketing budget for Nike: $4.75 billion in “demand creation” (FY2026)
Nike does not use the word advertising for its headline marketing line. Its 10-K for the fiscal year ended May 31, 2026 reports demand creation expense of $4,754 million on revenues of $46,398 million, which is 10.2%. The filing defines the line: “Demand creation expense consists of brand marketing expense and sports marketing expense. Brand marketing expense includes advertising and promotion costs such as production and media costs, digital marketing expense, brand events and retail brand presentation costs. Sports marketing expense includes expenses related to endorsement contracts, complimentary product and sports marketing events.”
So Nike’s figure is not a media budget. It includes athlete contracts and free product, which is why some data sites that label it “advertising and promotion costs” are describing only part of it. The three-year trend is the more useful number for an owner:
- FY2024: $4,285 million on $51,362 million of revenue (8.3%).
- FY2025: $4,689 million (up 9%) while revenue fell 10% to $46,309 million (10.1%).
- FY2026: $4,754 million (up 1%) on flat revenue of $46,398 million (10.2%). Nike attributes the increase to “higher sports marketing expense and unfavorable changes in foreign currency exchange rates, partially offset by lower brand marketing expense.”
In other words, Nike raised demand creation in the same year sales dropped by $5 billion. My read: that is a deliberate bet that cutting brand spend in a slump costs more later than it saves now.
Nike demand creation by region
The 10-K splits demand creation by operating segment. Global Brand Divisions holds the central brand spend that is not assigned to a region.
| Nike segment, FY2026 | Revenues | Demand creation expense | % of segment revenue |
|---|---|---|---|
| North America | $20,511 million | $1,730 million | 8.4% |
| Europe, Middle East & Africa | $12,572 million | $1,286 million | 10.2% |
| Greater China | $5,847 million | $455 million | 7.8% |
| Asia Pacific & Latin America | $6,243 million | $416 million | 6.7% |
| Converse | $1,174 million | $95 million | 8.1% |
| Global Brand Divisions (central brand spend) | n/a | $763 million | n/a |
| Corporate | n/a | $9 million | n/a |
| Total Nike, Inc. | $46,398 million | $4,754 million | 10.2% |
Marketing budget for Coca-Cola: $5.4 billion in advertising (2025)
Coca-Cola’s 2025 10-K states: “Advertising costs included in the line item selling, general and administrative expenses in our consolidated statements of income were $5.4 billion, $5.1 billion and $5.0 billion in 2025, 2024 and 2023, respectively.” Net operating revenues were $47,941 million, so advertising ran at 11.3% of revenue. It was also about 37% of the company’s $14,521 million of selling, general and administrative expenses, and the MD&A lists “higher advertising expenses” among the reasons that line moved.
The $5.4 billion is the company’s own spend, not the whole system’s. Coca-Cola generates “a significant portion” of its revenue by selling concentrates and syrups to independent bottlers, and the filing explains: “In addition to conducting our own independent advertising and marketing activities, we may provide promotional and marketing support and/or funds to our bottlers.” What bottlers spend on local marketing from their own pockets is not in this number.
Marketing budget for Pepsi: $5.4 billion, of which $3.4 billion is advertising
PepsiCo does not report a figure for the Pepsi brand alone. At the company level, its 10-K for the year ended December 27, 2025 says: “Advertising and other marketing activities, reported as selling, general and administrative expenses, totaled $5.4 billion in 2025, $5.9 billion in 2024 and $5.7 billion in 2023, including advertising expenses of $3.4 billion in 2025, $3.9 billion in 2024 and $3.8 billion in 2023.” On net revenue of $93,925 million, that is 5.7% for advertising and marketing, and 3.6% for advertising alone.
The bigger lever sits outside that line. PepsiCo explains that “sales incentives and discounts are primarily accounted for as a reduction of revenue and include payments to customers for performing activities on our behalf, such as payments for in-store displays, payments to gain distribution of new products, payments for shelf space and discounts to promote lower retail prices.” The filing calls the combined pool “total marketplace spending” but does not total it. Spend fell by $0.5 billion in 2025, and several divisions cite “lower advertising and marketing expenses” as a profit factor.
Coca-Cola versus PepsiCo is the cleanest example in this table of why percentages mislead: the same $5.4 billion is 11.3% of one company’s revenue and 5.7% of the other’s, because PepsiCo’s revenue base, which includes a large convenient-food business, is almost twice Coca-Cola’s.
What is Amazon’s marketing budget? $23.5 billion in advertising (2025)
Amazon’s 2025 10-K states: “Advertising and other promotional costs to market our products and services are expensed as incurred and were $20.3 billion, $21.4 billion, and $23.5 billion in 2023, 2024, and 2025.” Against total net sales of $716,924 million, that is 3.3%.
Amazon also reports a broader income-statement line, sales and marketing, of $47,129 million in 2025 (6.6% of net sales). The 10-K says it includes “advertising and payroll and related expenses for personnel engaged in marketing and selling activities, including sales commissions related to AWS.” It names the channels: “sponsored search, third-party customer referrals, social and online advertising, television advertising, and other initiatives,” and says the 2025 increase was “primarily due to increased third-party advertising expenses.”
One more line explains why Amazon’s percentage is low: “While costs associated with Amazon Prime membership benefits and other shipping offers are not included in sales and marketing expense, we view these offers as effective worldwide marketing tools.” Do not confuse this spend with Amazon’s advertising revenue, the money it earns selling sponsored ads to sellers and brands. That is a separate, revenue-side number.
Marketing budget for Starbucks: $869.5 million (fiscal 2025)
Starbucks’ 10-K for the fiscal year ended September 28, 2025 states: “Advertising expenses totaled $869.5 million, $597.3 million, and $507.8 million in fiscal 2025, 2024, and 2023, respectively.” On total net revenues of $37,184.4 million, that is 2.3%, up from 1.7% the year before. The dollar increase was 46% in one year.
The filing shows where the money landed: store operating expenses as a share of company-operated store revenue rose 410 basis points, including “increased marketing (approximately 90 basis points).” The fiscal 2026 10-K had not been posted on EDGAR as of November 9, 2026, so fiscal 2025 is the latest disclosed year.
Marketing budget for Apple: not disclosed since fiscal 2015
Apple’s 10-K for the fiscal year ended September 26, 2026 contains no advertising expense figure. Advertising appears only on the revenue side: “Services net sales increased during 2026 compared to 2025 primarily due to higher net sales from advertising and cloud services.” Marketing sits inside selling, general and administrative expense of $29,774 million, a line that holds many non-marketing costs, so it cannot stand in for a marketing budget. Apple says the 2026 increase in that line was “driven by various factors, none of which were significant individually or in the aggregate.”
The last year Apple gave a number was fiscal 2015. That 10-K reads: “Advertising expense was $1.8 billion, $1.2 billion and $1.1 billion for 2015, 2014 and 2013, respectively.” Against fiscal 2015 net sales of $233,715 million, that was 0.8%. From the fiscal 2016 10-K on, Apple kept the policy sentence (“Advertising costs are expensed as incurred and included in selling, general and administrative expenses”) and dropped the amount. Any current Apple figure you find online is a third-party estimate of tracked media, not Apple’s number.
Marketing budget for Tesla: last disclosed at $70 million (2018)
The “Tesla spends $0 on marketing” line is not what Tesla’s filings say. Its 10-Ks reported marketing, promotional and advertising costs every year from 2015 to 2018, then described them as immaterial, then dropped the note.
| Tesla fiscal year | Marketing, promotional and advertising costs as disclosed | Filing |
|---|---|---|
| 2015 | $58.3 million | 2017 10-K |
| 2016 | $48.0 million | 2018 10-K |
| 2017 | $66.5 million | 2018 10-K |
| 2018 | $70.0 million (0.33% of $21,461 million revenue) | 2018 10-K |
| 2019 to 2021 | “immaterial” | 2021 10-K |
| 2022 to 2025 | Note no longer included; no figure | 2025 10-K |
The 2018 10-K reads: “We incurred marketing, promotional and advertising costs of $70.0 million, $66.5 million and $48.0 million in the years ended December 31, 2018, 2017 and 2016, respectively.” The 2021 10-K says these costs “were immaterial for the years ended December 31, 2021, 2020 and 2019.” The 2025 10-K gives no figure and says: “Historically, we have been able to achieve sales without relying on traditional advertising and at relatively low marketing costs. We continue to monitor our public narrative and brand, and tailor our marketing efforts accordingly, including through investments in customer education and advertising as necessary.” Tesla’s 2025 revenue was $94,827 million.
Marketing budget for Red Bull: about EUR 3.15 billion (2025, press report)
Red Bull GmbH is privately held and files no 10-K. What the company publishes on its company profile: 13.969 billion cans sold in 2025, and “Group turnover was up 8.6% from EUR 11.227 billion to EUR 12.196 billion.” It employed 21,924 people and sold in 178 countries.
Red Bull does not publish a marketing figure on that page. The Austrian business magazine trend reported in October 2026, from the group’s consolidated accounts, that marketing spend rose 15% to EUR 3.15 billion, or 25.8% of revenue, after 24.4% the year before. That works out to about 23 euro cents of marketing per can sold (EUR 3.15 billion ÷ 13.969 billion cans). Treat this as a credible press report, not a company disclosure; the same article notes that the separate accounts of Red Bull GmbH itself were not yet available.
Marketing budget for Louis Vuitton: LVMH spends 11.4% of revenue on advertising and promotion
LVMH does not break out marketing for Louis Vuitton or any other Maison. At group level, its 2025 Financial Documents state that “advertising and promotion expenses, which amounted to 11.4% of revenue, were down 3% on a constant consolidation scope and currency basis.” Group revenue was EUR 80,807 million. LVMH gives the percentage, not the euro amount; 11.4% of EUR 80,807 million is about EUR 9.2 billion, a derived figure.
The definition is broad: “Advertising and promotion expenses include the costs of producing advertising media, purchasing media space, manufacturing samples, publishing catalogs and, in general, the cost of all activities designed to promote the Group’s brands and products.” Total marketing and selling expenses, which also include the costs of the Maisons’ retail networks, were EUR 29,914 million, or 37.0% of revenue. Louis Vuitton reports inside Fashion and Leather Goods, which had revenue of EUR 37,770 million in 2025 (EUR 41,060 million in 2024) and profit from recurring operations of EUR 13,209 million.
Marketing budget of Zara: Inditex does not disclose one
Zara belongs to Inditex, whose 2025 consolidated annual accounts cover February 1, 2025 to January 31, 2026. Net sales were EUR 39,864 million. The accounts contain no advertising line. Note 6 splits other operating expenses of EUR 4,879 million into indirect selling expenses (EUR 3,028 million), administrative expenses (EUR 563 million), maintenance, repairs and utilities (EUR 786 million) and others (EUR 502 million).
The note says indirect selling expenses include “mainly expenses relating to store and online operations, commissions on credit, debit card payments, logistics and shipping to customers,” and that “others” include “mainly travel, communications and other operating expenses.” Whatever Zara spends on advertising is folded into those lines. Any Zara advertising figure you see quoted is an outside estimate.
What a smaller business can learn from big brand budgets
Do not copy a big brand’s percentage. Copy the way it defines and protects the budget. Match your business to the closest model below, then set the number from businesses your size using the marketing budget benchmarks by industry and the method in how to set a marketing budget.
| If your business looks like this | Closest filer | What its filing shows | What to do with your own budget |
|---|---|---|---|
| You sell through partners, dealers or resellers who also market | Coca-Cola | Gives “promotional and marketing support and/or funds” to bottlers on top of its own advertising | Budget your own spend and partner co-op support as two separate lines, then add them for the real total |
| You win business with discounts, promotions or retailer incentives | PepsiCo | Books most sales incentives and discounts as a reduction of revenue, outside its $5.4 billion | Track discounts next to the marketing budget, or your percentage will look lower than your true spend |
| You pay people to represent you (referral partners, ambassadors, sponsorships) | Nike | Counts endorsement contracts inside demand creation | Put referral fees and sponsorships in the marketing budget, not overhead |
| You own a high-traffic channel (locations, a busy site, an app) | Starbucks, Amazon | Starbucks raised advertising 46% in one year; Amazon calls Prime and shipping offers “effective worldwide marketing tools” outside its marketing line | Value what your owned channel already does before buying more reach |
| Your growth comes from a founder’s profile and word of mouth | Tesla | Spent $70.0 million in 2018, then called the cost immaterial, while keeping advertising “as necessary” | Low paid spend can work, but write down the trigger that would make you start paying |
| Your brand is the main reason people buy | Red Bull, LVMH | About 26% and 11.4% of revenue | Expect brand spend in double digits of revenue and plan cash flow for it |
Three rules hold across every filing above. First, write down what your marketing budget includes before you compare it to anyone, because Nike, PepsiCo and Amazon would each report a different percentage for the same activity. Second, separate advertising from the wider marketing and sales cost, the way Amazon and LVMH do; it is the only way to see whether paid media is pulling its weight. Third, decide in advance what you do when revenue falls. Nike raised demand creation 9% in a year its revenue fell 10%, and that is a choice, not an accident. The marketing budget framework for 7-figure businesses shows how to set those rules for a firm your size, and the CMO and marketing budget statistics for 2026 show where survey benchmarks come from and what they leave out.
If the line between the two terms is fuzzy for your team, the guide to the difference between advertising and marketing is a useful primer before you split the budget. And if you want a second opinion on your own percentage, you can book a consultation.
How to look up any public company’s ad spend on EDGAR in 3 minutes
This is the exact method used for every SEC figure on this page. It is free and needs no account.
- Open EDGAR full-text search. It covers every electronic filing since 2001, according to the SEC’s search FAQ.
- In the company box, type the name or ticker (for example KO).
- In the word-or-phrase box, paste:
"advertising costs" OR "advertising expense" OR "advertising expenses" OR "promotional costs". Quotation marks force the exact phrase; OR returns filings with any of them. - Filter the form type to 10-K. Many foreign companies listed in the US file a 20-F instead.
- Open the newest result and press Ctrl+F (Cmd+F on a Mac) for
advertis. The figure is usually one sentence in the accounting-policies note near the start of the financial statement notes, with three years of numbers. - No hit? Search the company’s own term from the table below, such as “demand creation” for Nike.
- In the same filing, take total revenue from the income statement and calculate spend ÷ revenue × 100.
- Shortcut for a time series: open
https://data.sec.gov/api/xbrl/companyconcept/CIK##########/us-gaap/AdvertisingExpense.jsonwith the company’s 10-digit CIK (Coca-Cola’s example). If it returns nothing, tryMarketingAndAdvertisingExpense(Nike tags demand creation this way) orMarketingExpense(Amazon tags its sales and marketing line this way). - Still nothing? Write “not disclosed”. Do not fill the gap with a SG&A figure.
Search phrases that find marketing spend in 10-K filings
| Search phrase (with quotes) | Who uses it | What it covers |
|---|---|---|
| “advertising costs” | Coca-Cola, many US filers | Usually media plus production, in Note 1 accounting policies |
| “advertising expenses” | Starbucks, PepsiCo, Coca-Cola MD&A | Paid advertising only |
| “promotional costs” | Amazon | Advertising plus other promotion |
| “demand creation” | Nike | Brand marketing plus sports marketing (endorsements) |
| “advertising and other marketing activities” | PepsiCo | Advertising plus other marketing, excluding trade discounts booked against revenue |
| “marketing, promotional and advertising costs” | Tesla (through its 2021 10-K) | All three combined |
| “sales and marketing” | Amazon, most software companies | Advertising plus marketing and sales payroll; much broader |
Ready to scale your revenue?
Book a free 30-min consultation. We’ll diagnose your growth bottleneck and map out the 3 highest-leverage moves for your business.
Frequently asked questions
What is Nike's marketing budget?
Nike reported demand creation expense of $4,754 million for the fiscal year ended May 31, 2026, which is 10.2% of its $46,398 million in revenue. Demand creation is Nike's name for brand marketing (advertising, digital, events, retail presentation) plus sports marketing (athlete endorsements, free product and sports events). It was $4,689 million the year before.
How much does Coca-Cola spend on marketing?
Coca-Cola's 2025 10-K reports advertising costs of $5.4 billion, up from $5.1 billion in 2024 and $5.0 billion in 2023. On net operating revenues of $47,941 million, that is about 11.3%. The figure covers the company's own advertising; marketing that independent bottlers fund themselves is not included.
What is Amazon's marketing budget?
Amazon spent $23.5 billion on advertising and other promotional costs in 2025, according to its 10-K, up from $21.4 billion in 2024. That is 3.3% of $716,924 million in net sales. Its broader sales and marketing line, which adds marketing and sales payroll, was $47,129 million. Prime and shipping offers are excluded.
How much does Apple spend on marketing?
Apple does not say. Its latest 10-K, for the fiscal year ended September 26, 2026, gives no advertising figure. The last disclosed number was $1.8 billion of advertising expense in fiscal 2015, about 0.8% of net sales that year. Current figures quoted online are third-party estimates of tracked media.
Does Tesla have a marketing budget?
Tesla spends on marketing but no longer reports the amount. Its 10-Ks disclosed marketing, promotional and advertising costs of $70.0 million in 2018, then called them immaterial for 2019 to 2021, then dropped the note. The 2025 10-K says Tesla invests in customer education and advertising as necessary.
How much does Red Bull spend on marketing?
Red Bull is private and files no 10-K. The Austrian magazine trend reported, from the 2025 group accounts, marketing spend of about EUR 3.15 billion, 25.8% of revenue. Red Bull itself publishes 2025 group turnover of EUR 12.196 billion and 13.969 billion cans sold, so that is roughly 23 euro cents per can.
What is the marketing budget of Zara and Louis Vuitton?
Neither brand's budget is disclosed. Zara's owner Inditex shows no advertising line in its 2025 accounts (net sales EUR 39,864 million). Louis Vuitton's owner LVMH says group advertising and promotion was 11.4% of its EUR 80,807 million revenue in 2025, about EUR 9.2 billion, with no split by brand.