
Last reviewed: October 2026
A typical GA4 bounce rate sits in the high 30s to high 40s percent, depending on industry. Databox’s September 2024 benchmark put the cross-industry median at 44.04%, ranging from 35.76% for apparel and footwear to 48.38% for IT services, and Siege Media’s 2026 study of 546 GA4 properties found a median engagement rate of 51%, which implies a typical bounce rate around 49%.
This page gives you the verified benchmarks by industry, channel and device, explains exactly how GA4 calculates bounce rate now, and shows you how to judge your own number by page type. It ends with a diagnostic process and a worked example, because a benchmark is only useful once you know why your number differs from it.
What is a good bounce rate in 2026?
In GA4, a bounce rate under roughly 45% is in line with the cross-industry median, and a bounce rate in the low 40s or below is better than typical for most sectors. The fairer test is your own baseline: compare the same page type, channel and device over time, not your whole site against one industry average.
Two current datasets anchor that range:
- Databox’s content marketing benchmarks report a median GA4 bounce rate of 44.04% and a median engagement rate of 56.21% for September 2024, across 15 industries.
- Siege Media’s GA4 engagement rate benchmarks report a median engagement rate of 51% across 546 properties and more than 16 billion sessions from January 2024 to August 2026. Siege calls 50% or higher “good” and anything above 55% strong.
Because GA4 bounce rate is simply the share of sessions that were not engaged, a 51% engagement rate and a 49% bounce rate describe the same thing. Keep that in mind when sources quote one metric and you track the other.
How GA4 calculates bounce rate (and why old benchmarks mislead)
GA4 defines bounce rate as the percentage of sessions that were not engaged. An engaged session lasts longer than 10 seconds, includes a key event, or has two or more page or screen views. Universal Analytics counted a bounce as any single-page session, so the two numbers measure different behavior and should never be compared directly.
Google’s own documentation spells out both definitions:
- GA4: Google’s engagement rate and bounce rate article defines engagement rate as the percentage of engaged sessions and bounce rate as the percentage of sessions that were not engaged. The two always add up to 100% for the same set of sessions.
- Universal Analytics: the legacy UA bounce rate article defined a bounce as a single-page session that sent only one request to the Analytics server. Bounce rate was single-page sessions divided by all sessions.
The practical difference is large for content pages. A visitor who reads one article for three minutes and leaves was a bounce in UA. In GA4 that visit is engaged, because it lasted longer than 10 seconds. That is why a blog-heavy site can see its bounce rate fall sharply after a switch to GA4, and why any benchmark built on UA data (anything quoting single-page sessions) is not a fair yardstick for a GA4 number.
The engaged session timer is adjustable
The 10-second threshold is a default, not a constant. Google’s session settings help article shows the path: Admin, Data Streams, choose a web stream, Configure tag settings, Show all, Adjust session timeout, where you can set the number of seconds before a session counts as engaged. If you raise the timer, your bounce rate goes up and your numbers stop being comparable to published benchmarks, most of which use the default. If you inherited a property, check this setting before you benchmark anything. My GA4 setup guide covers the other configuration mistakes that quietly distort engagement data.
Average engagement time is a separate metric
Google describes user engagement as the time your page is in focus or your app screen is in the foreground, recorded in milliseconds and sent when the user leaves or switches away, per its user engagement documentation. Average engagement time is not the same as average session duration, which several benchmark reports use. Do not compare one against the other.
Bounce rate benchmarks by industry
Median GA4 bounce rates by industry range from about 36% to 48%. Databox’s September 2024 data shows apparel and footwear lowest at 35.76%, while consulting and professional services (47.84%), SaaS (48.27%), technology (48.28%) and IT services (48.38%) cluster at the top. B2B and considered-purchase sectors bounce more than retail.
The table below reproduces all 15 industries from Databox’s September 2024 benchmark, including engagement rate and average session duration.
| Industry | Median bounce rate | Median engagement rate | Median avg. session duration |
|---|---|---|---|
| Apparel & Footwear | 35.76% | 60.03% | 2m 40s |
| Ecommerce & Marketplaces | 38.61% | 60.71% | 2m 38s |
| Travel & Leisure | 38.84% | 60.71% | 3m 1s |
| Food | 38.93% | 55.53% | 2m 37s |
| Health & Wellness | 39.41% | 61.74% | 2m 58s |
| Automotive | 40.10% | 61.48% | 2m 51s |
| Health Care | 40.94% | 59.10% | 2m 40s |
| Industrials & Manufacturing | 41.78% | 57.85% | 2m 38s |
| Real Estate | 42.14% | 59.57% | 2m 43s |
| Construction | 45.28% | 55.06% | 2m 22s |
| Education | 46.28% | 53.82% | 2m 53s |
| Consulting & Professional Services | 47.84% | 52.97% | 2m 33s |
| SaaS | 48.27% | 52.93% | 2m 34s |
| Technology | 48.28% | 53.34% | 2m 43s |
| Information Technology & Services | 48.38% | 52.91% | 2m 40s |
| All industries (median) | 44.04% | 56.21% | 2m 38s |
Note two things. First, the bounce and engagement columns do not add up to 100% per row. Each column is a separate median across the companies in that industry, so the median bounce rate and the median engagement rate can come from different sites. Second, Databox does not disclose its sample size, so treat the gaps between neighboring industries (a point or two) as noise.
Siege Media’s larger 2026 sample shows the same pattern from the engagement side. Its industry medians run from 54.4% for ecommerce and retail down to 46.6% for SaaS and B2B software, with health and wellness at 51.6%, finance and fintech at 51.0% and home services at 49.4%. Siege attributes the B2B gap to traffic landing on top-of-funnel content during long research cycles.
What this means for professional-service firms
If you run a law, accounting, advisory or consulting firm, your fair comparison is the consulting and professional services row: a median bounce rate near 48% and engagement near 53%. A firm site bouncing at 50% is not broken. A firm site bouncing at 70% usually has a fixable problem in traffic mix, page speed or landing-page intent, which the diagnostic section below walks through.
Engagement and bounce rate by channel
Traffic source predicts engagement more strongly than industry. In Siege Media’s 2026 data, organic search sessions had a median engagement rate of 63.4% (about 37% bounce), while paid social had just 20.2% (about 80% bounce). Intent-driven channels engaged roughly three times as well as interruption-based ones.
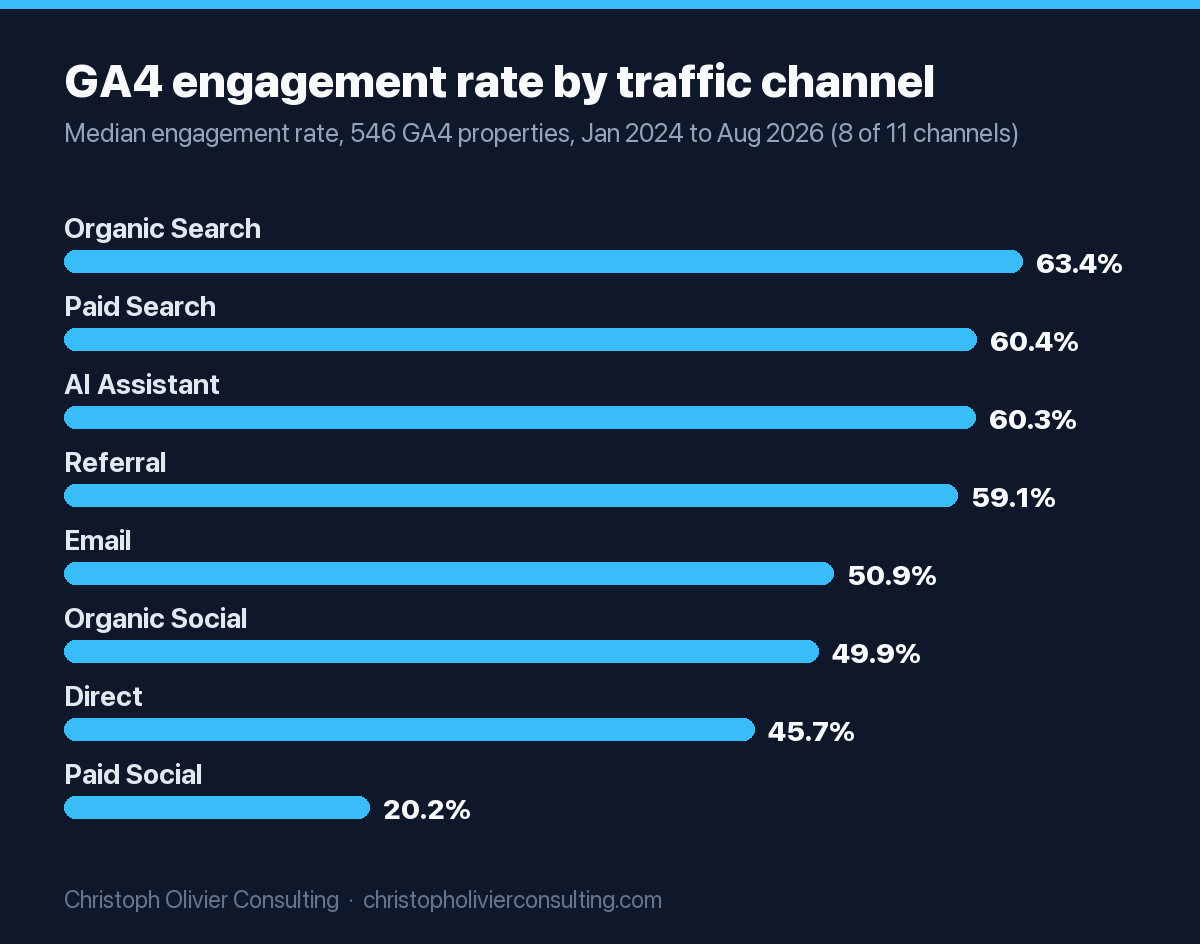
| Channel (GA4 default grouping) | Median engagement rate | Implied bounce rate |
|---|---|---|
| Organic Search | 63.4% | 36.6% |
| SMS | 63.1% | 36.9% |
| Paid Search | 60.4% | 39.6% |
| AI Assistant | 60.3% | 39.7% |
| Referral | 59.1% | 40.9% |
| 50.9% | 49.1% | |
| Organic Social | 49.9% | 50.1% |
| Direct | 45.7% | 54.3% |
| Display | 31.9% | 68.1% |
| Unassigned | 20.8% | 79.2% |
| Paid Social | 20.2% | 79.8% |
Source: Siege Media, 546 GA4 properties, January 2024 to August 2026. Implied bounce rate is 100% minus the median engagement rate; per-channel medians are computed separately, so treat implied bounce as approximate.
Contentsquare’s large-scale panels point the same way. Its 2024 Digital Experience Benchmark, built on more than 43 billion sessions across 3,590 websites in 2023, found paid social and display among the channels with the highest bounce rates and lowest conversion rates, while paid search converted at 2.55%. Its 2025 report found that sites that increased their reliance on paid social saw bounce rates rise 9.2%, page views fall 8.7% and conversions fall 10.6%.
If your site-wide bounce rate jumped, check whether your channel mix shifted before you rewrite a page. A new paid social campaign can raise the average while every page performs as before.
Bounce rate benchmarks by device
Mobile sessions bounce more than desktop sessions in every dataset reviewed here. Siege Media’s 2026 median engagement rate was 55.3% on desktop, 51.2% on tablet and 48.8% on mobile. Contentsquare’s 2020 benchmark, using a single-page definition, reported average bounce rates of 43% on desktop, 45% on tablet and 51% on mobile.
| Device | Siege Media 2026: median engagement rate | Contentsquare 2020: average bounce rate |
|---|---|---|
| Desktop | 55.3% | 43% |
| Tablet | 51.2% | 45% |
| Mobile | 48.8% | 51% |
Sources: Siege Media GA4 benchmarks; Contentsquare 2020 Digital Experience Benchmark (400 websites, 7 billion+ sessions, 12 months of data). The two columns use different metrics and definitions, so read each column on its own.
Siege notes that desktop engages nearly seven points higher than mobile, so device mix alone can move your overall rate. If your audience shifted toward mobile, a rising bounce rate may not mean your content got worse.
Why bounce rate benchmarks disagree
Published bounce rate benchmarks differ because they use different definitions, samples, time periods and statistics. Some report GA4 non-engaged sessions, others report single-page visits; some use medians, others averages; some disclose sample size, others do not. Always check those four things before you compare your number to a published figure.
| Source | Data period | Sample | What “bounce” means | Headline figure |
|---|---|---|---|---|
| Databox | September 2024 | Not disclosed, 15 industries | GA4 non-engaged session | 44.04% median bounce rate |
| Databox (earlier) | August 2023 | Not disclosed, 15 industries | GA4 non-engaged session | 44.82% median bounce rate; 56.23% median engagement rate |
| Siege Media | Jan 2024 to Aug 2026 | 546 GA4 properties, 16B+ sessions | GA4 engagement rate (bounce is the inverse) | 51% median engagement rate |
| Contentsquare 2020 | 12 months (report published 2020) | 400 websites, 7B+ sessions, 9 industries | Visitor leaves after one page | 47% average across industries |
| Contentsquare 2026 | Q4 2024 vs Q4 2025 | 6,500+ websites, 99B sessions | Platform metric (industry detail gated) | Engagement down 10% year on year |
A few rules follow from this:
- Medians beat averages for benchmarking. A handful of very large sites can drag an average. Siege explicitly reports medians so high-traffic sites do not distort what is typical.
- Single-page definitions run higher for content sites. A one-page visit that lasts two minutes is a bounce under the old definition and an engaged session in GA4.
- Older numbers drift. Contentsquare’s 2026 benchmark recorded a 10% year-on-year drop in engagement and a 3.8% drop in visits, so a 2019 figure describes a different web.
- Undisclosed samples deserve wide error bars. Use them for direction only.
What is a good bounce rate by page type?
A good bounce rate depends on what the page is for. Pages built to send visitors deeper, like home pages, service pages and pricing pages, should bounce less. Pages built to answer one question, like blog posts, contact pages and single-page sites, can bounce more and still succeed.
Google’s own UA guidance said a high bounce rate is normal for blogs and single-page sites. No reliable public dataset breaks GA4 bounce rate out by page type, so the table below gives directional expectations and the metric to check instead. Treat it as a reading guide, not a set of targets.
| Page type | Expected bounce vs. your site median | What a high bounce usually means | Better metric to pair with it |
|---|---|---|---|
| Home page | Lower | Unclear navigation or the wrong audience landing | Clicks to service or contact pages |
| Service or practice-area page | Lower | Weak match between the query and the offer, or no next step | Key event rate (form, call, booking) |
| Paid landing page | Varies with offer | Ad promise and page headline do not match | Conversion rate by campaign |
| Blog post or guide | Higher | Often nothing: the reader got the answer. Check time first | Average engagement time, scroll events |
| Contact or thank-you page | Higher | Usually expected behavior | Form submissions |
| Pricing page | Lower | Sticker shock or missing proof | Next-page path, demo or quote requests |
For lead-generation sites, the metric that pays the bills is conversion, not bounce. Pair this page with our conversion rate benchmarks by industry so you judge each page on the outcome it was built for.
How to diagnose a high bounce rate in GA4
Diagnose a high bounce rate by segmenting before you change anything. Break bounce rate out by landing page, channel and device, compare each segment with its own benchmark, and find the specific pages and sources that moved. Most site-wide spikes trace back to one channel, one device or a handful of pages.
- Confirm the setup. Check the engaged session timer, key event configuration and whether the GA4 tag fires on every page. A missing tag on a thank-you page or a duplicated tag will distort engagement.
- Open the Landing page report. In GA4, go to Reports, Engagement, Landing page, and add bounce rate and engagement rate via Customize report if they are not shown. Sort by sessions so you focus on pages with real volume.
- Add a channel comparison. Add Session default channel group as a secondary dimension. Compare each channel against the channel table above rather than the site average.
- Split by device. If mobile bounce is far above desktop on the same pages, suspect layout, pop-ups or load time on mobile rather than content.
- Compare time periods. Look at the same pages over the previous period and the same period last year to separate a real change from seasonality.
- Check intent match. For your highest-bounce organic pages, look up the queries driving them in Search Console. If the query and the page answer different questions, the bounce is an intent problem.
- Watch real sessions. A session recording or heatmap tool shows what visitors saw before they left. Our guide to marketing analytics tools covers which tools fit which budget.
How to reduce bounce rate
Reduce bounce rate by fixing the causes in order of impact: match each page to the intent of the traffic it receives, make it load fast on mobile, put the answer or offer above the fold, and give every page one clear next step. Cutting low-intent paid traffic can lower bounce rate without changing a page.
Match the page to the intent
Siege Media ranks intent match as the highest-impact lever in its engagement research. In practice, that means the headline repeats what the visitor searched or clicked on, and the first screen answers it. A service page ranking for an informational query will bounce no matter how good the design is.
Make it fast
Speed is the most measurable fix. Google’s web.dev guide to why speed matters reports that the BBC lost an additional 10% of users for every additional second its site took to load, and that The Economic Times achieved an overall 43% better bounce rate after passing the Core Web Vitals thresholds. See our page speed and Core Web Vitals statistics for more of the data.
Fix the first screen
- Remove or delay pop-ups that cover content on mobile.
- Put the answer, the offer or the proof above the fold, not a stock-photo banner.
- Use descriptive subheadings so scanners can find their section fast.
Give people a next step
Add a relevant internal link or call to action in the body, not only in the footer. On service pages, one clear action (book a call, request a quote) usually beats a menu of five.
Clean up the traffic
Exclude placements, audiences or campaigns that send sessions that never engage. Given how far paid social and display trail other channels, this is often the fastest way to move the site-wide number, though it does not improve any page.
Worked example: benchmarking a professional-services site
This worked example shows how to benchmark a site properly by segmenting first. A hypothetical consulting firm with a 52.5% bounce rate looks worse than the 47.84% industry median, but once you split by channel, the pages are performing well and one paid social campaign explains the gap.
The numbers are illustrative, not client data. The firm records 4,000 sessions in a month:
| Channel | Sessions | Engagement rate | Engaged sessions | Channel benchmark (Siege median) |
|---|---|---|---|---|
| Organic Search | 1,800 | 60% | 1,080 | 63.4% |
| Paid Social | 900 | 18% | 162 | 20.2% |
| Direct | 700 | 44% | 308 | 45.7% |
| 300 | 55% | 165 | 50.9% | |
| Referral | 300 | 62% | 186 | 59.1% |
| Total | 4,000 | 47.5% | 1,901 |
Here is how to read it:
- Site-wide: 1,901 engaged sessions out of 4,000 is a 47.5% engagement rate, so bounce rate is 52.5%. Against the consulting and professional services median of 47.84%, that looks about five points worse.
- By channel: every channel sits within a few points of its own benchmark. Email and referral are slightly above; organic search, paid social and direct are slightly below.
- Remove the outlier: without paid social, the site has 1,739 engaged sessions out of 3,100, a 56.1% engagement rate and a 43.9% bounce rate. That beats the industry median.
- Decide: the pages are not the main problem. The question is whether the 900 paid social sessions produce leads at an acceptable cost. If they do, accept the higher bounce rate. If not, cut or retarget the campaign.
A site-wide bounce rate is a weighted blend of channels, devices and page types. Benchmark each slice against its own reference point first.
Does bounce rate affect SEO rankings?
Google has repeatedly said it does not use Google Analytics data, including bounce rate, as a ranking factor. Gary Illyes said so in 2015 and John Mueller called the idea a misconception in 2022. A high bounce rate is still worth investigating, because it often signals the same intent mismatch that weakens rankings.
The statements are collected in Search Engine Journal’s bounce rate ranking factor review. Your analytics account does not feed Google’s ranking systems. For the search metrics that do track ranking health, such as impressions, clicks, CTR and position by query, see SEO metrics that matter.
I treat bounce rate as a diagnostic, never a goal. It tells you where to look; conversion and pipeline tell you whether marketing is working. If you want a second set of eyes on which numbers your firm should actually be managing to, you can book a consultation.
Frequently asked questions
What is a good bounce rate?
In GA4, a bounce rate around 45% or lower is in line with typical sites. Databox's September 2024 benchmark put the cross-industry median at 44.04%, and Siege Media's 2026 study found a median engagement rate of 51%, which implies a bounce rate near 49%. Judge your number against the same page type, channel and device, not one site-wide average.
Is a 70% bounce rate bad?
It depends on the page and the traffic. A 70% bounce rate on a service page or home page usually signals a problem with intent match, speed or the next step. On a blog post, or for paid social traffic, it can be normal: Siege Media's median engagement rate for paid social was only 20.2%, which implies roughly 80% bounce.
How is bounce rate calculated in GA4?
GA4 bounce rate is the percentage of sessions that were not engaged. Google counts a session as engaged if it lasts longer than 10 seconds, includes a key event, or has two or more page or screen views. Bounce rate is therefore 100% minus engagement rate for the same set of sessions.
Why is my GA4 bounce rate lower than in Universal Analytics?
Universal Analytics counted any single-page session as a bounce, even if the visitor read for several minutes. GA4 only counts sessions that fail all three engagement tests, so a long single-page visit is engaged. Content-heavy sites can see a much lower bounce rate in GA4 for the same traffic, which is why old UA benchmarks do not apply.
What is a good engagement rate in GA4?
Siege Media's analysis of 546 GA4 properties found a median engagement rate of 51% and describes 50% or higher as good and above 55% as strong. Databox's September 2024 benchmark reported a 56.21% median across 15 industries. Organic search and paid search traffic typically engage far better than paid social or display.
Does bounce rate affect Google rankings?
Google representatives have repeatedly said Google Analytics data, including bounce rate, is not used as a ranking factor; Gary Illyes said so in 2015 and John Mueller in 2022. A high bounce rate is still worth investigating because it often points to a mismatch between what searchers want and what the page delivers.
Why do bounce rate benchmarks differ between sources?
Sources use different definitions, samples, time periods and statistics. Some report GA4 non-engaged sessions while older reports count single-page visits; some use medians and others averages; some disclose sample size and some do not. Check all four before comparing your number with a published benchmark, and prefer recent GA4-based medians.
More Analytics & Attribution guides
- GA4 Setup in 2026: What Most Get Wrong
- Conversion Rate Benchmarks by Industry: 40+ Verified Data Points for 2026
- Marketing Analytics Tools: A Practical Guide to Attribution and ROI
- SEO Metrics That Matter: The KPIs to Track (and the Vanity Ones to Ignore)
- Call Tracking and Marketing Attribution for HVAC Companies: Know Which Ads Book Jobs
- How to Measure Marketing Effectiveness
- All Analytics & Attribution guides →