

KPI coaching starts with your own practice. A solo business coach needs about ten marketing numbers, reviewed every Friday: sessions by channel, opt-in rate, new subscribers, email click rate, unsubscribe rate, discovery calls booked, show rate, close rate, revenue booked and cost per client. Each one has a fixed formula and a specific report in GA4, Calendly, Kit, Kajabi or Stripe where you pull it.
Below you get the formula and the exact menu path for each KPI, the few benchmarks that have a dated public source (most coaching metrics have none), a copy-ready weekly scorecard, a worked month for a fictional coach, and a table of what to fix when a number drops. The last section covers the other meaning of the phrase: coaching your clients on their own KPIs.
The marketing KPIs a business coach should track, with formulas and where to find them
Track the funnel in order: attention, leads, conversations, clients, money. If you only watch traffic and revenue, you cannot tell which stage broke when a month goes quiet.
| KPI | Formula | Where to pull it | Cadence |
|---|---|---|---|
| Sessions by channel | Count of sessions, split by channel | GA4: Reports > Acquisition > Traffic acquisition, default dimension “Session default channel grouping” | Weekly |
| Session key event rate | Sessions with a key event ÷ total sessions | GA4: same report, “Session key event rate” column (after you mark your opt-in or booking event as a key event) | Weekly |
| Opt-in rate (per page) | New subscribers from a page ÷ sessions that landed on that page | Sessions: GA4 Reports > Engagement > Landing page. Signups: Kit “Landing Page & Form Signups” graph, or Kajabi “Opt-ins” | Weekly |
| Net new subscribers | New subscribers minus unsubscribes in the period | Kit: Subscribers, then the “New” chart (net growth, including canceled subscribers) | Weekly |
| Email click rate | Recipients who clicked at least one link ÷ recipients | Kit: Send > Broadcasts, click the subject line, read “Click rate” | Per send |
| Unsubscribe rate | Unsubscribes ÷ recipients | Kit broadcast report, “Unsub. rate” | Per send |
| Discovery calls booked | Count of calls created for your discovery event type | Calendly: Profile dropdown > Analytics, filter by Event type, read “Created events” | Weekly |
| Lead-to-call rate | Calls booked by subscribers ÷ new subscribers in the same period | Calendly count ÷ Kit count. Tag the source of each call in your sheet | Monthly |
| Show rate | Calls held ÷ calls booked (exclude calls the prospect rescheduled) | Calendly: mark each no-show from Calendar > meeting Details > “Mark no-show”; no-show status is in the Meetings CSV export | Weekly |
| Close rate | New clients ÷ calls held | Your CRM or a sheet. No scheduling tool knows who bought | Rolling 90 days |
| Revenue booked and revenue per call held | Contract value signed; contract value ÷ calls held | Kajabi: Analytics > Reports, “Gross Revenue” and “Refunds”. Retainers on Stripe subscriptions: Billing overview, “Revenue” page | Weekly |
| Cost per client (CAC) | (Ad spend + tools + paid help) ÷ new clients | Ad platform billing plus your bookkeeping | Monthly |
Three setup details decide whether these numbers are real.
- Mark your conversions in GA4. Go to Admin > Data display > Events and click the star icon next to your opt-in or booking event. A standard property allows up to 30 key events, and marking is not retroactive, per Google’s Mark events as key events help page. Standard reports can take up to 24 hours to show the change.
- Mark no-shows in Calendly the same day. Calendly’s analytics count created, completed, rescheduled and canceled events, but its analytics help page does not list no-shows. The “Mark no-show” option only appears after the meeting’s start time, and it works on all plans, per Calendly’s no-show help article. If you skip it, your show rate is fiction. Analytics also needs an Owner or Admin role on a Standard plan or higher.
- Pick one revenue source of truth. Kajabi’s Gross Revenue report does not subtract refunds, and its Refunds report is separate, per Kajabi’s Analytics overview. Stripe defines MRR only from active and past-due subscriptions, excluding taxes and free plans, in its Billing analytics docs. A paid-in-full package never shows up in MRR, so do not mix the two.
Benchmarks you can cite, with dates (and the ones nobody publishes)
Public benchmarks exist for email and landing pages. They do not exist, in any dated and sourced form, for coaching show rates, close rates or cost per client. Every “average close rate for coaches” you see online has no sample behind it. For those, set your own baseline from your first eight weeks.
| Metric | Figure | Source and sample | Data period |
|---|---|---|---|
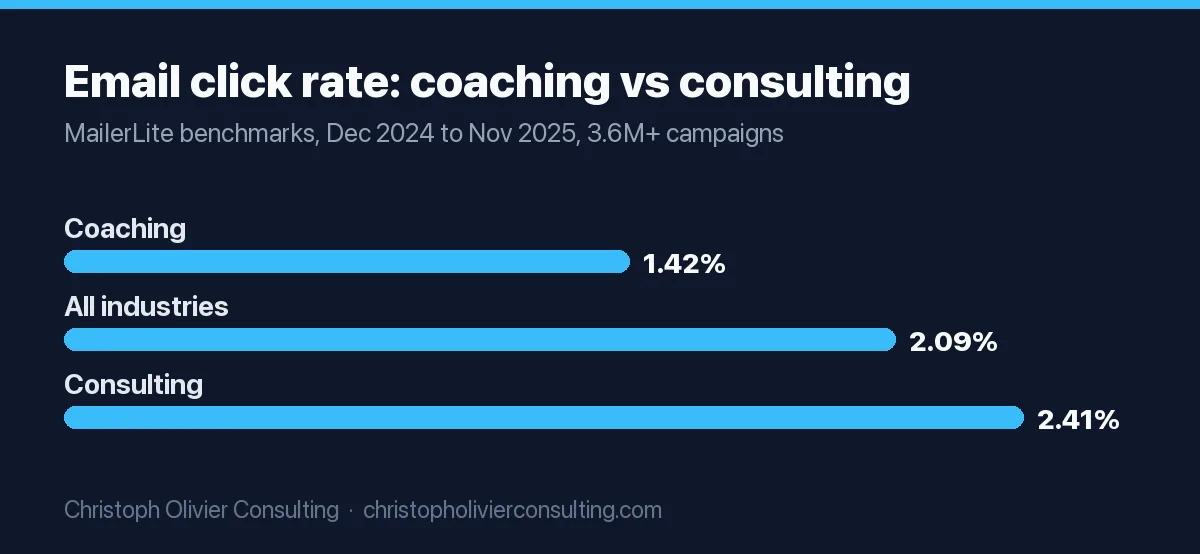
| Email click rate, Coaching | 1.42% | MailerLite, 3.6M+ campaigns from 181,000 accounts | Dec 2024 to Nov 2025 |
| Email open rate, Coaching | 48.07% | MailerLite, same sample | Dec 2024 to Nov 2025 |
| Unsubscribe rate, Coaching | 0.3% | MailerLite, same sample | Dec 2024 to Nov 2025 |
| Email click rate, Consulting | 2.41% | MailerLite, same sample | Dec 2024 to Nov 2025 |
| Email click rate, all industries | 2.09% | MailerLite, same sample | Dec 2024 to Nov 2025 |
| Email open and click rate, all users | 35.63% open, 2.62% click | Mailchimp, campaigns sent to 1,000+ subscribers | Last updated Dec 2023 |
| Email open and click rate, Education + Training | 35.64% open, 3.02% click | Mailchimp, same sample | Last updated Dec 2023 |
| Landing page conversion rate, all industries | 6.6% (median) | Unbounce Conversion Benchmark Report, 41K+ landing pages, 57M+ conversions | 2024 report |
| Show rate, close rate, CAC for coaches | No dated public source | Set your own baseline | Your first 8 weeks |
How to use these. Score click rate, not open rate. Mailchimp’s own disclaimer says open rate accuracy “may be impacted by Apple’s privacy changes and their Mail Privacy Protection (MPP) feature”, which is why a 48% coaching open rate tells you little. MailerLite’s page describes its figures as medians, so compare its numbers with the median of your sends, not your best send. Mailchimp only counted campaigns sent to at least 1,000 subscribers, so a 300-person list will swing far more than its averages. Unbounce has no coaching category, and its 6.6% covers every kind of conversion goal, so treat it as a sanity check for an opt-in page, not a target. The full set of providers and their methods sits on our email marketing benchmarks page.
Weekly KPI scorecard template for a coaching practice (copy-ready)
Copy this table into a Google Sheet or Notion page. One row per KPI, one column per week. The targets and red lines in the example column are the coach’s own targets, not industry standards: replace them after eight weeks with your own four-week averages. The click-rate target simply anchors to the MailerLite coaching median above.
| KPI | Formula | This week | Last week | 4-week avg | My target (example) | Red line: act if below for 2 weeks |
|---|---|---|---|---|---|---|
| Sessions | GA4 Traffic acquisition total | 450 | 350 | |||
| Opt-in rate, main lead magnet page | New subscribers from page ÷ landing sessions on page | 5.0% | 4.0% | |||
| Net new subscribers | Kit “New” chart | 25 | 15 | |||
| Email click rate | Kit broadcast “Click rate” | 1.4% | 1.0% | |||
| Unsubscribe rate | Kit broadcast “Unsub. rate” | 0.3% or less | Above 0.5% once | |||
| Discovery calls booked | Calendly “Created events”, discovery type | 2 | 1 | |||
| Show rate | Held ÷ booked | 80% | 70% | |||
| Close rate (rolling 90 days) | New clients ÷ held calls | 20% | 10% | |||
| Revenue booked | Signed contract value | $3,000 a week | 4-week avg under $2,000 | |||
| Revenue per call held | Revenue booked ÷ calls held (rolling 90 days) | $1,200 | $600 | |||
| Cost per client | (Ads + tools + paid help) ÷ new clients, monthly | Under 10% of package price | Above 20% | |||
| One thing I will change next week | Tied to the lowest red row | |||||
Three rules keep the scorecard honest. First, never react to one week: a coach with two calls a week moves 50 points of show rate on one cancellation. Second, close rate only means something across roughly 20 held calls, so keep it on a rolling 90-day window. That threshold is my rule of thumb, not a published standard. Third, the last row is mandatory. A scorecard without one decision is a diary.
The 80% show rate and 20% close rate targets match the planning assumptions in our marketing plan for business coaches, where the revenue worksheet turns a yearly goal into a required number of calls. Use that worksheet to set your weekly call target, then track it here.
A worked month: one solo coach’s scorecard, filled in (illustrative)
“Maya” is a fictional business coach who works with owners of landscaping companies and sells a 6-month package at $6,000. Every number below is invented to show the math. None of it is a client result or a benchmark.
| KPI | Week 1 | Week 2 | Week 3 | Week 4 | Month |
|---|---|---|---|---|---|
| Sessions | 410 | 465 | 380 | 520 | 1,775 |
| New subscribers | 22 | 27 | 15 | 31 | 95 |
| Opt-in rate (site-wide) | 5.4% | 5.8% | 3.9% | 6.0% | 5.4% |
| Email click rate (1 broadcast a week, about 1,150 recipients) | 1.1% | 1.6% | 0.9% | 1.8% | 1.35% avg |
| Unsubscribe rate | 0.2% | 0.3% | 0.5% | 0.2% | 0.3% avg |
| Calls booked (from list + referral) | 2 (2+0) | 3 (2+1) | 1 (1+0) | 3 (2+1) | 9 (7+2) |
| Calls held | 2 | 2 | 1 | 3 | 8 |
| New clients | 0 | 1 | 0 | 1 | 2 |
| Revenue booked | $0 | $6,000 | $0 | $6,000 | $12,000 |
The month-level math:
- Opt-in rate: 95 ÷ 1,775 = 5.4%.
- Lead-to-call rate: 7 list-sourced calls ÷ 95 new subscribers = 7.4%. The two referral calls are left out because they never touched the list.
- Show rate: 8 held ÷ 9 booked = 89%, above her 80% target.
- Close rate: 2 ÷ 8 = 25%. On eight calls this is two people, so she logs it and keeps the rolling 90-day figure as the real number.
- Revenue per call held: $12,000 ÷ 8 = $1,500.
- Cost per client: $600 LinkedIn ads + $180 tools = $780 ÷ 2 clients = $390, or 6.5% of the package price. Add her hours at an hourly rate if she wants the full cost.
What she does with it. Week 3 is the only red week: opt-in rate fell to 3.9% while sessions fell only 18% (465 to 380). Sessions dropping that little cannot explain a 44% fall in signups (27 to 15), so the cause sits on the page. She opens GA4’s Landing page report, sees that week’s traffic went mostly to a blog post with no form, and does nothing else, because week 4 recovered. The 0.5% unsubscribe spike lined up with a pure sales email, so she notes it and moves on. One red week, one note, no plan rewrite. Her email click rate of 1.35% sits just under the MailerLite coaching median of 1.42%, which says the list is normal and the next gain is more calls, not better emails.
If Maya kept a 25% close rate and wanted a third client a month, she would need about four more held calls a month. At her 89% show rate that is about 4.5 booked calls, and at a 7.4% lead-to-call rate that means roughly 61 more subscribers a month (4.5 ÷ 0.074). That is the kind of question the scorecard answers. Our guide to lead generation for business coaches covers where those extra leads come from.
What to fix when a KPI drops
Find the first stage that moved, fix that one, and leave the rest alone. The table reads left to right: confirm the drop in the named report, then try the first fix before anything bigger.
| When this drops | Check first (exact report) | Most common cause | First fix |
|---|---|---|---|
| Sessions | GA4 Traffic acquisition, compare channels week over week | One channel stopped: you missed posting days, a podcast episode aged out, an ad paused | Restore the missing activity before testing anything new |
| Opt-in rate, sessions steady | GA4 Landing page report, then submit your own form on a phone | Traffic landed on pages without a form, or the form broke | Add the opt-in to the top 3 landing pages; retest the form |
| Email click rate | Kit broadcast report, Clicks tab per link | No single clear call to action, or the link sits below the fold | One link, repeated twice, first one in the opening lines |
| Unsubscribe rate above 0.5% | Kit broadcast report for that send | A sales email to subscribers who joined for something unrelated | Segment by the lead magnet they joined through before pitching |
| Lead-to-call rate | Kit: Automation > Email sequences, Analytics tab, per-email click rate | The nurture never asks for a call, or asks only once | Add a call invitation to emails 3 and 6 of the sequence |
| Show rate | Calendly Meetings CSV, no-show column | Calls booked too far out, no reminder, no screening | Limit booking to 7 days ahead, add a 24-hour reminder, use an application form |
| Close rate (90-day) | Your call notes for the last 10 lost calls | Poor-fit callers, or the call ends without a clear offer and price | Tighten screening; rehearse the offer section of your call script |
| Revenue per call held | Kajabi Gross Revenue by offer, or your sales log | More buyers taking the cheap entry offer | Present the core package first, entry offer as the fallback |
| Cost per client rises | Ad billing ÷ clients by source | Paid channel producing leads that do not book | Cut spend on the channel with zero clients in 90 days |
| Renewal rate | Client list with term end dates | No renewal conversation before the last month | Book the renewal talk 4 weeks before term end |
For the show-rate and close-rate rows, the screening questions in our coaching application form and the offer section of this sales call script for business coaches are ready to use. For the renewal row, our guide to client retention for business coaches has the renewal-rate formula, a worked lifetime-value example and a renewal script. To see how each KPI maps onto the stages from first visit to referral, use the stage map in our marketing funnel for coaches.
KPI coaching for your clients: how to run a KPI session with a business owner
The other half of “KPI coaching” is helping a client pick and use their own KPIs. Most owners arrive with either no numbers or 40 of them. Your job is to get them to one scorecard they will actually review. A five-step session that works in 60 to 90 minutes:
- Name one lag number. The outcome the engagement exists to move, stated with a unit and a date: “monthly recurring revenue from maintenance contracts, from $38,000 to $45,000 by June 30.”
- Pick three lead numbers they control this week. Activities that come before the lag number, such as proposals sent, estimates followed up within 48 hours, or crew utilization. If they cannot change it in a week, it is not a lead number.
- Write the formula, the source and the owner for each. Same three columns as the table at the top of this page. “Proposals sent: count from the CRM’s Deals stage, owned by the office manager.” No owner means no number by Friday.
- Take a four-week baseline before setting targets. Targets set before a baseline are guesses, and clients feel judged when they miss a guess.
- Review weekly in 15 minutes, red rows only. Green rows get no discussion. Each red row gets one action and a name, carried into the next session.
A sample client row, for an owner of a 12-person landscaping company (illustrative): lag number, signed maintenance contracts per month; lead numbers, site visits booked, proposals sent within 48 hours of the visit, follow-up calls made on open proposals. Formula for the second: proposals sent within 48 hours ÷ site visits completed. Source: the CRM’s deal stage dates. Owner: the operations manager.
Two cautions. Record the client’s baseline at kickoff and re-score at each milestone, so any improvement you later describe is measured, not remembered. And if you publish a client’s KPI gains in your own marketing, the FTC’s Endorsement Guides say that when you cannot show an endorser’s results are what people generally achieve, the ad must make clear what the generally expected results are. Check that before you post a before-and-after number.
I would rather a coach track five numbers every Friday for a year than twenty numbers for a month. If you want a second set of eyes on your scorecard targets before you commit a quarter to them, you can book a consultation.
Frequently asked questions
What is KPI coaching?
KPI coaching has two meanings. For a coach, it means tracking the numbers that run your own practice: opt-in rate, discovery calls booked, show rate, close rate, revenue booked and cost per client. It also means coaching a client to choose one outcome number, three weekly activity numbers they control, and a 15-minute weekly review of whatever is off target.
What KPIs should a business coach track?
Start with about ten, reviewed weekly: sessions by channel, opt-in rate, net new subscribers, email click rate, unsubscribe rate, discovery calls booked, show rate, close rate on a rolling 90 days, revenue booked, and cost per client. Each has a fixed formula and a report in GA4, Calendly, Kit, Kajabi or Stripe where you can pull it in a few minutes.
What is a good email click rate for coaches?
MailerLite's benchmarks for December 2024 to November 2025, across more than 3.6 million campaigns, put the Coaching category at a 1.42% click rate, against 2.09% for all industries and 2.41% for Consulting. Its Coaching open rate was 48.07%, but Apple Mail Privacy Protection inflates opens, so judge your list on clicks.
What is a good discovery call close rate for a coach?
No dated, sourced public benchmark exists for coaching close rates. Set your own baseline: divide new clients by calls held across your last 20 or so calls, on a rolling 90-day window. Many coaching plans, including ours, use 20% as a planning assumption, but treat it as a target you test, not an industry average.
How do I track discovery call no-shows in Calendly?
Open the Calendar page, find the meeting, open its Details and select Mark no-show. The option appears only after the meeting's start time and works on every plan. Calendly's analytics count created, completed, rescheduled and canceled events, and no-show status comes through in the Meetings CSV export, which is where you calculate show rate.
How do you coach a client on their KPIs?
Have the client name one outcome number with a unit and a date, then three activity numbers they can change within a week. Write a formula, data source and owner for each, take a four-week baseline before setting targets, and review weekly in 15 minutes, discussing only the red rows, with one named action for each.
More marketing guides for business coaches
- CRM and Client Follow-Up for Business Coaches and Consultants
- How Business Coaches and Consultants Get More Reviews and Use Testimonials the Right Way
- How to Build a Business Coaching Website That Converts Visitors Into Booked Calls
- Lead Magnet Ideas for Business Coaches and Consultants
- How a Business Coach or Consultant Builds a Personal Brand That Attracts Clients
- When Should a Business Coach or Consultant Hire Marketing Help?