

There are 17,263 SEC-registered investment advisers (RIAs) in the US, according to our count of the SEC’s November 2026 adviser roster (Form ADV filings through November 1, 2026). Together they report $177.9 trillion in regulatory assets under management, and the median firm manages $414.7 million. Add the 15,799 advisers registered only with state regulators, per the IAA and Comply Investment Adviser Industry Snapshot 2026, and the US has roughly 33,000 registered investment adviser firms.
Compared with the SEC’s December 2025 roster, the SEC-registered count is up 779 firms (4.7%) and reported assets are up 22.9%. The typical wealth management RIA grew its assets 15.9% in its latest fiscal year, while its client count grew only 3.9%. Every number below comes from the SEC’s own filings or a primary report we linked, and the methodology is at the end so you can check the math.
RIA industry statistics at a glance (November 2026)
| Statistic | Value | Source |
|---|---|---|
| SEC-registered RIAs | 17,263 (16,983 approved, 280 in the 120-day approval window) | SEC roster, Nov 2026, our count |
| State-registered RIAs | 15,799 | IAA/Comply Snapshot 2026 (2025 data) |
| Total regulatory AUM, SEC RIAs | $177.9 trillion | SEC roster, Item 5F(2)(c) |
| Median RAUM per firm | $414.7 million ($447.2 million excluding 679 firms reporting zero) | SEC roster |
| Share of RAUM managed with discretion | 92.9% | SEC roster, Item 5F(2)(a) vs (c) |
| Client accounts | 81.6 million (median firm: 215) | SEC roster, Item 5F(2)(f) |
| Employees | 1,101,960 (median firm: 8; median advisory staff: 5) | SEC roster, Items 5A and 5B(1) |
| Wealth management RIAs (half or more of RAUM from individuals) | 9,242 firms, 53.5% of SEC RIAs | SEC roster, Item 5D, our definition |
| RAUM from individual and high net worth clients | $27.7 trillion (15.6% of RAUM) | SEC roster, Item 5D |
| Year-over-year change in firms | +779 (+4.7%) since Dec 2025 | SEC rosters, Dec 2025 vs Nov 2026 |
| Median same-firm AUM growth, wealth RIAs | 15.9% (latest fiscal year) | 8,308 firms on both rosters |
| RIAs per million US residents | 43.5 (Connecticut highest at 136.1) | SEC roster and Census Vintage 2025 |
How many RIAs are there in the US?
The answer depends on which tier you count and on what date. The SEC registration threshold is $100 million in assets; most smaller firms register with their state securities regulator instead. Exempt reporting advisers, mostly venture and smaller private fund managers, file parts of Form ADV but are not registered.
| Adviser population | Firms | As of | Source |
|---|---|---|---|
| SEC-registered advisers, live roster | 17,263 | Filings through Nov 1, 2026 | SEC Form ADV data file |
| SEC-registered advisers, annual industry count | 16,544 | Year-end 2025 (filings as of Apr 6, 2026) | IAA/Comply Snapshot 2026 |
| State-registered advisers | 15,799 | Year-end 2025 | IAA/Comply Snapshot 2026 |
| State-registered advisers, home-state count | 16,575 | Dec 31, 2024 | NASAA 2025 IA Section Report |
| SEC exempt reporting advisers (not RIAs) | 6,436 | Year-end 2025 | IAA/Comply Snapshot 2026 |
The live roster runs about 700 firms above IAA’s count for two reasons: it is seven months later, and IAA’s tabulation excludes advisers on older Form ADV versions and filings that look like obvious errors. Use the IAA series for year-over-year trend lines and the SEC roster when you need “how many right now.”
Churn is heavy underneath the net number. Between the December 2025 and November 2026 rosters, 1,584 firms appeared that were not on the earlier list and 805 dropped off, for the net gain of 779. The new arrivals are small: their median RAUM is $117.3 million, 95.5% manage under $1 billion and 51% are wealth management firms by our definition.
SEC-registered RIAs by year, 2019 to 2025
| Year | SEC-registered advisers | Change | RAUM | Clients | Employees |
|---|---|---|---|---|---|
| 2019 | 13,494 | +3.9% | $97.2T | 51.9M | 871,971 |
| 2020 | 13,880 | +2.9% | $110.0T | 60.8M | 879,755 |
| 2021 | 14,806 | +6.7% | $128.4T | 63.3M | 928,505 |
| 2022 | 15,114 | +2.1% | $114.1T | 62.0M | 971,487 |
| 2023 | 15,396 | +1.9% | $128.4T | 64.1M | 1,006,471 |
| 2024 | 15,870 | +3.1% | $144.6T | 68.4M | 1,032,455 |
| 2025 | 16,544 | +4.2% | $176.8T | 73.7M | 1,110,304 |
Sources: IAA and Comply Snapshots 2026 (2021 to 2025, and Table 1A firm counts back to 2017), 2025 (2020) and 2024 (2019). Percent changes calculated from Table 1A.
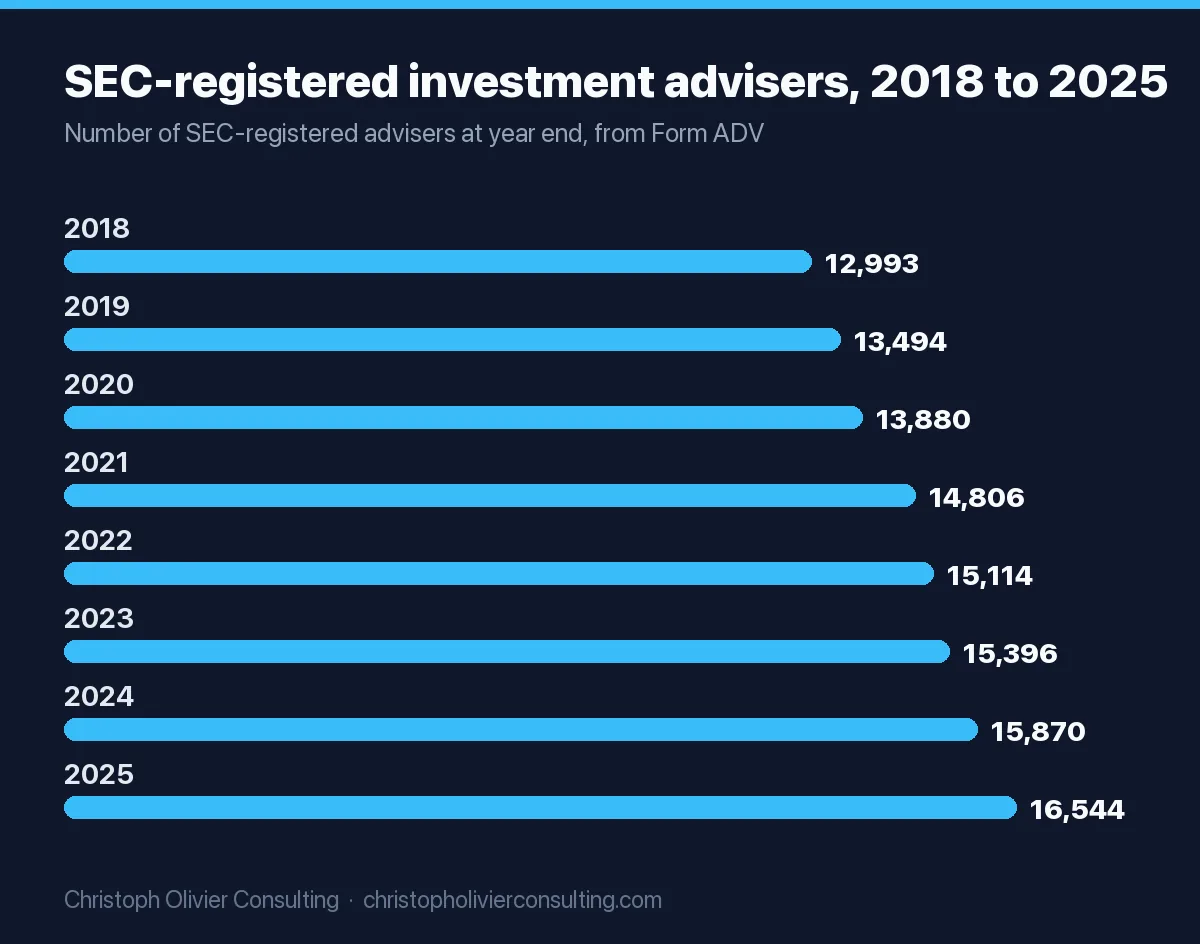
2025 was the 13th straight year of growth in the firm count. Note 2022: assets fell 11.1% while the number of firms still rose 2.1%. Firm formation follows advisor careers; assets follow markets.
How many wealth management firms are in the US?
Form ADV has no “wealth manager” checkbox, so we defined one from Item 5D: a firm where individuals and high net worth individuals account for at least half of its regulatory assets. On the November 2026 roster, 9,242 SEC-registered RIAs (53.5%) meet that test, up from 8,724 in December 2025. They manage $27.8 trillion, their median firm manages $296.8 million with 6 employees and 244 individual clients, and 79.3% offer financial planning. The 15,799 state-registered firms sit on top of that: they are mostly small practices, and Snapshot 2026 reports that two-thirds of them offer financial planning.
RIA market size: $177.9 trillion, or $27.7 trillion for wealth management
“RIA market size” means two very different things. The headline figure covers every SEC-registered adviser, including Vanguard, Fidelity, BlackRock and every hedge fund manager. The wealth management slice is a fraction of it.
| Measure | Value | What it includes |
|---|---|---|
| Total RAUM, all SEC RIAs (Nov 2026 roster) | $177.9 trillion | Mutual fund, ETF, institutional, private fund and wealth managers. Sub-advised assets are counted by more than one adviser |
| RAUM of the 10 largest advisers | $48.5 trillion (27.3%) | Vanguard Group alone reports $11.1 trillion |
| RAUM of the largest 1% of advisers (172 firms) | 66.0% of the total | Mostly fund and institutional managers |
| RAUM from individuals and high net worth clients | $27.7 trillion | Item 5D(a) $9.0T plus 5D(b) $18.7T, across all SEC RIAs |
| RAUM of wealth management RIAs (our definition) | $27.8 trillion | All client types at the 9,242 individual-focused firms |
| State-registered adviser assets (2025) | $411.9 billion | IAA/Comply Snapshot 2026 |
| All US professionally managed assets (end 2024) | $73.7 trillion ($36.6T retail, $37.1T institutional) | Cerulli, via InvestmentNews, net of double counting |
The $177.9 trillion is larger than all US professionally managed assets because a fund’s adviser and its sub-adviser both report the same dollars, and global managers report non-US assets. The IAA Snapshot itself warns that the industry total “is significantly larger than underlying client assets.” For sizing a market you can sell into, such as a fund manager selling into RIAs and family offices, use the $27.7 trillion individual figure and the firm counts by size band below.
The roster also shows how RIAs run money: 92.9% of all RAUM is discretionary, 96.6% of firms reporting assets manage at least some accounts with discretion and 60.6% manage everything with discretion.
RIA industry statistics by firm size
The industry is a long tail of small businesses under a handful of giants. On the November 2026 roster, 11,873 firms (68.8%) manage less than $1 billion, yet together they hold 2.1% of RAUM. The 261 firms above $100 billion hold 72.4%.
| RAUM band | Firms | Share of firms | Combined RAUM | Share of RAUM | Of which wealth RIAs |
|---|---|---|---|---|---|
| Under $100 million | 1,812 | 10.5% | $48.9B | 0.03% | 664 |
| $100M to $250M | 4,351 | 25.2% | $727.1B | 0.4% | 3,358 |
| $250M to $500M | 3,270 | 18.9% | $1.16T | 0.7% | 2,152 |
| $500M to $1B | 2,440 | 14.1% | $1.73T | 1.0% | 1,385 |
| $1B to $5B | 3,287 | 19.0% | $7.27T | 4.1% | 1,283 |
| $5B to $100B | 1,842 | 10.7% | $38.18T | 21.5% | 400 |
| Over $100B | 261 | 1.5% | $128.74T | 72.4% |
Source: SEC roster, November 2026, our tabulation of Item 5F(2)(c). Firms under $100 million (679 of them report zero RAUM) are registered on other Item 2A grounds, such as mid-sized advisers, advisers to registered funds, internet and multi-state advisers, non-US advisers and new firms expecting to become eligible.
By headcount: 6,790 SEC RIAs have 5 or fewer employees, 3,666 have 6 to 10, 4,798 have 11 to 50, 815 have 51 to 100, 918 have 101 to 500 and 275 have more than 500. Another 1,431 firms list their main office as a private residence, so the SEC withholds the address. Their median RAUM is $160 million.
Average RIA AUM vs median: which to quote
| SEC RIAs, Nov 2026 roster | 25th percentile | Median | 75th percentile | 90th percentile | Average |
|---|---|---|---|---|---|
| Regulatory AUM | $174.1M | $414.7M | $1.47B | $6.83B | $10.3B |
The “average RIA AUM” of $10.3 billion describes almost no real firm: only about one RIA in ten is that large. Quote the median. For wealth management RIAs alone the median is $296.8 million. IAA’s year-end 2025 figure, built on its own filters, is $446.9 million (Snapshot 2026, Table 1C), which matches our $447.2 million median for firms reporting assets.
Who RIAs serve: client-type mix
Item 5D asks every adviser how many clients of each type it has and how much RAUM each type represents. Here is the November 2026 roster.
| Client type (Item 5D) | Share of SEC RIAs serving it | Share of total RAUM | RAUM |
|---|---|---|---|
| High net worth individuals | 60.9% | 10.5% | $18.7T |
| Individuals (non-HNW) | 56.9% | 5.0% | $9.0T |
| Pooled investment vehicles (private funds and similar) | 37.4% | 26.7% | $47.5T |
| Corporations and other businesses | 35.0% | 2.0% | $3.6T |
| Charitable organizations | 33.5% | 1.2% | $2.1T |
| Pension and profit-sharing plans | 31.7% | 4.8% | $8.5T |
| Registered investment companies (mutual funds, ETFs) | 9.7% | 38.3% | $68.0T |
| Insurance companies | 7.7% | 4.8% | $8.6T |
| State and municipal entities | 8.7% | 2.5% | $4.4T |
Put together: 63.4% of SEC RIAs serve individuals or high net worth clients, 14.2% serve only individuals, and 33.7% serve only institutions or funds. The 51.2 million non-HNW individual clients outnumber the 9.9 million HNW clients five to one, but the HNW group holds twice the assets.
Fees follow the client mix. Among wealth management RIAs, 97.8% charge a percentage of assets, 65.7% charge fixed fees, 48.4% charge hourly and 8.2% charge performance fees. Across all SEC RIAs, performance fees appear at 35.7%, driven by private fund managers.
Where RIAs are located: firms by state and per capita
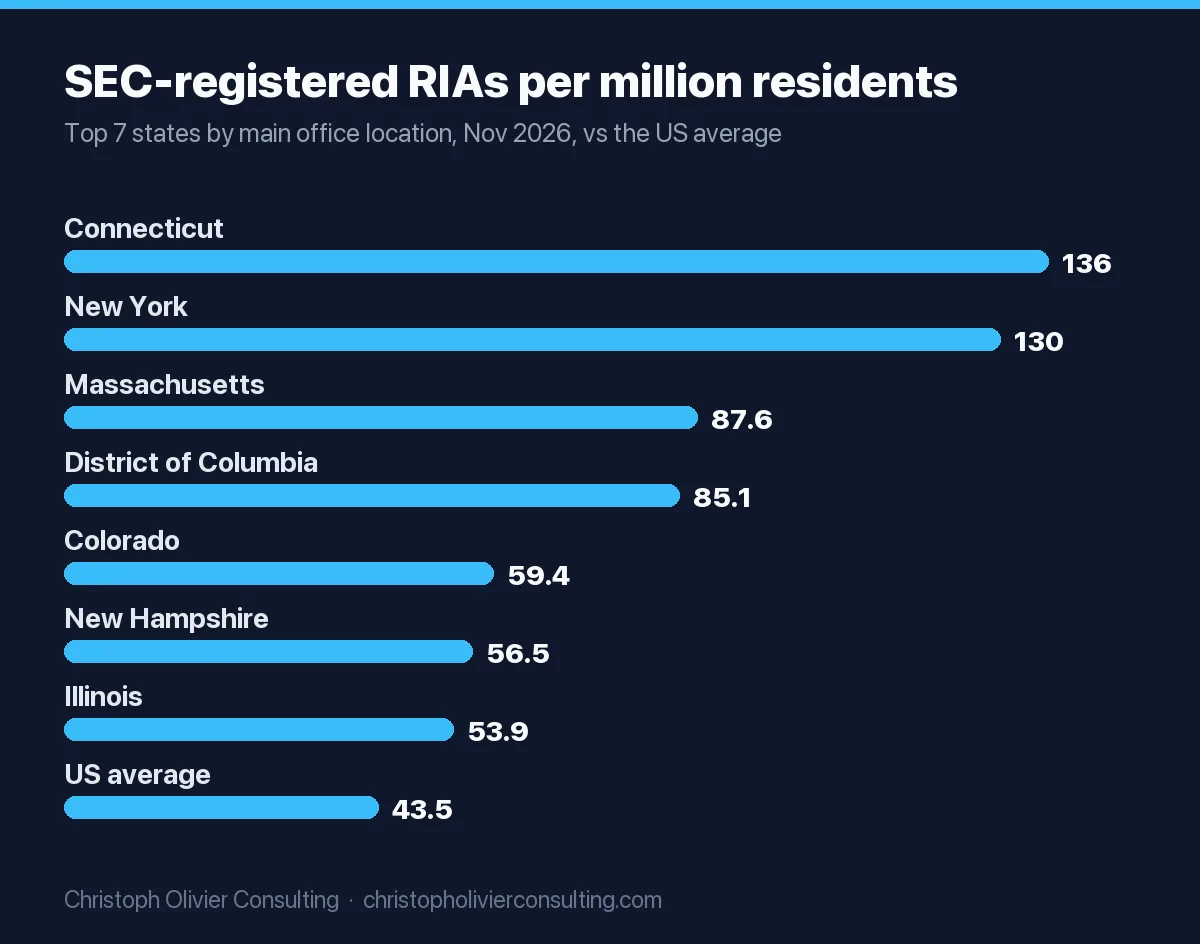
New York has the most SEC-registered RIAs, but Connecticut has the most per resident. The table uses each firm’s main office state on the November 2026 roster and Census Bureau Vintage 2025 population estimates.
| Rank | State | SEC RIAs | RAUM | Wealth RIAs | RIAs per million residents |
|---|---|---|---|---|---|
| 1 | New York | 2,590 | $37.7T | 717 | 129.5 |
| 2 | California | 1,883 | $23.8T | 1,014 | 47.8 |
| 3 | Florida | 1,099 | $4.3T | 558 | 46.8 |
| 4 | Texas | 1,084 | $4.5T | 571 | 34.2 |
| 5 | Illinois | 686 | $7.8T | 335 | 53.9 |
| 6 | Massachusetts | 627 | $19.3T | 289 | 87.6 |
| 7 | Pennsylvania | 568 | $27.2T | 367 | 43.5 |
| 8 | Connecticut | 502 | $3.3T | 147 | 136.1 |
| 9 | Ohio | 404 | $1.1T | 311 | 33.9 |
| 10 | New Jersey | 390 | $6.1T | 234 | 40.8 |
| 11 | Colorado | 357 | $1.3T | 230 | 59.4 |
| 12 | Georgia | 331 | $1.5T | 227 | 29.3 |
| 13 | Michigan | 303 | $0.6T | 242 | 29.9 |
| 14 | Virginia | 300 | $0.6T | 204 | 33.8 |
| 15 | North Carolina | 288 | $3.0T | 203 | 25.7 |
Excludes 1,431 firms whose main office is a private residence (address withheld) and 901 firms headquartered outside the US, led by the United Kingdom (275) and Canada (152). Pennsylvania’s RAUM is mostly Vanguard’s Malvern-based advisers.
Nationally there are 43.5 SEC-registered RIAs per million residents (14,879 firms in the 50 states and DC). Per capita, the leaders are Connecticut (136.1), New York (129.5), Massachusetts (87.6), the District of Columbia (85.1), Colorado (59.4), New Hampshire (56.5) and Illinois (53.9). Count only wealth management RIAs and the order changes: New Hampshire (46.6 per million), Vermont (46.5), Massachusetts (40.4), Connecticut (39.9) and Colorado (38.3) lead, against a national rate of 23.9. Hedge fund and institutional managers inflate New York and Connecticut on the all-firm count.
How is the RIA industry growing? Year-over-year change
We compared the November 2026 roster with the closest file a year earlier. The SEC’s archive lists no October or November 2025 file, so the comparison uses December 2025 (filings through December 1, 2025), 11 months earlier, plus November 2024 for a two-year view.
| SEC roster | Nov 2024 | Dec 2025 | Nov 2026 | Change, Dec 2025 to Nov 2026 |
|---|---|---|---|---|
| SEC-registered RIAs | 15,974 | 16,484 | 17,263 | +779 (+4.7%) |
| Total RAUM | $128.7T | $144.7T | $177.9T | +22.9% |
| Median RAUM per firm | $379.1M | $397.2M | $414.7M | +4.4% |
| Employees | 1,006,897 | 1,031,436 | 1,101,960 | +6.8% |
| Client accounts | 71.9M | 75.1M | 81.6M | +8.6% |
| Clients (Item 5D) | 56.4M | 61.2M | 64.8M | +5.8% |
| Wealth management RIAs | 8,316 | 8,724 | 9,242 | +5.9% |
| RAUM from individual and HNW clients | $20.0T | $23.1T | $27.7T | +20.1% |
Source: SEC Form ADV data files for November 2024, December 2025 and November 2026, our tabulation. Over 95% of advisers have a December fiscal year end (Snapshot 2026), so the December 2025 roster mostly carries fiscal 2024 assets and the November 2026 roster mostly carries fiscal 2025 assets.
Two-year view: from November 2024 to November 2026 the roster grew by 1,289 firms (8.1%) and RAUM by 38.2%. The median firm’s RAUM rose only 4.4% in the latest year, far less than existing firms grew, because roughly 1,400 to 1,600 small new registrants a year pull the median down.
Over longer periods, IAA’s Snapshot 2026 puts the compound growth in the number of SEC advisers at 3.4% a year over 10 years and 3.7% over 25 years, and RAUM growth at 10.2% and 9.1% a year over the same periods, against US large stock returns of 14.8% and 8.8%.
What’s the typical AUM growth rate for independent RIAs?
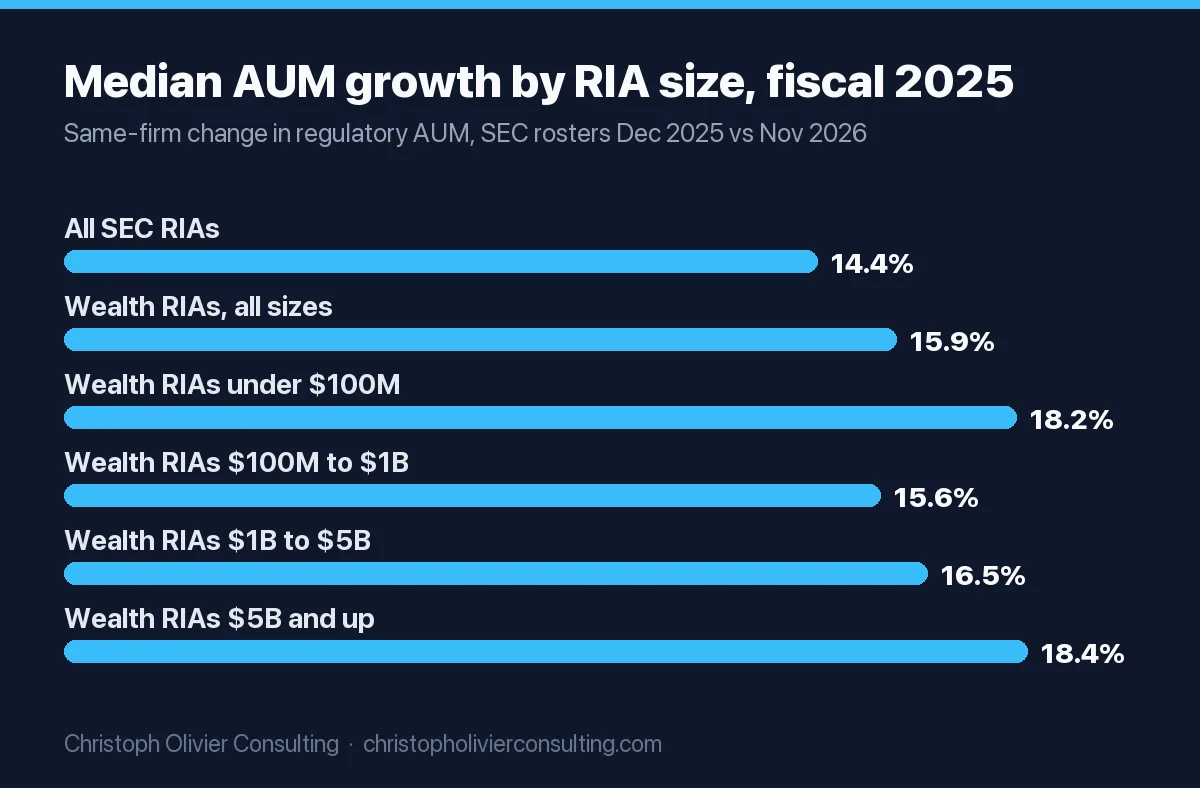
For fiscal 2025, the median wealth management RIA grew assets 15.9%. That is our same-firm measure: we matched 8,308 individual-focused firms present on both the December 2025 and November 2026 rosters and compared each firm’s own RAUM. Total growth includes market gains, new clients and acquisitions; US large stocks returned 17.9% in 2025, per the Snapshot.
| Firm group (size at start) | Firms | Median AUM growth | Middle half of firms | Share that grew | Median client growth |
|---|---|---|---|---|---|
| All SEC RIAs | 15,114 | 14.4% | 4.7% to 25.3% | 82.3% | 3.5% |
| Wealth management RIAs | 8,308 | 15.9% | 9.2% to 24.2% | 91.6% | 3.9% |
| Wealth RIAs under $100M | 594 | 18.2% | 5.5% to 38.7% | 82.3% | 2.3% |
| Wealth RIAs $100M to $1B | 6,311 | 15.6% | 9.3% to 23.5% | 92.3% | 3.6% |
| Wealth RIAs $1B to $5B | 1,075 | 16.5% | 10.2% to 22.7% | 91.9% | 4.8% |
| Wealth RIAs $5B and up | 328 | 18.4% | 10.6% to 29.5% | 94.5% | 7.2% |
Source: SEC rosters, December 2025 and November 2026; same firms (matched on CRD number), RAUM above zero in both files. Client growth counts individual plus HNW clients from Item 5D. “Independent” is not a Form ADV field; wealth RIAs are firms with at least half of RAUM from individuals.
The prior year looks similar. Matching the November 2024 and December 2025 rosters (mostly fiscal 2023 to fiscal 2024), the median wealth RIA grew AUM 14.8% and clients 3.7%. So a fair benchmark for an independent RIA is mid-teens total AUM growth in a strong market year, with client counts growing 3% to 5%. Larger firms grow clients faster, which is consistent with acquisitions: the median $5 billion-plus wealth RIA added 7.2% more clients and 4.7% more employees, while the median wealth RIA under $1 billion added no staff.
Independent studies land in the same place. Paithos Research, using Form ADV for more than 14,000 firms, found median RAUM growth of 14.5% and median client growth of 2.1% in fiscal 2025. Schwab’s 2026 RIA Benchmarking Study (1,236 Schwab-custodied firms, self-reported), as summarized by Kitces, found AUM up 17%, revenue up 13.2%, clients up 4.7% with 97% retention, and net organic growth of 7.2% for firms under $250 million and 4.8% for firms above.
What is the average organic growth rate of an independent RIA?
Organic growth strips out markets and acquisitions, and it runs about 10 points below total growth. Schwab’s 2025 figures are 4.8% (firms over $250 million) and 7.2% (under $250 million); its top 20% of firms reached 12.9% net organic growth and 25.4% total AUM growth. Cerulli found RIAs over $1 billion grew 11.4% a year from 2019 to 2024, but 3.9% a year without market gains.
Schwab also found that firms with a written marketing plan, an ideal client persona and a clear client value proposition gained 87% more new clients and 127% more new client assets than other firms. That is the gap a documented financial advisor marketing plan is meant to close. Paithos saw a related pattern in filings: firms growing clients 10% or more were about twice as likely to use testimonials in advertising (15.2% vs 7.4%), which is worth reading alongside how to use client testimonials compliantly.
Worked example: separate your organic growth from market growth
Use this to compare your firm with the benchmarks above. The inputs are hypothetical; swap in your own.
- Beginning AUM, January 1: $400 million.
- New assets from new clients: $22 million. Additional deposits from existing clients: $8 million. Total inflows: $30 million.
- Outflows (withdrawals and lost clients): $11 million.
- Net new assets: $30M minus $11M = $19 million.
- Net organic growth: $19M divided by $400M = 4.75%, almost exactly Schwab’s 4.8% for firms above $250 million.
- Ending AUM: $468 million, or 17% total growth. Market appreciation therefore contributed $468M minus $400M minus $19M = $49 million, or 12.25 points of the 17%.
If your total growth sits near the 15.9% median but organic growth is under 4%, the market did your growing. Track the components monthly; the guide to marketing KPIs for financial advisors covers how to attribute new assets to their source.
RIA M&A statistics: 2025 record and 2026 so far
| Metric | 2024 | 2025 | 2026 (through Sept 30) |
|---|---|---|---|
| Announced deals (DeVoe) | 272 | 322 (record) | 244 (Q2: 74, Q3: 77) |
| Deals (Fidelity) | 233 | 276 (record) | n/a |
| Acquired assets (Fidelity) | $669 billion | $796 billion | n/a |
| Buyers (Fidelity) | 82 | 102 | n/a |
| Private equity backed share of deals (Fidelity) | n/a | 88% | n/a |
| Median seller AUM | n/a | $508 million (Fidelity) | $625 million (DeVoe) |
Sources: DeVoe 2025 RIA Deal Book via InvestmentNews; DeVoe Q3 2026 via InvestmentNews and Wealth Solutions Report; Fidelity via InvestmentNews. The two trackers use different inclusion rules, so do not average them.
Q3 2026 deal volume fell 17% from 93 a year earlier, and DeVoe now expects 320 to 340 deals for 2026; 78 more would match 2025’s record. Sellers above $5 billion completed 41 deals through September, consolidators accounted for 53% of deals, and small sellers ($100 million to $500 million) held a 36% share, on track for their lowest on record. Wealth Enhancement led 2025 acquirers with 17 deals, followed by Merit Financial Advisors with 13 and Beacon Pointe with 12.
RIA industry trends and growth potential
- Consolidation will keep feeding the top. Cerulli expects the consolidator segment to pass $4 trillion over the next decade, with $3.9 trillion of acquirable AUM across more than 66,000 advisors and more than 26,000 expected advisor exits. 54% of RIAs say they are seeking an acquisition. The succession gap is the main supply source.
- Big firms are taking share. RIAs with $5 billion or more went from 34% of the RIA market in 2018 to 54% in 2024 (Cerulli). On the roster, the number of wealth RIAs above $1 billion is now 1,683.
- The firm count keeps rising anyway. The last two roster comparisons show 1,420 and 1,584 new SEC registrants against 910 and 805 exits, and about 95% of the newcomers manage under $1 billion.
- Assets are outrunning clients. Wealth RIAs grew AUM 15.9% but clients 3.9% in fiscal 2025. Paithos found assets per advisory employee rose to $108.5 million from $98.6 million.
- Lighter rules for small firms may be coming. In January 2026 the SEC proposed raising the “small entity” adviser threshold from $25 million to $1 billion of assets. On the November 2026 roster, 11,873 firms manage less than $1 billion.
My read: the industry’s growth potential is real, but firm-level growth is going to whoever builds a repeatable new-client engine rather than riding the market. If you are mapping where your next clients come from, start with financial advisor lead generation, or book a consultation to pressure-test your plan against these benchmarks.
Where can RIAs find reliable benchmarking data?
| Source | Best for | Coverage | Cadence |
|---|---|---|---|
| SEC Form ADV data files | Current counts, your own cuts by state, size or client type | Every SEC-registered and exempt reporting adviser | Monthly, free CSV |
| IAA/Comply Investment Adviser Industry Snapshot | Annual industry totals, trends since 2000 | SEC-registered advisers | Annual, free PDF (2026 edition covers 2025) |
| NASAA IA Section Report | State-registered advisers by state | State-registered firms | Annual |
| Schwab RIA Benchmarking Study | Organic growth, revenue, staffing | 1,236 Schwab-custodied firms (2026) | Annual, self-reported |
| Paithos Research RIA Signals Report | Firm-level growth from filings | 14,000+ SEC-registered firms | Periodic |
| DeVoe RIA Deal Book and Fidelity M&A report | Deal counts, buyers, seller size | Announced RIA transactions | Quarterly (DeVoe), annual (Fidelity) |
For marketing-side comparisons, our financial advisor marketing statistics collect channel and conversion benchmarks.
Methodology and how to cite this data
We downloaded the SEC’s “Information About Registered Investment Advisers” files for November 2026 (17,263 firms, filings through November 1, 2026), December 2025 (16,484), September 2025 and November 2024 (15,974) and tabulated them directly. Key fields: Item 5F(2)(a) to (f) for discretionary, non-discretionary and total RAUM and accounts; Item 5A for employees and 5B(1) for advisory staff; Item 5D for client counts and RAUM by client type (a firm “serves” a type if it reports clients, ticks “fewer than 5” or reports RAUM for it); main office state and the private residence flag. Wealth management RIAs are firms with at least 50% of Item 5D RAUM from individuals and high net worth individuals. Same-firm growth matches firms by CRD number and requires RAUM above zero in both files.
Limits: RAUM is self-reported and refreshed at each firm’s annual amendment, so roster totals mix fiscal years; sub-advised assets are double counted; firms that merged or deregistered drop out of same-firm comparisons, which tilts growth figures toward survivors; state population uses Census Vintage 2025 estimates. Our counts differ from IAA’s because IAA applies its own exclusions and an April cutoff.
Cite this data: Christoph Olivier Consulting, “RIA Industry Statistics,” tabulation of the SEC Form ADV registered adviser data files (November 2026 vs December 2025), https://christopholivierconsulting.com/ria-industry-statistics/, published November 2026.
Frequently asked questions
How many RIAs are there in the US?
The SEC's November 2026 roster lists 17,263 SEC-registered investment advisers, with filings through November 1, 2026. The IAA and Comply Snapshot 2026 counts 16,544 SEC-registered advisers and 15,799 state-registered advisers at year-end 2025, so the US has roughly 33,000 registered investment adviser firms in total. Exempt reporting advisers are not RIAs and are not included.
What is the RIA market size?
SEC-registered RIAs report $177.9 trillion in regulatory assets under management on the November 2026 roster. That total includes mutual fund, institutional and private fund managers and double counts sub-advised assets. The wealth management slice is much smaller: $27.7 trillion of RAUM comes from individual and high net worth clients, and state-registered firms add about $411.9 billion.
What's the typical AUM growth rate for independent RIAs?
In fiscal 2025 the median wealth management RIA grew assets 15.9%, based on 8,308 firms matched across the December 2025 and November 2026 SEC rosters. The middle half of firms grew between 9.2% and 24.2%. Client counts grew a median 3.9%, so most of the gain came from markets. Paithos Research found a similar 14.5% median for all SEC firms.
What is the average organic growth rate of an independent RIA?
Organic growth excludes market gains and acquisitions and is far lower than total growth. Schwab's 2026 RIA Benchmarking Study found net organic growth of 4.8% for firms above $250 million and 7.2% for smaller firms in 2025, with its top 20% of firms at 12.9%. Cerulli found RIAs over $1 billion grew 3.9% a year from 2019 to 2024 without market gains.
What is the average RIA AUM?
The average SEC-registered RIA reports $10.3 billion, but that figure is pulled up by a few giant fund managers. The median is $414.7 million on the November 2026 roster, or $447.2 million among firms reporting assets. Wealth management RIAs, where individuals provide at least half of assets, have a median of $296.8 million and 6 employees.
How fast is the RIA industry growing?
Between the December 2025 and November 2026 SEC rosters, the number of SEC-registered RIAs rose 4.7% to 17,263 and reported assets rose 22.9% to $177.9 trillion. Over two years the firm count grew 8.1%. Over 25 years, IAA data shows the adviser count compounding 3.7% a year and assets 9.1% a year.
Which state has the most RIAs?
New York has the most SEC-registered RIAs with 2,590, followed by California (1,883), Florida (1,099), Texas (1,084) and Illinois (686), based on main office state in the November 2026 SEC roster. Per resident, Connecticut leads with 136.1 RIAs per million people, against a national rate of 43.5 using Census Vintage 2025 population estimates.