

Google held 91.04% of worldwide search engine market share in October 2026, according to Statcounter Global Stats (all devices). Bing was second at 4.77%, then Yahoo! at 1.18%, Yandex at 1.17% and DuckDuckGo at 0.64%. In the United States, Google held 85.45% and Bing 9.76%. On desktop the picture is very different: Bing took 15.00% of desktop search worldwide and 18.81% of US desktop search.
Every figure on this page was pulled from Statcounter’s own CSV export on 1 November 2026, so you can check it against the source. One caution before you quote October: Statcounter says its stats are “subject to quality assurance testing and revision for 45 days from first publication” (Statcounter FAQ). October 2026 and September 2026 can still move by a few hundredths of a point.
Statcounter global search engine market share: October 2026
Here is the worldwide, all-device split for the latest month, the month before, and the same month a year earlier.
| Search engine | Oct 2026 | Sep 2026 | Oct 2025 | 12-month change |
|---|---|---|---|---|
| 91.04% | 89.94% | 90.04% | +1.00 pts | |
| Bing | 4.77% | 5.29% | 4.31% | +0.46 pts |
| Yahoo! | 1.18% | 1.36% | 1.45% | -0.27 pts |
| Yandex | 1.17% | 1.31% | 1.86% | -0.69 pts |
| DuckDuckGo | 0.64% | 0.74% | 0.89% | -0.25 pts |
| Baidu | 0.42% | 0.44% | 0.73% | -0.31 pts |
| Naver | 0.23% | 0.26% | 0.21% | +0.02 pts |
| Ecosia | 0.15% | 0.17% | 0.15% | +0.00 pts |
Source: Statcounter Global Stats, search engine market share worldwide, CSV export, October 2024 to October 2026. Licensed CC BY-SA 3.0.
Three things stand out. Google is up 1.00 point year over year, not down, despite the steady run of AI-search headlines. Bing gained 0.46 points over the same 12 months. Yandex lost 0.69 points worldwide, the largest decline of any engine in the table, which matters because the global average is partly a story about Russia.
Google’s monthly search market share, last 24 months
If you searched for “Google search market share 2026 Statcounter” you probably want one number. A single month is noisy, so here is the full 24-month run (worldwide, all devices).
| Month | Bing | Yahoo! | Yandex | DuckDuckGo | Baidu | |
|---|---|---|---|---|---|---|
| Oct 2026 | 91.04% | 4.77% | 1.18% | 1.17% | 0.64% | 0.42% |
| Sep 2026 | 89.94% | 5.29% | 1.36% | 1.31% | 0.74% | 0.44% |
| Aug 2026 | 91.02% | 4.55% | 1.24% | 1.01% | 0.70% | 0.62% |
| Jul 2026 | 91.32% | 4.46% | 1.24% | 0.99% | 0.65% | 0.50% |
| Jun 2026 | 91.25% | 4.68% | 1.28% | 0.80% | 0.67% | 0.43% |
| May 2026 | 90.46% | 4.98% | 1.39% | 0.98% | 0.70% | 0.52% |
| Apr 2026 | 90.02% | 5.14% | 1.50% | 1.19% | 0.71% | 0.46% |
| Mar 2026 | 89.85% | 5.13% | 1.48% | 1.30% | 0.75% | 0.53% |
| Feb 2026 | 90.01% | 4.98% | 1.39% | 1.34% | 0.76% | 0.55% |
| Jan 2026 | 89.87% | 4.43% | 1.36% | 1.92% | 0.74% | 0.69% |
| Dec 2025 | 90.82% | 4.03% | 1.26% | 1.57% | 0.78% | 0.67% |
| Nov 2025 | 89.99% | 4.19% | 1.40% | 2.16% | 0.85% | 0.68% |
| Oct 2025 | 90.04% | 4.31% | 1.45% | 1.86% | 0.89% | 0.73% |
| Sep 2025 | 90.38% | 4.10% | 1.46% | 1.65% | 0.87% | 0.76% |
| Aug 2025 | 89.89% | 3.92% | 1.48% | 2.19% | 0.90% | 0.76% |
| Jul 2025 | 89.54% | 4.02% | 1.49% | 2.22% | 0.95% | 0.72% |
| Jun 2025 | 89.54% | 3.96% | 1.37% | 2.43% | 0.86% | 0.73% |
| May 2025 | 89.57% | 3.98% | 1.33% | 2.51% | 0.82% | 0.69% |
| Apr 2025 | 89.65% | 3.89% | 1.33% | 2.53% | 0.84% | 0.72% |
| Mar 2025 | 89.71% | 4.01% | 1.33% | 2.51% | 0.79% | 0.62% |
| Feb 2025 | 90.15% | 3.95% | 1.29% | 2.29% | 0.70% | 0.66% |
| Jan 2025 | 89.78% | 3.94% | 1.27% | 2.74% | 0.67% | 0.71% |
| Dec 2024 | 89.73% | 3.98% | 1.29% | 2.55% | 0.66% | 0.81% |
| Nov 2024 | 89.99% | 3.92% | 1.24% | 2.42% | 0.78% | 0.81% |
Source: Statcounter Global Stats, monthly series, worldwide, desktop, mobile, tablet and console combined.
Across these 24 months Google’s share ranged from 89.54% (June and July 2025) to 91.32% (July 2026), a band of 1.78 points. Bing ranged from 3.89% (April 2025) to 5.29% (September 2026). So the honest summary for 2026 is: Google has sat between 89.85% and 91.32% every month this year, and “Google has about 90% of search” is accurate on Statcounter’s method. Quote “91.04% in October 2026” if you need a precise, dated figure, and link the source.
Search engine market share by country (October 2026)
Global averages hide large national differences. Here are the markets people ask about most, plus the countries where Google is not the clear leader.
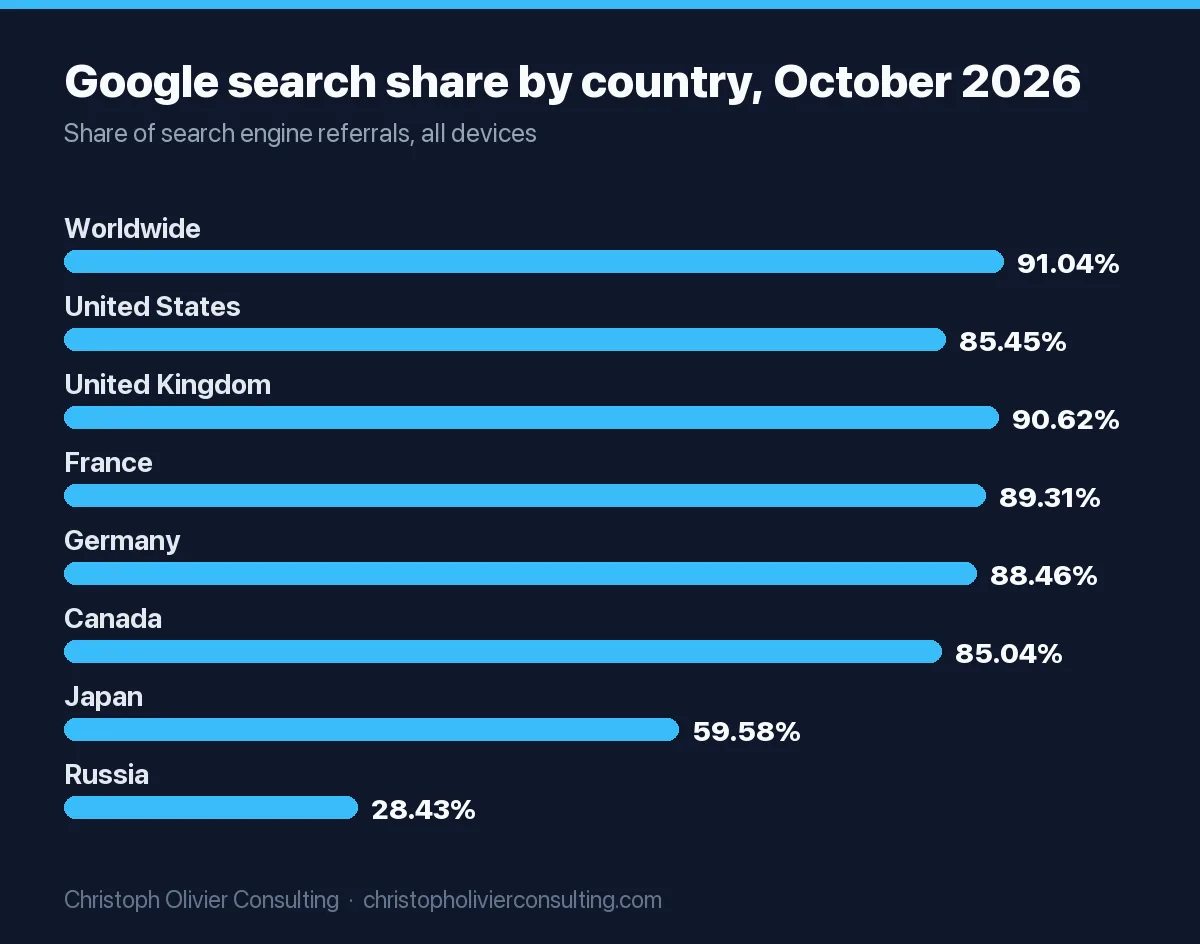
| Market | No. 1 engine | No. 2 engine | Bing | Google, change vs Oct 2025 | |
|---|---|---|---|---|---|
| Worldwide | Google 91.04% | Bing 4.77% | 91.04% | 4.77% | +1.00 pts |
| United States | Google 85.45% | Bing 9.76% | 85.45% | 9.76% | +0.35 pts |
| United Kingdom | Google 90.62% | Bing 6.72% | 90.62% | 6.72% | -1.85 pts |
| France | Google 89.31% | Bing 5.13% | 89.31% | 5.13% | +0.74 pts |
| Germany | Google 88.46% | Bing 6.39% | 88.46% | 6.39% | +3.91 pts |
| Europe (region) | Google 88.80% | Bing 5.55% | 88.80% | 5.55% | -0.05 pts |
| Canada | Google 85.04% | Bing 10.44% | 85.04% | 10.44% | -2.61 pts |
| Australia | Google 87.69% | Bing 9.32% | 87.69% | 9.32% | -3.44 pts |
| India | Google 98.06% | Bing 1.11% | 98.06% | 1.11% | +0.65 pts |
| Japan | Google 59.58% | Bing 32.26% | 59.58% | 32.26% | -18.34 pts |
| South Korea | Google 48.64% | Naver 42.10% | 48.64% | 4.92% | -3.45 pts |
| Saudi Arabia | Google 96.09% | Bing 2.69% | 96.09% | 2.69% | +0.04 pts |
| United Arab Emirates | Google 95.45% | Bing 2.68% | 95.45% | 2.68% | -0.19 pts |
| Russia | Yandex 70.15% | Google 28.43% | 28.43% | 0.82% | +1.49 pts |
| China | Baidu 49.08% | Bing 21.66% | 6.95% | 21.66% | +5.24 pts |
Source: Statcounter Global Stats country pages, all devices, October 2026 versus October 2025: US, UK, France, Germany, Canada, Japan, Saudi Arabia, UAE, Russia, China.
United States
Google 85.45%, Bing 9.76%, Yahoo! 2.54%, DuckDuckGo 1.75% in October 2026. Among the English-speaking markets in the table, only Canada (10.44%) gives Bing a bigger share. Google’s US share hit its lowest reading of the 25 months shown, 83.91%, in January 2026 and has recovered since. Bing’s US desktop share (18.81%) is the number that matters for B2B advertisers, covered in the device section below.
United Kingdom
Google 90.62%, Bing 6.72%, Yahoo! 1.37%, DuckDuckGo 0.70%. Google is down 1.85 points from 92.47% a year earlier, and UK Bing share has risen from 4.71% to 6.72% over the same 12 months. Most of that gain is on desktop, where Bing now holds 20.72% of UK search.
France
Google 89.31%, Bing 5.13%, Yahoo! 2.32%, Ecosia 1.22%, Qwant 0.76%. Of the European markets here, only France has both European engines, Ecosia and Qwant, above half a point. On French desktops Yahoo! reaches 7.40%, higher than in the UK (4.17%) or Germany (5.02%).
Germany
Google 88.46%, Bing 6.39%, Yahoo! 1.61%, Yandex 1.36%, DuckDuckGo 0.99%. Treat German year-over-year comparisons with care: Statcounter’s monthly German series swung from 90.18% (December 2025) to 81.82% (January 2026) and back to 88.41% (August 2026). Use a three-month average if you need a planning number.
Russia
Yandex leads with 70.15% against Google’s 28.43% in October 2026.
China
Baidu 49.08%, Bing 21.66%, Yandex 11.58%, Haosou 8.68%, Google 6.95%. Google’s October reading is up from 1.45% in September, a jump that is large enough to wait for revisions before quoting. Statcounter only sees clicks that land on websites carrying its tracking code, so in-app search that never loads a tracked website is not counted in any of these figures.
Japan and South Korea
Japan shows Google at 59.58% and Bing at 32.26% in October 2026, versus 77.92% and 10.87% a year earlier. A shift that large in a year is unusual, so check the latest month before building a Japan budget around it. South Korea is a genuine two-engine market: Google 48.64%, Naver 42.10%.
GCC countries
Statcounter has no single Gulf region, so here are the six GCC states for October 2026: Saudi Arabia (Google 96.09%, Bing 2.69%), UAE (95.45%, 2.68%), Qatar (95.82%, 3.23%), Kuwait (95.75%, 3.23%), Oman (94.01%, 5.19%) and Bahrain (97.60%, 1.85%). Google’s share is higher in all six than in the US or UK.
Desktop vs mobile search engine market share
Device is the biggest single driver of the numbers. Google is close to total on phones and much weaker on desktops, where Bing is strongest.
| Market | Google desktop | Bing desktop | Yahoo! desktop | Google mobile | Bing mobile |
|---|---|---|---|---|---|
| Worldwide | 77.93% | 15.00% | 3.32% | 96.31% | 0.61% |
| United States | 74.82% | 18.81% | 3.99% | 94.10% | 2.27% |
| United Kingdom | 73.23% | 20.72% | 4.17% | 97.85% | 0.48% |
| France | 71.43% | 16.28% | 7.40% | 96.89% | 0.37% |
| Germany | 70.31% | 19.68% | 5.02% | 96.61% | 0.39% |
Source: Statcounter Global Stats, October 2026: desktop worldwide, mobile worldwide, US desktop, US mobile, plus the UK, France and Germany platform views. Tablet, worldwide: Google 85.37%, Bing 11.14%.
The September 2026 desktop jump
Desktop shares changed abruptly between August and September 2026. Bing’s worldwide desktop share rose 5.74 points in one month. The next largest one-month move in the 25-month series was 0.81 points.
| Month | Google, desktop worldwide | Bing, desktop worldwide | Google, US desktop | Bing, US desktop |
|---|---|---|---|---|
| Jun 2026 | 85.92% | 9.12% | 83.93% | 11.65% |
| Jul 2026 | 86.12% | 8.84% | 83.08% | 12.08% |
| Aug 2026 | 85.94% | 8.91% | 81.84% | 12.94% |
| Sep 2026 | 78.09% | 14.65% | 74.70% | 18.83% |
| Oct 2026 | 77.93% | 15.00% | 74.82% | 18.81% |
Source: Statcounter Global Stats, desktop worldwide and US desktop.
Mobile shares did not move the same way (worldwide mobile Google was 95.55% in August and 95.68% in September). I found no explanation for the step on Statcounter’s chart pages, so treat the post-August desktop level as provisional. If you are comparing desktop numbers across years, say which month you used.
Worksheet: your audience’s real Bing share
National averages mislead if your traffic mix differs from the country’s. Weight the device shares by your own device split. In GA4, open Reports, then Acquisition, then Traffic acquisition, filter the session default channel group to Organic Search, and add Device category as a secondary dimension.
- Write down your desktop share (D) and mobile share (M) of organic sessions. Ignore tablet if it is under 5%.
- Bing share for your audience = (D x Bing desktop share) + (M x Bing mobile share), using your main country’s row in the table above.
- Do the same for Google.
- Compare the result with your actual Bing organic sessions in GA4. If Bing sends far less than the estimate, you have a Bing indexing or ranking gap worth fixing.
| Example (US, Oct 2026 shares) | Device split | Bing math | Estimated Bing share | Estimated Google share |
|---|---|---|---|---|
| B2B firm, office-hours audience | 70% desktop, 30% mobile | 0.70 x 18.81 + 0.30 x 2.27 | 13.85% | 80.60% |
| Consumer service business | 25% desktop, 75% mobile | 0.25 x 18.81 + 0.75 x 2.27 | 6.41% | 89.28% |
Same country, same month, and the B2B firm’s audience is roughly twice as likely to arrive via Bing. That gap is why a desktop-heavy professional firm should test Microsoft Advertising and confirm its site is submitted through Bing Webmaster Tools and IndexNow, while a mobile-first consumer brand can usually leave Bing until Google is fully covered.
Statcounter vs Similarweb vs Cloudflare Radar: why the numbers differ
Different trackers report different “market shares” because they count different things. Statcounter does not count searches at all. It counts search engine referrals: “If that person never clicks on any website result then no search engine referral will be tracked by us,” and each click to a tracked site counts once (Statcounter FAQ).
| Source | What it counts | Sample | Latest headline figure | Use it for |
|---|---|---|---|---|
| Statcounter Global Stats | Page views referred by a search engine to sites running its code. No weighting. | Tracking code on more than 1 million sites, more than 3 billion page views a month | Google 91.04% worldwide, Oct 2026 | Monthly share by country and device, free CSV |
| Cloudflare Radar | Referral traffic from search engines to sites on Cloudflare’s network | Sites on Cloudflare’s network | Google “nearly 90%” for 1 Jan to 2 Dec 2025; Bing 3.1%, Yandex 2.0%, Baidu 1.4%, DuckDuckGo 1.2% | A second, independent read on referral share |
| Similarweb | Estimated visits to search engine websites | Similarweb’s traffic estimates | google.com ranked No. 1, bing.com No. 2, yandex.ru No. 3 among search engines, Sep 2026 | Ranking sites by visits, AI platform traffic share |
| SparkToro with Datos | Desktop search sessions on 41 domains, including Amazon, YouTube and AI tools; AI prompt sessions count as one search | Datos desktop panel, US and EU plus UK, all of 2025 | Google 73.7% of US desktop searches across the 41 domains, Q4 2025 | Share of “all searching”, not just search engines |
Cloudflare’s 2025 review also splits by device: Google about 80% and Bing nearly 11% on desktop, Google almost 93% on mobile, and Yandex 65% against Google’s 34% in Russia (Cloudflare Radar 2025 Year in Review). Those sit close to Statcounter’s December 2025 readings (Google 90.82% all devices, 83.50% desktop), which is reassuring: two referral-based methods with different site samples land within a few points.
SparkToro’s 73.7% is lower because its denominator is bigger. It counts a product search on Amazon or a prompt in ChatGPT as a search, so it answers a different question: “where do people search?” rather than “which search engine sends clicks?”. Neither number is wrong. Quoting one as if it were the other is.
If you saw a query like “Similarweb search engine market share worldwide 2025”: Similarweb’s public search engine ranking lists sites by visits and does not publish a percentage split, so any “Similarweb share” figure you see quoted is someone’s calculation from visit estimates.
AI assistants as a search channel
Statcounter does not include ChatGPT or Perplexity in its search engine series. It tracks them separately, in an AI chatbot market share series. Statcounter does not publish a separate method note for that series. Given how the rest of Global Stats works, read it as each chatbot’s share of clicks from chatbots to tracked websites, not share of prompts.
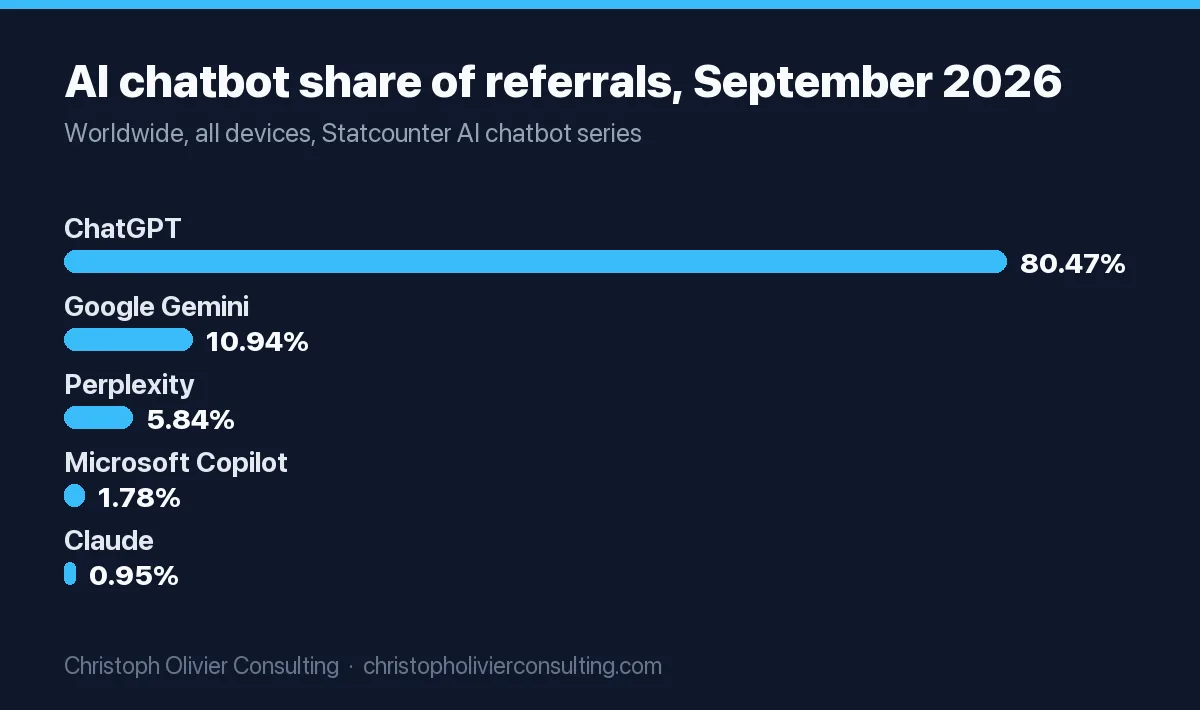
| AI chatbot | Worldwide, Sep 2026 | Worldwide, Sep 2025 | US, Sep 2026 | US, Sep 2025 |
|---|---|---|---|---|
| ChatGPT | 80.47% | 81.12% | 74.87% | 78.32% |
| Google Gemini | 10.94% | 2.82% | 13.43% | 3.05% |
| Perplexity | 5.84% | 10.85% | 3.07% | 7.72% |
| Microsoft Copilot | 1.78% | 4.04% | 6.69% | 9.54% |
| Claude | 0.95% | 0.99% | 1.85% | 1.33% |
Source: Statcounter Global Stats, AI chatbot market share worldwide and United States, CSV export, 1 November 2026.
The first-published October 2026 numbers look very different: worldwide ChatGPT 51.03%, Gemini 29.22%, Perplexity 15.22%; in the US, ChatGPT 36.75% and Gemini 35.76%. On 1 November the chart page and the CSV were already showing slightly different October values for ChatGPT (51.58% and 51.03%), so the month is still being revised. I would not quote October until mid-December, when the 45-day window closes.
Other verifiable AI search signals:
- Traffic share is shifting to Gemini. Similarweb puts ChatGPT’s share of generative AI web traffic at about 53% in May 2026, down from about 76% in June 2025, while Gemini rose from under 9% to about 27 to 28%, and Claude from about 2% to close to 9%. Generative AI platforms averaged 9.5 billion web visits a month worldwide over June 2025 to May 2026, up 70% year over year.
- AI is still a small share of searching. In SparkToro’s Datos panel, AI tools were 3.2% of desktop searches across 41 high-search domains in 2025, and Amazon, Bing and YouTube each had more desktop search activity than ChatGPT (SparkToro, March 2026).
- AI sends few clicks per page crawled. Cloudflare measured Anthropic’s crawl-to-refer ratio as high as 500,000:1 in 2025, and Perplexity’s below 200:1 from September 2025 onward, the lowest of the major AI platforms (Cloudflare Radar 2025 Year in Review).
- AI browsers hide inside Chrome numbers. Statcounter says Perplexity’s Comet, Dia and ChatGPT Atlas all identify as Chrome, so it records their usage under Chrome (Statcounter FAQ).
For a business, the practical read is: AI assistants are a fast-growing referral source, but a small one next to Google. Measure it in your own analytics before you move budget. Our guide to tracking ChatGPT and AI referrals in GA4 shows the setup, and the wider data set is in our AI search statistics for 2026.
US v. Google: what the remedies ruling changes
The US Justice Department’s search case is the biggest structural force on these numbers. Key dates, from primary and court reporting:
- 2 September 2025: Judge Amit Mehta of the US District Court for the District of Columbia issued his remedies decision. The court barred Google from “exclusive contracts relating to the distribution of Google Search, Chrome, Google Assistant, and the Gemini app,” ordered it to make “certain search index and user-interaction data available to rivals and potential rivals,” and to offer search and search text ads syndication to certain competitors (US Department of Justice).
- 5 December 2025: The final judgment was entered. Google cannot sign a default deal like its Apple arrangement unless it “terminates no more than one year after the date it is entered.” A technical committee decides which competitors get the shared data. Mehta did not order a sale of Chrome (CNBC).
- 16 January 2026: Google filed its notice of appeal. Most of the judgment took effect on 3 February 2026 and runs for six years (PPC Land).
- May 2026: Mehta denied Google’s request to pause the data-sharing remedies during the appeal, writing that “[T]here is no rule in this circuit that any disclosure of information is an irreparable harm sufficient to warrant a stay” (National Law Journal, 8 May 2026). Google filed its opening appeal brief on 22 May 2026, asking the appeals court to reverse the monopoly finding (PPC Land).
What it changes in practice: Google can still sign paid default deals like its Apple arrangement, but none may be exclusive and none may run longer than one year. Rivals, including AI companies, can get index and interaction data and syndicated results. The remedies explicitly reach generative AI products.
What it has not changed yet: the share numbers. Google’s US share was 84.17% in February 2026, the month the judgment took effect, and 85.45% in October 2026 (Statcounter). Defaults are sticky, data-sharing is still being set up, and the appeal is pending. If the remedies move share, watch US mobile first (Google 94.10% in October 2026), because phone and browser defaults are exactly what the contract limits cover.
“Recommendation search engine market”: the market-size reports
If you searched for “US recommendation search engine market” or “France recommendation search engine market”, you are probably looking for paid market-research reports, not search share. Those reports size the market for recommendation software: the systems that suggest products, shows or songs based on behaviour, using collaborative filtering, content-based filtering or hybrid methods. That is a different market from Google versus Bing. Here are the published estimates, with their own definitions.
| Market | Publisher | Base value | Forecast | CAGR stated | Watch out for |
|---|---|---|---|---|---|
| US | Market Research Future | $2,500M (2024) | $10,000M (2035) | 13.43% (2025 to 2035) | Same page also says $11.5B by 2035 and about 14.88% CAGR |
| US | Emergen Research | $1.5B (2024) | $4.2B (2034) | 11.0% | E-commerce about 50% of 2024 market; collaborative filtering about 45% |
| France | Market Research Future | $288.66M (2024) | $1,072.2M (2035) | 12.67% (2025 to 2035) | Summary section says about 13.83% CAGR |
| UK | Market Research Future | $346.39M (2024) | $1,284M (2035) | 12.65% | Overview section says $384.8M, $1,540.51M and about 13.44% |
| Canada | Market Research Future | $577.32M (2024) | $2,144.4M (2035) | 12.67% | Summary section says $432.9M, $1,072.4M and about 8.60% |
| GCC | Market Research Future | $269.42M (2024) | $1,045.4M (2035) | 13.12% | Summary section says $216.45M, $798.28M and about 12.60% |
| Global | The Insight Partners | $10.68B (2025) | $32.51B (2034) | 13.17% (2026 to 2034) | No country values on the public page |
| Global (“recommendation engine”) | Grand View Research | $7.1B (2025) | $84.4B (2033) | 36.3% (2026 to 2033) | North America 32.0% of 2025 revenue; much faster growth assumption than the others |
Market Research Future’s report pages were last updated 15 to 17 September 2026. How to use these numbers:
- Do not mix publishers. The two US estimates for 2024 differ by $1.0B ($2.5B versus $1.5B), because each publisher defines the market and its segments differently.
- Quote the header figure and say which section you used. All five Market Research Future pages above show conflicting figures in different sections of the same page.
- Compare growth rates, not sizes. Most estimates cluster at 11% to 14% a year. Grand View’s 36.3% is the outlier.
Which number to quote: a decision table
Most errors in decks and articles come from using the right number for the wrong question. Match the question to the source.
| Your question | Use | Figure to quote (with date) |
|---|---|---|
| What share of search does Google have worldwide? | Statcounter, all devices | 91.04%, October 2026 |
| Google’s share in the US? | Statcounter, US, all devices | 85.45%, October 2026 |
| Is Bing worth advertising on for a B2B audience? | Statcounter desktop, your country, weighted by your device split | US desktop Bing 18.81%, October 2026 |
| Does Google dominate mobile? | Statcounter, mobile | 96.31% worldwide, October 2026 |
| How much searching happens outside search engines? | SparkToro with Datos | Google 73.7% of US desktop searches across 41 domains, Q4 2025 |
| Which AI chatbot sends the most clicks? | Statcounter AI chatbot series | ChatGPT 80.47% worldwide, September 2026 |
| Which AI platform gets the most visits? | Similarweb | ChatGPT about 53% of gen AI web traffic, May 2026 |
| How big is the recommendation engine software market? | One named market-research report, with its definition | For example, US $1.5B in 2024 (Emergen Research) |
My view: for most professional-service firms, these numbers say the same thing they said two years ago. Win Google first, cover Bing if your buyers sit at desktops, and treat AI assistants as a channel to measure monthly rather than a reason to rebuild your plan. If you want a second opinion on where your own search traffic should come from, book a consultation. The click-through and ranking benchmarks that sit behind these shares are collected in our SEO statistics.
Frequently asked questions
What is Google's search engine market share in 2026 according to Statcounter?
Statcounter Global Stats put Google at 91.04% of worldwide search engine referrals across all devices in October 2026, with Bing at 4.77%, Yahoo! at 1.18% and Yandex at 1.17%. Every month of 2026 so far has been between 89.85% and 91.32%. Statcounter can revise a month for 45 days after first publication, so recheck the latest month before quoting it.
What is the search engine market share in the US?
In October 2026 Statcounter showed Google at 85.45% of US search across all devices, Bing at 9.76%, Yahoo! at 2.54% and DuckDuckGo at 1.75%. On US desktops Bing is much stronger at 18.81%, while on US mobile Google holds 94.10%. That desktop gap is why Bing matters more for B2B audiences.
What is the search engine market share in France?
Statcounter's October 2026 data shows Google at 89.31% in France, Bing 5.13%, Yahoo! 2.32%, Ecosia 1.22% and Qwant 0.76%. On French desktops Bing reaches 16.28% and Yahoo! 7.40%. If you were looking for the France recommendation search engine market, Market Research Future sizes that software market at $288.66 million for 2024.
What is the US recommendation search engine market size?
It is a different market from Google versus Bing: software that recommends products or content. Market Research Future estimates the US market at $2.5 billion in 2024, growing to $10 billion by 2035. Emergen Research estimates $1.5 billion in 2024 and $4.2 billion by 2034 at 11.0% a year. The gap comes from different definitions, so cite one publisher.
Why do Statcounter, Similarweb and Cloudflare show different search engine market shares?
They count different things. Statcounter counts clicks from search engines to more than 1 million sites running its code. Cloudflare counts search referrals to sites on its network and put Google at nearly 90% for 2025. Similarweb estimates visits to search sites. SparkToro and Datos count searches on Amazon, YouTube and AI tools too, which puts Google at 73.7% of US desktop searches.
Does Statcounter count ChatGPT as a search engine?
No. ChatGPT, Perplexity, Gemini and Copilot sit in a separate Statcounter AI chatbot series. In September 2026 ChatGPT had 80.47% of worldwide AI chatbot referrals, Gemini 10.94% and Perplexity 5.84%. First-published October 2026 figures show a much lower ChatGPT share and are still inside Statcounter's 45-day revision window.
What did the DOJ v. Google remedies ruling change?
Judge Amit Mehta's September 2025 decision and December 2025 final judgment bar Google from exclusive distribution deals, limit default deals to one year, and require it to share certain search index and interaction data with qualified rivals. Most of it took effect on 3 February 2026 for six years. Google has appealed. US share has not dropped since.