

The B2B sales statistics that hold up from 2024 to 2026: only 48% of account executives hit quota in 2026, down from 51% in 2024 (Bridge Group, 2026). 67% of B2B buyers prefer a rep-free experience, up from 61% a year earlier (Gartner, March 2026). Buyers first contact a seller when they are 61% through their process, down from 69% in 2024 (6sense, 2025).
On search: 94% of B2B buyers who searched for a product online used Google Search (Google and National Research Group, 2025), yet 51% now start software research with an AI chatbot more often than with Google, up from 29% in April 2025 (G2, March 2026 survey). Every figure below carries its publisher, survey date and sample. Where a famous number turned out to be older or narrower than it sounds, the table says so.
B2B sales statistics 2024 vs 2026: the headline numbers
Most “2024” pages are still circulating. Here is each metric’s 2024 reading next to the newest one from the same publisher, so you can see the direction instead of a single snapshot.
| Metric | 2024 reading | Latest reading | Source and sample |
|---|---|---|---|
| Account executives at quota | 51% | 48% (2026) | Bridge Group, 158 B2B companies, Q1 to Q2 2026 |
| Sellers missing quota | 69% falling short (2024) | 78% missed (2025) | Ebsta and Pavilion, CRM data plus a survey of 2,000 CROs |
| Rep time spent selling | 30% (70% non-selling) | 40% (60% non-selling) | Salesforce State of Sales: 5,500 pros, Mar to Apr 2024; 4,050 pros, Aug to Sep 2025 |
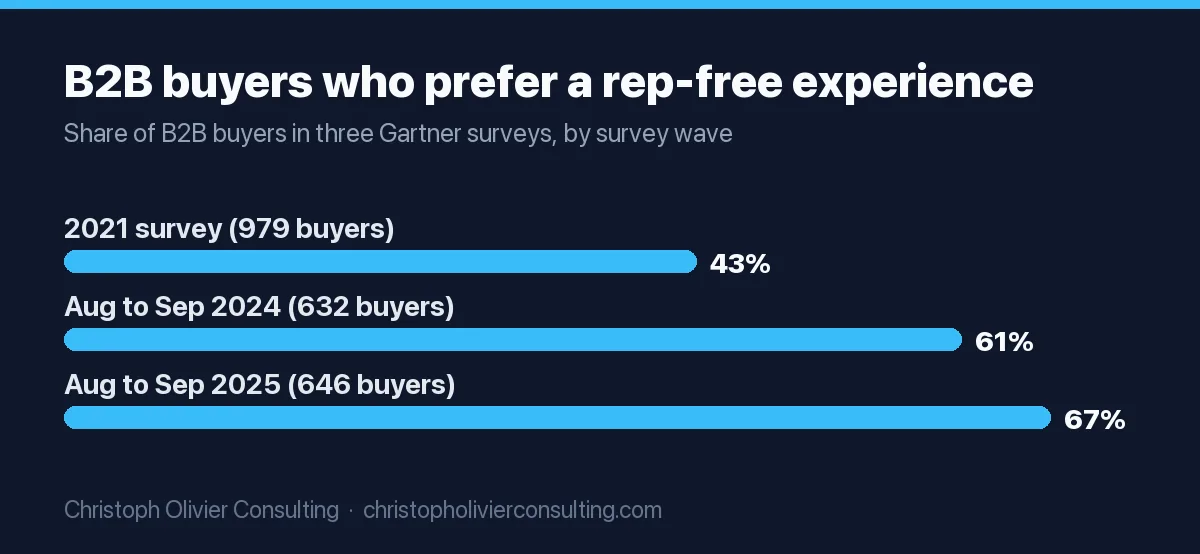
| Buyers preferring a rep-free experience | 61% (surveyed Aug to Sep 2024) | 67% (surveyed Aug to Sep 2025) | Gartner, 632 and 646 B2B buyers |
| Point in the journey when buyers first contact a seller | 69% | 61% (2025) | 6sense Buyer Experience Report, about 4,000 buyers |
| Average B2B buying cycle | 11.3 months | 10.1 months (2025) | 6sense, global average |
| People in a buying decision | 13, with 89% of purchases spanning 2+ departments | 13 internal stakeholders plus 9 external influencers | Forrester State of Business Buying, 2024 and 2026 |
| Purchases that stall | 86% | Not in the 2026 release | Forrester, December 2024 release |
| Software buyers starting research with an AI chatbot more often than Google | 29% (April 2025) | 51% (March 2026) | G2, 1,169 and 1,076 B2B decision makers |
| Tech buyers who used AI to research a purchase | 68% said genAI had no impact (surveyed Jan 2024) | 63% used AI (surveyed Jan 2026) | TrustRadius B2B buying reports |
| Sales teams using AI | 81% experimenting or fully implemented | 54% use AI agents now; 34% expect to within 2 years | Salesforce, 2024 and 2026 editions |
Two readings matter more than the rest. Quota attainment is getting worse while sellers get more selling time, which points at the buyer side, not rep effort. And buyers are reaching sellers earlier in the journey (61% vs 69%), but with shortlists already ranked. The marketing side of the same buyer data, including budgets by industry, is on our B2B marketing statistics page.
Forrester B2B sales forecast for 2025: quota attainment, win rates and predictions
Forrester does not publish a single “2025 sales forecast” with a win rate number in its public releases. What it does publish, with dates:
| Forrester statement | Published | What it means for a sales team |
|---|---|---|
| Average quota attainment for B2B sales organizations is 47%, while median seller attainment is 101% | Blog by Seth Marrs, March 14, 2023 | Forrester argues roughly 50% attainment is what a well-built comp plan produces. Raising it every year is not the goal; quota accuracy is. |
| More than half of large B2B purchases (US$1 million or more) will be processed through digital self-serve channels in 2025 | Predictions 2025, October 22, 2024 | Large deals need a self-serve path: pricing logic, security documents and contracts that buyers can work through without a meeting. |
| Half of younger buyers will involve 10 or more external influencers in a purchase | Predictions 2025 | References, communities and analysts now sit inside the deal, not around it. |
| Only 12% of marketing leaders think their current team design will help them meet revenue targets | Predictions 2025 | Org redesign is coming, and Forrester predicted half of CMO and CSO reorganizations would fail to fix the problem. |
| 20% of B2B sellers will be forced to engage in agent-led quote negotiations | Predictions 2026, October 28, 2025 | Buyer AI agents will request quotes; sellers will answer with their own agents. |
| 30% of buyers rated genAI tools a meaningful interaction in the final commit stage, vs 17% for product experts; 19% of buyers using genAI felt less confident because of inaccurate output | Predictions 2026 | Expect buyers to arrive with AI-generated conclusions that a human expert has to confirm or correct. |
For win rates, the most detailed public benchmark is the Ebsta and Pavilion 2024 B2B Sales Benchmarks, built from 4.2 million opportunities and $54 billion of revenue across 530 companies. Its 2024 findings:
- Win rates in 2023 fell 18% versus 2022 and 27% versus 2021.
- When a deal slipped, win rates fell 67%, especially for deals delayed more than 8 weeks.
- Offering a discount early cut win rates by 39%.
- More than 7 days of inactivity with no next step scheduled cut win rates by 65%.
- 44% of deals were pushed back, and reps logged 61% of lost deals as lost to “indecision.”
- Only 17% of reps generated 81% of revenue.
Note these are relative changes, not absolute win rates. Ebsta’s public page does not state a single average win rate, so any page quoting “the Ebsta win rate is X%” is quoting something the source does not show. If you are building next year’s number, our guide to sales forecasting methods shows how to use your own stage-to-close rates instead of an industry average.
Quota attainment statistics: why every source gives a different number
“What percentage of reps hit quota” has at least six published answers. They differ because they measure different people and different periods.
| Source | Who is measured | Figure | Sample and date |
|---|---|---|---|
| Bridge Group AE report | Account executives | 48% at quota (51% in 2024). With high AI engagement: 57%; low engagement: 39% | 158 B2B companies, survey Q1 to Q2 2026 |
| Bridge Group SDR report | Sales development reps | 60% at quota, the lowest in the study’s history | 351 B2B companies, survey 2024 to 2025, published February 2025 (the latest SDR edition) |
| Salesforce State of Sales, 6th edition | Sales reps, self-reported | 84% missed quota the prior year; 67% did not expect to hit quota in 2024 | 5,500 pros, 27 countries, March to April 2024 |
| Ebsta and Pavilion | Sellers in CRM data | 69% falling short in 2024; 78% missed in 2025 | Pipeline data plus a 2,000-CRO survey |
| Forrester | Organizations and sellers | 47% average company attainment; 101% median seller attainment | Benchmark data, sample not stated, March 2023 |
| Gartner | B2B sellers | Sellers who partner effectively with AI are 3.7 times more likely to meet quota; overwhelmed sellers are 45% less likely | 1,026 sellers, January to March 2024 |
Compensation context from the same Bridge Group 2026 study: median AE quota is $960,000 ($875,000 at SaaS companies), median on-target earnings $200,000, a 4.6 times quota-to-OTE ratio, and average ramp of 6.2 months, the longest in the study’s history. For SDRs (2025 edition): median OTE $80,000, average tenure 1.9 years, average ramp 3.0 months, and a median monthly quota of 10 held meetings.
Worked example: what 48% at quota costs. Take 10 AEs at the $960,000 median quota, $9.6 million in total. At 48%, about 5 of 10 reps hit their number. If those 5 finish at exactly 100% and the other 5 average 80%, the team books 5 x $960,000 + 5 x $768,000 = $8.64 million, or 90% of plan. That is a $960,000 gap, one full rep’s quota, from a team that looks “half on target.” The arithmetic is mine; the inputs are Bridge Group’s.
What percentage of B2B buyers use Google search?
The short answer: 94% of B2B buyers who searched for a product online said they used Google Search, and 80% of B2B software buyers still use Google somewhere in their buying journey even as AI chatbots take over the first query. But the 94% comes from a narrow subgroup, so read the denominators before you quote it.
| Figure | Exactly who was asked | Source |
|---|---|---|
| 94% used Google Search | 165 US buyers who first heard about the product they bought by looking it up online | Google and National Research Group, B2B buyer journey study, US, Q2 2025 |
| 80% use Google somewhere in the buying journey | 1,076 B2B software decision makers, global, March 2026 | G2 2026 AI search insight report |
| 63% use Google Search to validate or cross-check AI answers | 1,861 US buyers who used AI tools in their journey | Google and NRG, 2025 |
| 72% encountered Google’s AI Overviews while researching; 90% of them clicked through to a cited source | 2,058 technology buyers, surveyed January 2025 about purchases in the prior year | TrustRadius, Bridging the Trust Gap, 2025 |
| “Most buyers start their search journey on Google”; 52% used vendor websites, 13% as the first resource | Same TrustRadius sample | TrustRadius, 2025 |
| 68% say Google Search helped them get more value after purchase | 2,063 US senior leaders | Google and NRG, 2025 |
If you searched for “2024 B2B buyers use Google search percentage,” the closest match is the TrustRadius 2025 survey: it was fielded in January 2025 and asked about purchases made in the previous year, so it describes 2024 buying behavior. In that sample, most buyers started on Google, 72% saw AI Overviews, and only 7% used LLMs like ChatGPT as part of the buying process. TrustRadius summed it up: “For now, search still plays a far more dominant role than the direct usage of LLMs.” That was true for 2024 purchases. By March 2026, G2’s data says it no longer holds for software research.
Note who published the 94%: Google commissioned the study. The sample is real and the claims appendix is unusually transparent, but treat it as a vendor study. For how AI engines choose which sources to cite, see our AI search statistics.
AI chatbots in B2B research: every number with its date
AI adoption figures for B2B buyers range from 7% to 94% within the same year. The spread is real: the surveys ask different questions of different buyers. Ordered by fieldwork date:
| Fieldwork | Finding | Question asked | Source |
|---|---|---|---|
| January 2024 | 68% said genAI had no impact on their buying; 20% said it was helpful | Impact of genAI on tech purchase | TrustRadius (as reported in its 2025 report) |
| 2024 | Almost 95% of buyers anticipated using genAI in the purchase process within 12 months | Intent, not use | Forrester, December 2024 |
| January 2025 | 7% used LLMs like ChatGPT in the buying process; occasional AI use rose from 17% to 30% | Direct LLM use for a purchase | TrustRadius, 2,058 buyers |
| April 2025 | 29% started research on LLMs more often than on Google | Where research starts | G2, 1,169 decision makers |
| Q2 2025 | 60% used AI tools like ChatGPT or Gemini; 84% said AI tools speed up their process | Any AI use in the journey | Google and NRG, 2,063 US leaders |
| August to September 2025 | 45% used AI during a recent purchase | AI use in a recent purchase | Gartner, 646 buyers |
| 2025 | 94% used LLMs, for example to summarize reviews or analyze data | LLM use anywhere in the process | 6sense, about 4,000 buyers |
| January 2026 | 63% used AI to research a software purchase; 94% of them fact-check AI answers at least some of the time | AI use for research | TrustRadius 2026 Buying Disconnect, 1,862 buyers |
| March 2026 | 51% start with an AI chatbot more often than Google; 71% rely on chatbots somewhere; 69% chose a different vendor than planned because of a chatbot | Where research starts and what changes | G2, 1,076 decision makers |
More from the G2 March 2026 survey, because it is the newest and most detailed: generative AI chatbots were the top shortlist influence at 54%, ahead of review sites (43%) and vendor salespeople (19%). ChatGPT held 62% of B2B software research chatbot use, up from 47% in 2025. 64% of buyers hit AI inaccuracies a few times a month or more, and 45% said citations of software review sites were the most confidence-inspiring signal in an AI answer. G2’s press release gives ChatGPT’s share as 63%; the report page says 62%.
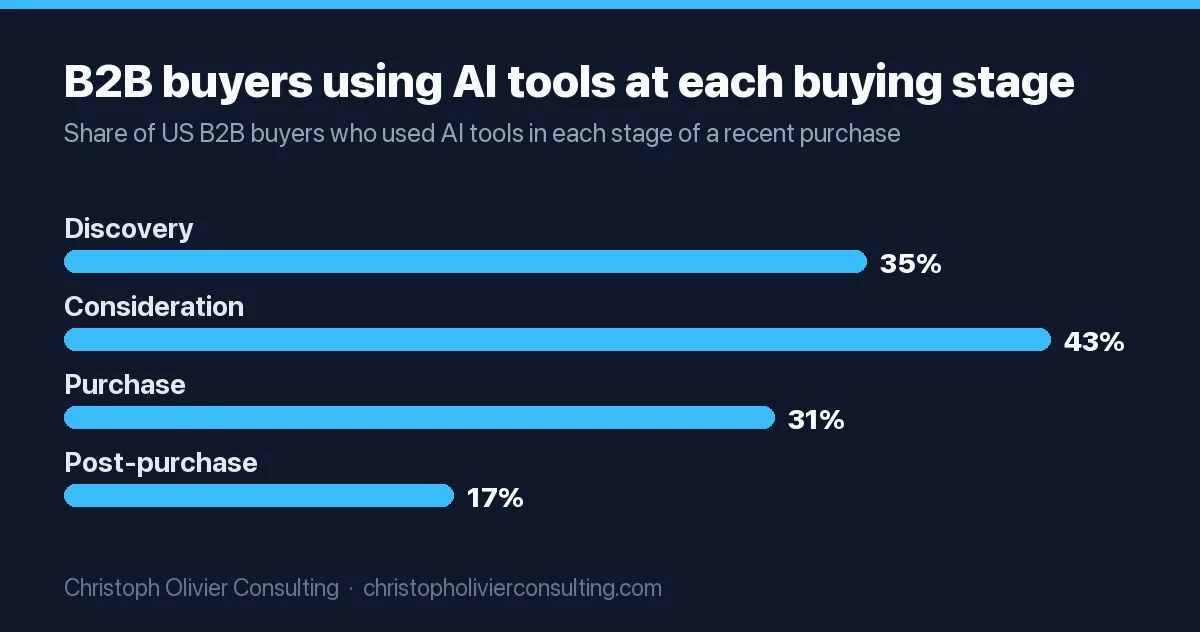
Where AI shows up in the journey matters as much as whether it does. Google and NRG measured it by stage: 35% of US buyers used AI tools during discovery, 43% during consideration, 31% at purchase and 17% after purchase. AI peaks while the shortlist is being built, which is exactly when your sales team is not yet in the room.
The famous B2B sales stats, traced to their origin
These five claims appear on almost every B2B sales statistics page. Here is where each one actually came from and what to cite now.
| Claim as usually repeated | Original source | Verdict and what to cite instead |
|---|---|---|
| “Buyers are 57% through the purchase process before they contact sales” | CEB’s Marketing Leadership Council surveyed more than 1,500 decision makers and influencers in recent purchases from 22 large B2B suppliers (CEB MLC Customer Purchase Research Survey, 2011). Published in The Digital Evolution in B2B Marketing (CEB with Google, 2012). Supplier averages ranged from 45% to 70%. CEB’s Matthew Dixon repeated it in a November 7, 2012 release. | Real, but it is 2011 fieldwork and an average across 22 suppliers. Cite 6sense instead: first contact at 61% of the journey in 2025, 69% in 2024. |
| “B2B buyers spend only 17% of their time with sales reps” | Gartner survey of 750 B2B buyers, in circulation by February 2019. Gartner’s own 2021 webinar deck shows the split: 27% researching online, 18% researching offline, 22% meeting with the buying group, 17% meeting all potential suppliers combined, 16% other. | It is 17% for all suppliers together, not per rep. Split across three suppliers, that is about 5.7% each (my arithmetic). Still Gartner’s most-cited time split; label it as roughly 2019 data. |
| “X% of buyers prefer a rep-free experience” | Gartner, three readings: 43% (2021 Digital Buying Survey, 979 customers, in the same 2021 deck), 61% (632 buyers, Aug to Sep 2024), 67% (646 buyers, Aug to Sep 2025). Gartner’s buying journey page also promotes an eBook saying 75%, with no date or sample. | Cite 67% with the 2025 fieldwork date. Do not use 75% without its sample. The 2021 deck also found a 23% increase in purchase regret among rep-free buyers. |
| “13 people are involved in a B2B purchase” | Forrester State of Business Buying 2024 (13 people; 89% of purchases involve 2+ departments). The 2026 edition says 13 internal stakeholders and 9 external influencers. | Correct, but definition-dependent. Gartner’s deck says 6 to 10 (1,040 buyers); TrustRadius found 4.8 for software buying groups in 2025. Quote the source next to the number. |
| “95% of B2B buyers are out of the market” | Professor John Dawes for the LinkedIn B2B Institute: firms change providers such as their bank or law firm about once every five years, so about 20% are in market in a year and about 5% in a quarter. | Dawes calls 95% a heuristic, not a precise rule. Recalculate it with your own category’s purchase frequency. |
Worked example: when does a buyer actually call you? 6sense puts the average cycle at 10.1 months and first contact at 61% of the way through. 10.1 x 0.61 = 6.2 months of research before a seller hears from the buyer, and 6sense found 94% of buying groups had already ranked their shortlist by then. For a software purchase, TrustRadius’s 3.8-month average cycle gives 3.8 x 0.61 = about 2.3 months (mixing two surveys, so treat it as a rough guide). Our walkthrough on how to map, measure and compress your sales cycle shows how to measure your own version of this number from CRM dates.
Sales cycle and shortlist statistics
| Metric | Figure | Source |
|---|---|---|
| Average B2B buying cycle | 10.1 months globally in 2025 (11.3 in 2024); North America 11.1 months | 6sense, 2025, via CustomerThink’s summary and the November 12, 2025 release |
| Software deal cycle | 3.8 months on average; 6.6 months for enterprise deals; 86% close in 6 months or less | TrustRadius, 2025 |
| Buying journeys of 12 weeks or less | 77% | Google and NRG, US, 2025 |
| Sellers who say customers take longer to decide | 57%; 67% say customers require extensive education | Salesforce, 2026 |
| Buying groups that ranked vendors before first contact | 94%; they bought from that favorite 77% of the time | 6sense, 2025 |
| Vendors evaluated | About 5 (6sense); shortlist of 2.6 products (TrustRadius 2025); 83% shortlisted 3 or fewer (TrustRadius 2026) | 6sense; TrustRadius |
| Buyers who bought from their Day 1 list | 82% (among buyers who had a Day 1 list but looked at other options) | Google and NRG, 2025 |
| Buyers who initiated contact with vendors | 79% | 6sense, 2025 |
| Procurement as a decision maker | 53% of buying cycles; more than 60% of buyers use a trial, 78% for purchases of $10 million or more | Forrester, 2026 |
| Buyers who avoid suppliers sending irrelevant outreach | 73%; 69% saw inconsistencies between a supplier’s website and its sellers | Gartner, June 2025 |
The cycle numbers look contradictory (10 months vs 12 weeks) until you check the samples. 6sense surveys larger, committee-driven purchases. Google and NRG include SaaS, web services and B2B retail such as office supplies. Use the benchmark that matches your deal size.
Seller productivity and AI on the sales side
- Reps spend 40% of an average week selling and 60% on non-selling work (Salesforce, 2026). In 2024 the split was 30/70.
- 54% of sales teams use AI agents now and 34% expect to within two years (Salesforce, 2026). In 2024, 81% of teams were experimenting with or had fully implemented AI: 40% experimenting, 41% fully implemented.
- In 2024, 83% of sales teams with AI saw revenue growth versus 66% without it (Salesforce, 2024). That is a correlation from a vendor that sells sales AI.
- 72% of sellers feel overwhelmed by the number of skills their job requires and 50% by the amount of technology (Gartner, 2024).
- Reps at companies with high AI engagement were at quota 57% of the time vs 39% with low engagement (Bridge Group, 2026).
Enablement data, including ramp, coaching and content use, is on our sales enablement statistics page, with the same Bridge Group and Salesforce figures.
Pre-contact visibility test: 7 checks tied to the data
Most of the statistics above say the same thing: the shortlist forms before your sales team is involved. This test turns that into checks you can run in an afternoon. The data column is sourced above. The pass thresholds are my suggested starting points, not study findings.
| Check | How to run it | Pass | Fail | Data behind it |
|---|---|---|---|---|
| 1. Google category test | Search your 5 core service queries in an incognito window (e.g. “[service] for [industry]”) | Your site on page 1 for 3 of 5 | Page 1 for 0 or 1 | 94% of online-searching buyers used Google; 80% use it somewhere |
| 2. AI shortlist test | Ask ChatGPT, Gemini and Claude: “Which firms should a [buyer role] shortlist for [service]?” | Named by 2 of 3 | Named by none | 51% start with a chatbot; chatbots are the top shortlist influence (54%) |
| 3. Fact-check test | List every claim the AI made about you. Can a buyer confirm each one on your site in one click? | Every claim has a page | Pricing, results or capabilities are only in sales decks | 94% of AI users fact-check; 63% validate with Google |
| 4. Review citation test | Check the review site that appeared in the AI answers for your category | A current profile with recent reviews | No profile, or reviews older than 12 months | 45% say review-site citations inspire the most confidence; 74% use reviews |
| 5. Consistency test | Compare your homepage claims with the first 3 slides of your sales deck | Same 3 core claims, same numbers | Different positioning or numbers | 69% of buyers report website vs seller inconsistencies |
| 6. Committee test | Is there a page for finance and procurement (pricing logic, contract terms, security)? | Yes, reachable without a form | Only “contact sales” | Procurement decides in 53% of cycles; 13 internal stakeholders |
| 7. Outreach relevance test | Read your last 20 outbound emails. Does each name a trigger specific to that account? | 16 of 20 or more | Fewer than 10 | 73% avoid suppliers who send irrelevant outreach |
Score one point per pass. Five or more means buyers can find, verify and shortlist you before the first call. Three or fewer means the 61% of the journey before contact is happening without you. If checks 2 and 3 fail, start with our guide on how to rank on ChatGPT. If you want a second opinion on your results, you can book a consultation.
How to cite B2B sales statistics without getting caught out
- Put the fieldwork date next to the number. Gartner’s 67% is from a survey run in August to September 2025, released March 2026. “2026 data” overstates it.
- Name the denominator. “94% of buyers use Google” is wrong. “94% of buyers who searched for a product online used Google” is right.
- Separate intent from behavior. Forrester’s “almost 95% anticipate using genAI” is a plan. 6sense’s 94% and G2’s 71% are reported use.
- Flag the sponsor. Google funded the Google Search study. Salesforce, 6sense, G2 and TrustRadius sell to the audiences they survey. That does not make the data wrong; it means you say so.
- Retire the 2011 and 2019 numbers when a newer reading from a named publisher exists, as with 57% (now 61%) and 43% rep-free (now 67%).
Frequently asked questions
What percentage of B2B buyers use Google search?
In a 2025 Google and National Research Group study of US buyers, 94% of those who searched for a product online said they used Google Search, though that subgroup was only 165 people. In G2's March 2026 survey of 1,076 decision makers, 80% still used Google somewhere in the buying journey, even though 51% now start research with an AI chatbot more often than with Google.
What are the most important B2B sales statistics from 2024?
From 2024 fieldwork: 61% of B2B buyers preferred a rep-free experience (Gartner, 632 buyers), 86% of purchases stalled and 13 people were involved in a typical decision (Forrester), reps spent 70% of their time on non-selling work and 84% missed quota the prior year (Salesforce, 5,500 pros), and 51% of account executives hit quota (Bridge Group).
What does Forrester say about quota attainment and win rates?
Forrester analyst Seth Marrs wrote in March 2023 that average quota attainment for B2B sales organizations is 47% while median seller attainment is 101%, and that roughly 50% is what a well-designed comp plan should produce. Forrester's public 2025 predictions cover self-serve buying and influencers, not a win rate figure. For win rates, Ebsta and Pavilion found 2023 win rates fell 18% versus 2022.
How many B2B buyers use AI chatbots for research?
It depends on the question asked. G2's March 2026 survey found 71% of software buyers rely on AI chatbots and 51% start research with one more often than Google. TrustRadius found 63% used AI to research a purchase in January 2026, Gartner found 45% used AI in a recent purchase, and 6sense reported 94% used LLMs somewhere in the process in 2025.
Are B2B buyers really 57% through the buying process before contacting sales?
The 57% figure comes from a 2011 CEB Marketing Leadership Council survey of more than 1,500 decision makers buying from 22 suppliers, published with Google in 2012. Supplier averages ranged from 45% to 70%. The current replacement is 6sense: buyers made first contact 61% of the way through their journey in 2025, down from 69% in 2024.
How much time do B2B buyers spend with sales reps?
Gartner's survey of 750 B2B buyers, in circulation since early 2019, found buyers spend 17% of their buying time meeting with all potential suppliers combined. The rest goes to independent online research (27%), offline research (18%), meetings within the buying group (22%) and other activities (16%). Split across three suppliers, that is roughly 5% to 6% of time with any one rep.
What percentage of sales reps hit quota in 2026?
The Bridge Group's 2026 study of 158 B2B companies found 48% of account executives at quota, down from 51% in 2024, with average ramp time at 6.2 months. Its latest SDR study, published February 2025, found 60% of SDRs at quota, the lowest in its history. Ebsta and Pavilion reported that 78% of sellers missed quota in 2025.