

US programmatic advertising revenue was $134.8 billion in 2024, up 18.0%, out of $258.6 billion in total US internet ad revenue, of which search was $102.9 billion, per the IAB/PwC Internet Advertising Revenue Report: Full Year 2024. In 2025, programmatic rose 20.5% to $162.4 billion and the total reached $294.6 billion, per IAB’s April 16, 2026 release. That puts programmatic at 52.1% of all US internet ad revenue in 2024 and 86.6% of everything outside search.
Below: the IAB figures with PDF page numbers, the programmatic series back to 2014, the open RTB vs direct split, audited revenue from The Trade Desk, Magnite and PubMatic, the ANA’s supply chain findings, CPMs from named sources, and a table of which number to cite for which claim.
IAB 2024 figures: $258.6B total, $102.9B search, $134.8B programmatic
If you searched for “$258.6” and “102.9”, these are the numbers, from the same PDF. The 2025 column comes from IAB’s public 2025 release, because the full 2025 report sits behind a free IAB account.
| IAB/PwC category | FY 2024 | 2024 growth | 2024 share | FY 2025 | 2025 growth | 2025 share | Where in the FY 2024 PDF |
|---|---|---|---|---|---|---|---|
| Total US internet advertising | $258.6B | +14.9% | 100% | $294.6B | +13.9% | 100% | Pages 5 and 6 |
| Search | $102.9B | +15.9% | 39.8% | $114.2B | +11.0% | 38.8% | Page 16 (share chart page 17) |
| Display (banner, rich media, sponsorship, native) | $74.3B | +12.4% | 28.7% | $81.6B | +9.8% | 27.7% | Page 16, footnote 18 |
| Digital video (incl. CTV) | $62.1B | +19.2% | 24.0% | $78.0B | +25.4% | 26.5% | Page 16 |
| Podcast | $2.43B | +26.4% | 0.9% | $2.9B | +17.6% | 1% | Page 6 (growth) |
| Overlapping cut: social media | $88.8B | +36.7% | 34.3% | $117.7B | +32.6% | 40.0% | Pages 7 and 21 |
| Overlapping cut: retail media (2024) / commerce media (2025) | $53.7B | +23.0% | 20.8% | $63.4B | +18.0% | 21.5% | Pages 7 and 22 |
| Overlapping cut: programmatic (excl. search) | $134.8B | +18.0% | n/a | $162.4B | +20.5% | n/a | Pages 6 and 20 |
Do not add the programmatic row to the format rows. IAB’s survey definitions (page 27) say programmatic “refers to different ways of selling ads overall; it is not a separate format. Therefore, revenue may appear duplicative to other revenues listed.” A programmatic video ad on a social app sits in video, social and programmatic at once. Our contextual advertising statistics page uses the same IAB table and explains how the format rows sum to $258.6B.
US programmatic advertising revenue by year, 2014 to 2025
IAB/PwC measures programmatic as revenue earned by ad sellers, excluding search. Page 20 of the FY 2024 report splits all non-search revenue into programmatic and “non-programmatic placements,” so the two columns below add up to total revenue minus search for every year from 2020 to 2024.
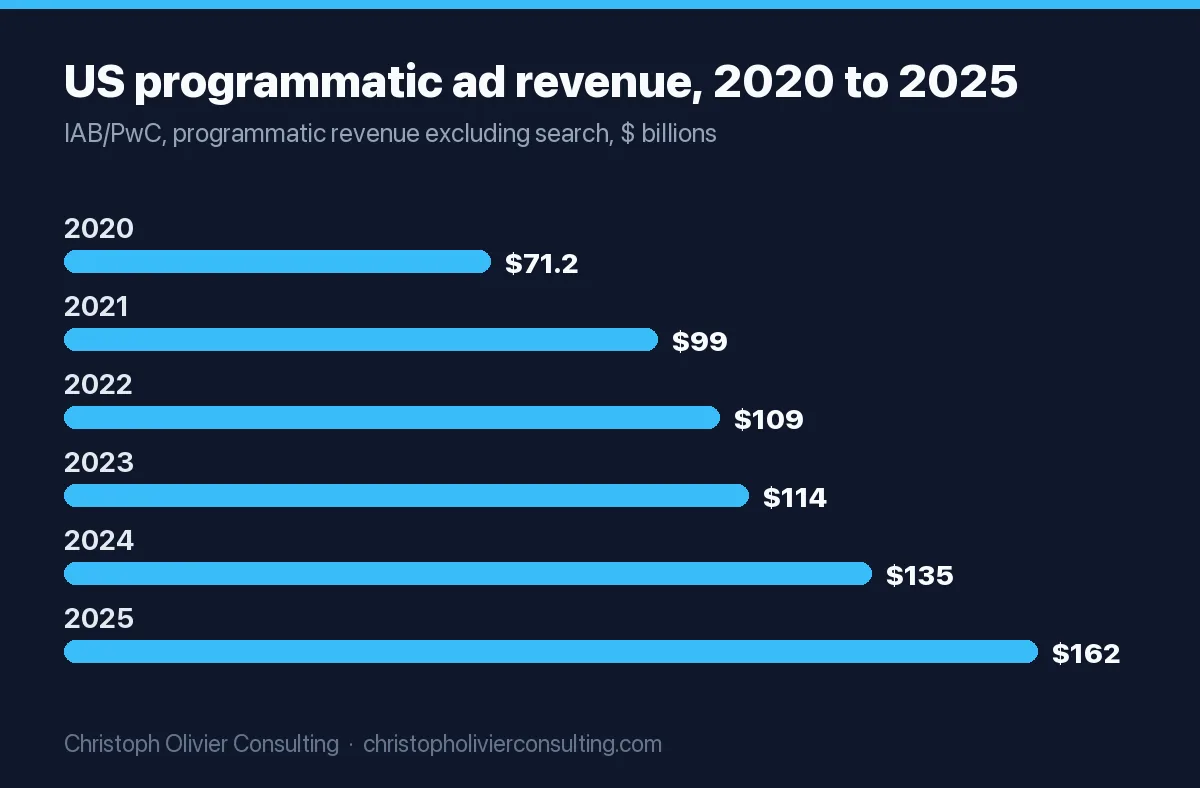
| Year | Programmatic revenue | YoY growth | Non-programmatic (excl. search) | Programmatic share of non-search revenue | Programmatic share of all internet ad revenue |
|---|---|---|---|---|---|
| 2014 | $10.1B | n/a | n/a | About 52% of display | 20% of $49.5B |
| 2020 | $71.2B | n/a | $9.7B | 88.0% | 50.9% |
| 2021 | $99.0B | +39.0% | $12.0B | 89.2% | 52.3% |
| 2022 | $109.4B | +10.5% | $16.0B | 87.2% | 52.2% |
| 2023 | $114.2B | +4.4% | $22.0B | 83.8% | 50.8% |
| 2024 | $134.8B | +18.0% | $20.9B | 86.6% | 52.1% |
| 2025 | $162.4B | +20.5% | Not in public release | About 90.0% if the basis is unchanged | 55.1% |
Sources: 2020 to 2024 from the bar chart on page 20 of the FY 2024 report; 2025 from the FY 2025 release; 2014 from IAB’s first programmatic revenue report (July 20, 2015), a separate study. Growth rates and shares are our arithmetic from those dollar figures. The 2025 release does not say whether $162.4B excludes search, so the 90.0% (162.4 ÷ 180.4) assumes it does.
Two things stand out. Programmatic grew 13.3 times from 2014 to 2024. And non-programmatic placements grew from $9.7B to $22.0B between 2020 and 2023 before falling 4.9% to $20.9B in 2024, so the programmatic share of non-search revenue dipped to 83.8% in 2023 before recovering.
What percentage of digital advertising is programmatic?
The answer depends on the denominator. Pick the one that matches your sentence:
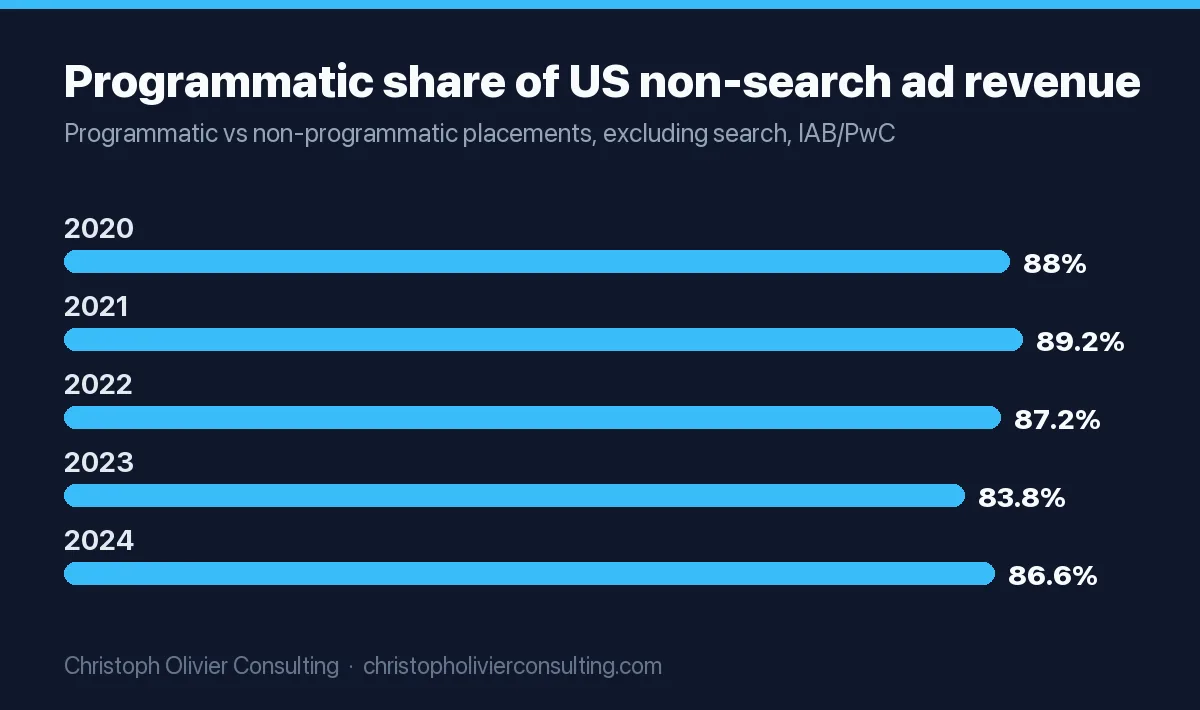
- Share of all US internet ad revenue: 52.1% in 2024, 55.1% in 2025. Programmatic revenue divided by the IAB total, search included. Use this for “programmatic is now more than half of US digital advertising.”
- Share of non-search revenue: 86.6% in 2024. IAB counts no search as programmatic, so this is the fairer measure of how much display, video, audio and social inventory trades by machine. Use this for “nearly nine in ten non-search ad dollars.”
- Share of display only. Forecasters such as EMARKETER publish programmatic shares of display above 90%. Their pages returned 403 errors during our research, so we do not quote a figure here. If you cite one, label it a forecast and name the edition.
The 2014 baseline shows how fast this moved: programmatic was 20% of all US internet ad revenue then, per IAB. By 2024 it was 52.1%.
Open RTB vs programmatic direct
| Year | Open RTB (any buyer can bid) | Programmatic direct (PMP, preferred deals, automated guaranteed) | Source |
|---|---|---|---|
| 2014 | About 70% (“open auctions”) | About 30% | IAB programmatic revenue report, 2015 |
| 2023 | 63% | 37% | IAB/PwC FY 2024, page 20 |
| 2024 | 61% (about $82.2B) | 39% (about $52.6B) | IAB/PwC FY 2024, page 20; dollar split is our arithmetic |
IAB’s definitions (page 27): a private marketplace is RTB “yet only select advertisers are allowed to bid”; preferred deals guarantee price but not volume; automated guaranteed fixes both.
Programmatic revenue at The Trade Desk, Magnite and PubMatic
Three US-listed independent ad tech companies file audited numbers with the SEC. They show how much of the programmatic dollar becomes ad tech revenue, which no market forecast can.
| Company (side of the trade) | FY 2025 revenue | FY 2024 revenue | Other FY 2025 metric | H1 2026 revenue (growth) |
|---|---|---|---|---|
| The Trade Desk (buy side DSP) | $2,896.3M (+18%) | $2,444.8M | Gross spend $13,394.7M (+11%); net income $443.3M | $1,403.9M (+7%); Q2 alone $715.1M (+3%) |
| Magnite (sell side SSP) | $714.0M (+7%) | $668.2M | Contribution ex-TAC $669.6M (+10%); CTV 48% of revenue | $357.2M (+9%); Q2 alone $192.8M (+11%) |
| PubMatic (sell side SSP) | $282.9M (down 3%) | $291.3M | Net loss $14.5M; about 1,980 publishers | $141.2M (+4.6%); Q2 alone $78.6M (+10.5%) |
Sources: The Trade Desk 10-K and Q2 2026 10-Q; Magnite 10-K and 10-Q; PubMatic 10-K and 10-Q. PubMatic’s growth rates are our arithmetic.
How to read them:
- Gross spend vs revenue. The Trade Desk defines gross spend as client spend on its platform for inventory, data and services plus its platform fee. Revenue divided by gross spend was 21.6% in 2025 and 20.3% in 2024 (our arithmetic). That is a blended figure, not a contract rate.
- Gross spend is global. 85.5% of The Trade Desk’s 2025 revenue came from US clients ($2,476.7M), but gross spend is not split by country, so do not compare $13.4B with IAB’s US total.
- CTV carries the sell side. Magnite’s CTV Contribution ex-TAC grew 17% to $304.2M in 2025, against 7% for mobile and 2% for desktop. In H1 2026, CTV Contribution ex-TAC was up 33%.
- Buyer concentration is a real risk. PubMatic says its revenue fell partly because of about $14.2M of 2024 US political spend that did not repeat, and partly because of “platform changes implemented by one of our large DSP buyers” in the second half of 2024 and another in the second half of 2025. It names Google and The Trade Desk as two of its largest DSP relationships.
Choosing a programmatic revenue partner with detailed demand reporting
If you are a publisher picking an SSP, the filings tell you what reporting the big players already produce, which gives you a baseline to ask for:
| Ask for | Why, from the filings | Pass | Fail |
|---|---|---|---|
| Revenue by DSP, every month | PubMatic lost revenue twice in two years from single DSP platform changes | You can see each DSP’s share and catch a drop within a month | One blended “programmatic” line |
| Revenue by channel (CTV, mobile, desktop) | Magnite reports Contribution ex-TAC by channel to its own investors | Same split for your account | Channel totals only at the network level |
| Open auction vs deal revenue, by deal ID | IAB’s 61/39 split shows deals are a large share of programmatic revenue; PubMatic sells direct deals through Activate | Each PMP and preferred deal reported separately | Deals mixed into open auction totals |
| What drives bids on your inventory | The Trade Desk’s PubDesk gives publishers “detailed information on how buyers view their inventory and what drives bid pricing” | Your SSP shows bid rate and win price by buyer, or you use the DSP-side tool | No visibility past fill rate |
How much of each programmatic dollar reaches the publisher
Revenue tells you the size of the market. The audits below tell you how much of an advertiser’s dollar buys a real, viewable impression.
| Study (date) | Finding | Sample |
|---|---|---|
| ANA Programmatic Media Supply Chain Transparency Study (Dec 5, 2023) | “Only 36 percent of every dollar invested by an advertiser that enters a DSP effectively reaches the consumer”; $22B of efficiency gains possible in an $88B open web market; buyers used “40,000-plus” websites | 21 marketers, 12 supply chain companies (3 DSPs, 6 SSPs, 3 verification firms) |
| ANA first look, as reported by Digiday (June 19, 2023) | Made-for-advertising (MFA) sites took 15% of spend and 21% of impressions; average campaign ran on 44,000 websites | Same audit, phase one |
| ANA Programmatic Transparency Benchmark, Q1 2026 (May 27, 2026) | TrueAdSpend index 43.3%; MFA exposure 1.1%, up from 0.4% to 0.6% through 2025; top cohort turned 54.0% of spend into qualified impressions vs 32.1% for the bottom cohort | 86 participating marketers, 66 active contributors; built with TAG TrustNet and Fiducia |
| ANA benchmark, Q2 2026, per partner Fiducia (Aug 6, 2026) | TrueAdSpend 45.1%; CTV 41.6% of tracked spend; transaction costs 27.2%; non-viewable spend down from 13.3% to 10.1%; invalid traffic 0.1% | Log-level data from advertisers and platforms |
| ISBA/PwC UK study, as reported by Digiday (Jan 17, 2023) | 2020: publishers got “less than half (49%)” and a 15% “unknown delta” could not be traced. 2023: unknown delta down to 3%; impression match rate up from 12% to 58% | UK advertisers, agencies, DSPs, SSPs and publishers |
TrueAdSpend is the share of spend that reaches impressions that are measurable, viewable, fraud-free and not MFA. So the cleanest current answer to “how much reaches a quality impression” is about 45 cents per dollar (Q2 2026), up from the 36 cents the ANA measured in 2023. The methods differ, so read that as direction, not a precise gain. Fraud is covered in our digital ad fraud statistics.
Programmatic CPMs from named sources
These match the figures in our media buying guide. Check the vantage point column before you plan with any of them: buyers’ CPMs include ad tech fees, publishers’ CPMs do not.
| What was measured | CPM | Source and vantage point |
|---|---|---|
| Average programmatic CPM paid by advertisers | $4.42 (Q1 2026), down from $5.55 (Q4 2025) | ANA, buy side |
| TrueCPM (per thousand qualified impressions) | $7.46 top cohort; $19.04 bottom cohort (Q1 2026) | ANA, buy side |
| CPM and TrueCPM, Q2 2026 | Top cohort $7.90 CPM, $11.94 TrueCPM; bottom cohort $6.55 CPM, $13.80 TrueCPM | Fiducia, buy side |
| US programmatic, all formats | About $1.81 (June 2026), +51.0% YoY | DataBeat via PPC Land, publisher side; about $55M monthly revenue, 35B+ monthly impressions |
| US programmatic CTV | $5.74 (June 2026, down 12.3% YoY); $4.68 (April 2026) | DataBeat via PPC Land, publisher side |
| Premium CTV, negotiated | About $25 to $40; Netflix launched its ad tier at about $60 | Digiday, Sept 3, 2025 |
Note the Q2 2026 twist: the top cohort paid the higher raw CPM ($7.90 vs $6.55) but the lower TrueCPM ($11.94 vs $13.80). Cheap impressions cost more once you strip out the ones nobody could see.
What $10,000 of programmatic spend buys at ANA’s 2026 prices
- At the Q1 2026 average CPM of $4.42: $10,000 ÷ $4.42 × 1,000 = about 2,262,000 impressions.
- At the top cohort’s TrueCPM of $7.46: about 1,340,000 qualified impressions.
- At the bottom cohort’s TrueCPM of $19.04: about 525,000 qualified impressions.
Same budget, about 2.6 times more usable impressions for the better-run buyer. If you run programmatic for a small firm, our guide to programmatic advertising for SMBs covers minimums and setup. If you want a second opinion on your own supply path, you can book a consultation.
Which programmatic number to cite
| If you need to say | Use | Cite as | Do not use |
|---|---|---|---|
| US programmatic ad revenue, latest year | $162.4B in 2025, +20.5% | IAB/PwC Internet Advertising Revenue Report, Full Year 2025, April 16, 2026 | A vendor’s “programmatic spend” forecast in the same sentence |
| US programmatic ad revenue, 2024 | $134.8B, +18.0% | IAB/PwC Full Year 2024, April 2025, pages 6 and 20 | $114.2B (that is 2023) |
| Total US internet ad revenue, 2024 | $258.6B, +14.9% | IAB/PwC Full Year 2024, page 5 | $294.6B (that is 2025) |
| US search ad revenue, 2024 | $102.9B, 39.8% share | IAB/PwC Full Year 2024, page 16 | $114.2B (2025 search) or $88.8B (2023 search) |
| Programmatic share of US digital | 52.1% of all revenue (2024); 86.6% of non-search | Our arithmetic from IAB/PwC FY 2024, page 20 | Display-only forecast shares presented as all of digital |
| Open vs direct programmatic | 61% open RTB, 39% direct (2024) | IAB/PwC FY 2024, page 20 | The 70/30 split (that is 2014) |
| Ad tech’s cut | Trade Desk revenue 21.6% of gross spend (2025) | Our arithmetic from The Trade Desk 10-K | Calling it the DSP fee on every campaign |
| Waste in the supply chain | 45.1% TrueAdSpend (Q2 2026); 36 cents per dollar reached the consumer (2023) | ANA benchmark via Fiducia; ANA study, Dec 2023 | “36 cents reaches the publisher” (ANA said consumer) |
| Average programmatic CPM | $4.42 paid by advertisers (Q1 2026) | ANA Programmatic Transparency Benchmark, May 2026 | DataBeat’s $1.81 as an advertiser price (it is publisher side) |
Two more rules. IAB reports revenue earned by sellers; forecasters model spend by buyers, so the two never match. And keep CTV separate: our connected TV advertising statistics track CTV spend and prices by year.
Frequently asked questions
How much is US programmatic advertising revenue?
US programmatic advertising revenue was $162.4 billion in 2025, up 20.5% from $134.8 billion in 2024, per the IAB/PwC Internet Advertising Revenue Report. IAB counts revenue earned by sellers and excludes search, so the figure covers display, video, audio and social bought by machine. It is not additive to the $294.6 billion total, because programmatic overlaps the format categories.
What percentage of digital advertising is programmatic?
In the US, programmatic was 52.1% of all internet ad revenue in 2024 ($134.8 billion of $258.6 billion) and about 55.1% in 2025, using IAB/PwC figures. Leave out search, which IAB never counts as programmatic, and the 2024 share rises to 86.6% of the remaining $155.7 billion. Display-only forecasts run higher, above 90%, but measure something narrower.
What were the IAB 2024 figures for total and search ad revenue?
The IAB/PwC Full Year 2024 report, published April 2025, puts total US internet advertising revenue at $258.6 billion, up 14.9%. Search was $102.9 billion, up 15.9%, a 39.8% share. Display was $74.3 billion, digital video $62.1 billion, social $88.8 billion, retail media $53.7 billion and programmatic $134.8 billion. Search and format figures are on page 16 of the PDF; programmatic is on page 20.
How much US programmatic revenue is open RTB vs programmatic direct?
In 2024, 61% of US programmatic revenue came from open real-time bidding and 39% from programmatic direct: private marketplaces, preferred deals and automated guaranteed, per IAB/PwC. That is roughly $82.2 billion and $52.6 billion of the $134.8 billion total, by our arithmetic. The 2023 split was 63% to 37%, and IAB's 2014 study put open auctions near 70%.
How much of a programmatic ad dollar reaches the publisher?
The ANA's December 2023 study found only 36% of every dollar entering a DSP effectively reached the consumer. Its 2026 benchmark tracks TrueAdSpend, the share reaching measurable, viewable, fraud-free, non-MFA impressions: 43.3% in Q1 2026 and 45.1% in Q2 2026, per benchmark partner Fiducia. The UK ISBA/PwC study found publishers received 49% of spend in 2020.
What is the average programmatic CPM in 2026?
Advertisers in the ANA benchmark paid an average $4.42 CPM in Q1 2026, down from $5.55 in Q4 2025. Per thousand qualified impressions, the top cohort paid $7.46 and the bottom $19.04. On the publisher side, DataBeat's network averaged about $1.81 in June 2026, with programmatic CTV at $5.74. The gap includes ad tech fees and different samples.
How big is The Trade Desk's programmatic business?
The Trade Desk reported 2025 revenue of $2,896.3 million, up 18%, on gross spend of $13,394.7 million, up 11%, per its 10-K. Revenue was 21.6% of gross spend, a blended figure by our arithmetic, not a contract fee. In the first half of 2026 revenue grew 7% to $1,403.9 million, with second quarter growth slowing to 3%.