

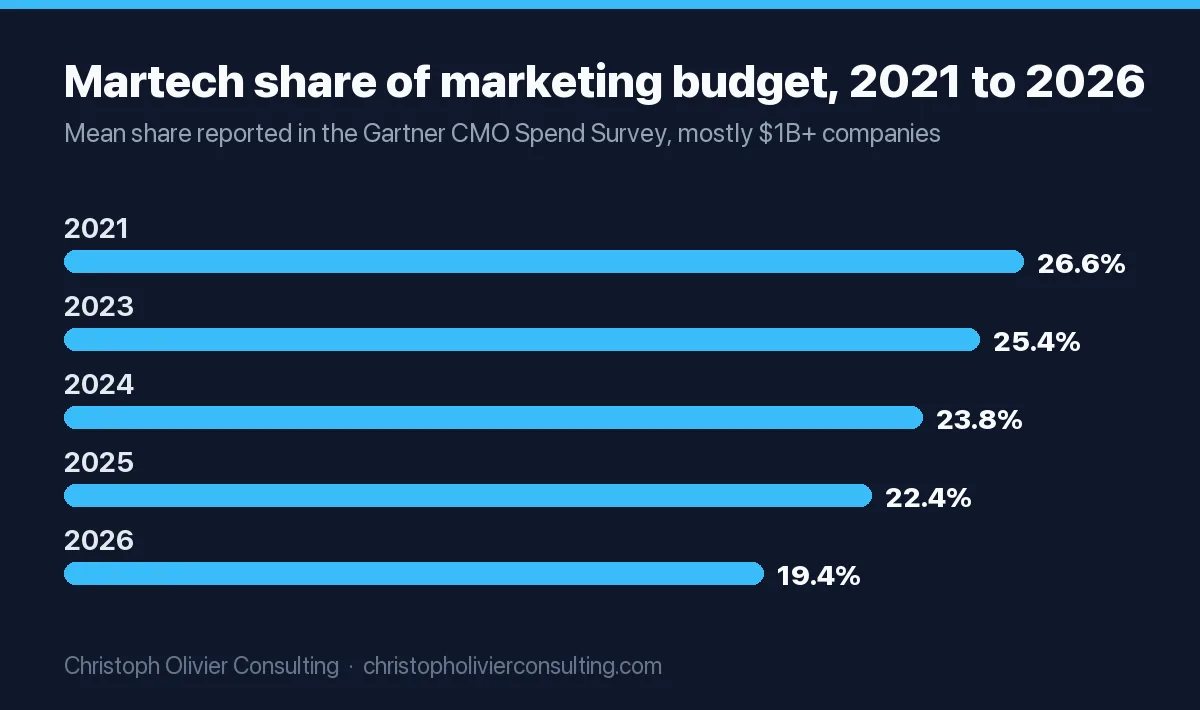
Marketing technology spend fell to 19.4% of the average marketing budget in 2026, a five-year low, according to Gartner’s 2026 CMO Spend Survey as reported by Chief Marketer. With marketing budgets at 7.8% of company revenue, that puts martech at roughly 1.5% of revenue for the large companies Gartner surveys. Meanwhile the 2026 Marketing Technology Landscape counts 15,505 products, up just 0.79%, the flattest year in its 15-year history.
Below: the five numbers people search for most, a year-by-year tool count, martech’s share of budget since 2021, what AI is doing to stacks, what a stack actually costs at three company sizes, and a stack-audit worksheet you can copy.
Martech statistics 2026: the five numbers people ask for
| Question | Latest number | Source and sample |
|---|---|---|
| How many martech tools exist? | 15,505 products in 2026 (15,384 in 2025) | chiefmartec and MartechTribe, Marketing Technology Landscape, May 2026 |
| What share of the marketing budget goes to martech? | 19.4% in 2026, down from 26.6% in 2021 | Gartner 2026 CMO Spend Survey, 401 CMOs, via Chief Marketer |
| How big are marketing budgets overall? | 7.8% of company revenue in 2026 (7.7% in 2025) | Gartner 2026 CMO Spend Survey press release |
| How much of the stack do marketers use? | 49% of martech capabilities; 15% of organizations are high performers | Gartner 2025 Marketing Technology Survey |
| How much goes to AI? | 15.3% of the marketing budget; 21.3% at AI-ready teams | Gartner 2026 CMO Spend Survey press release |
Gartner’s survey population matters when you use these numbers. The 2026 CMO Spend Survey ran January through March 2026 among 401 CMOs in North America, the UK and Europe, and the vast majority reported annual revenue above $1 billion. Treat the ratios as large-company benchmarks, not small-business rules. For the full budget split (paid media, labor, agencies) and how The CMO Survey compares, see our CMO and marketing budget statistics for 2026.
Marketing technology landscape 2026: how many tools exist
The Marketing Technology Landscape, often called the martech map, is the annual census of martech products run by Scott Brinker (chiefmartec) and Frans Riemersma (MartechTribe). The 2026 edition, published May 5, 2026, counts 15,505 products. Net growth was only 121 products, but that hides heavy churn: 1,488 products were added and 1,367 were removed. Brinker writes that the industry may have finally hit peak martech, or at least a plateau.
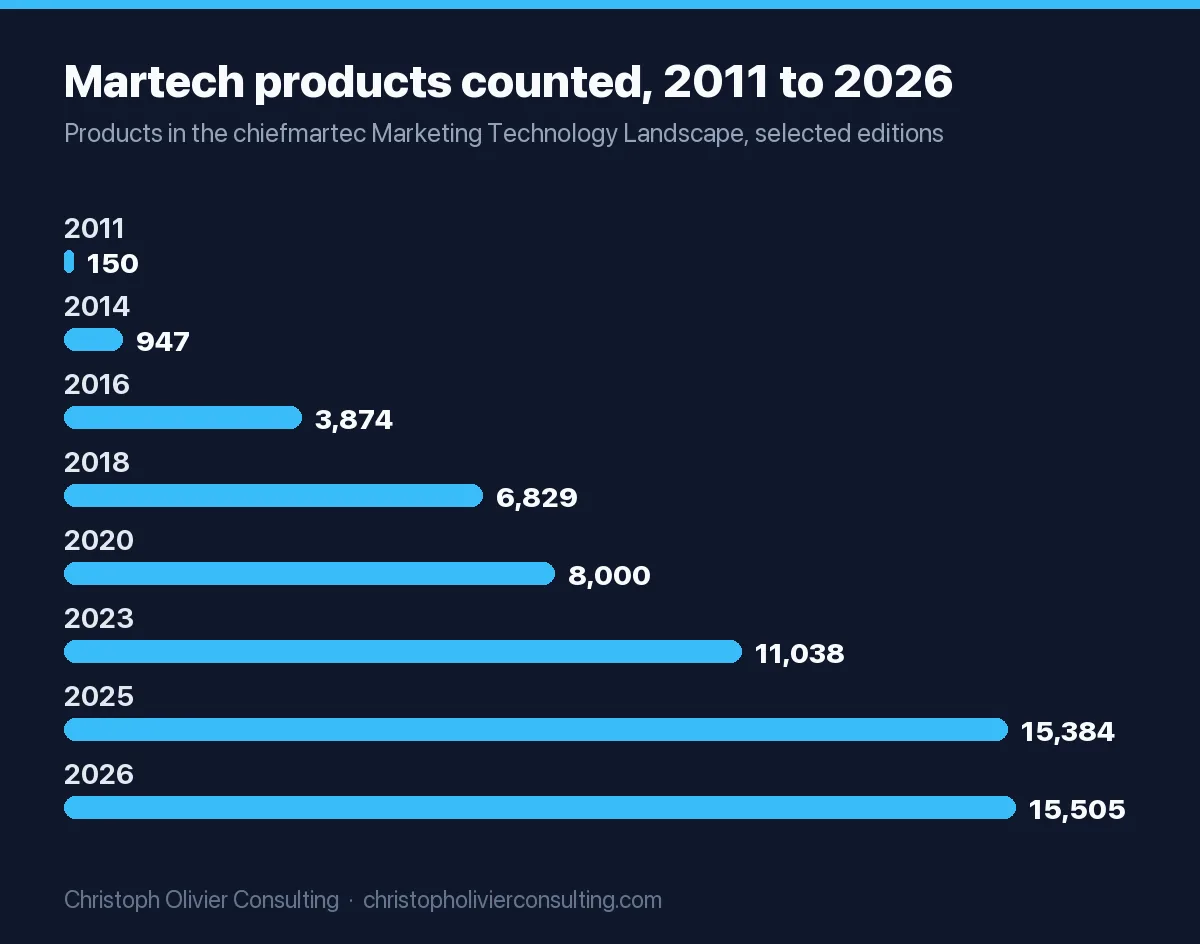
Here is the full count history from the State of Martech 2026 report (no edition was published in 2013 or 2021):
| Year | Products counted | Change vs previous edition |
|---|---|---|
| 2011 | 150 | First edition |
| 2012 | 350 | +133% |
| 2014 | 947 | +171% (two years) |
| 2015 | 1,876 | +98% |
| 2016 | 3,874 | +106% |
| 2017 | 5,381 | +39% |
| 2018 | 6,829 | +27% |
| 2019 | 7,040 | +3% |
| 2020 | 8,000 | +14% |
| 2022 | 9,932 | +24% (two years) |
| 2023 | 11,038 | +11% |
| 2024 | 14,106 | +28% |
| 2025 | 15,384 | +9% |
| 2026 | 15,505 | +0.79% |
Percent changes are our arithmetic from the published counts. The report puts total growth since 2011 at 10,236.7%, about 100X.
The flow underneath the flat headline, from the chiefmartec 2025 and 2026 announcements:
| Edition | Products added | Products removed | Net |
|---|---|---|---|
| 2025 | 2,489 | 1,211 | +1,278 |
| 2026 | 1,488 | 1,367 | +121 |
New entrants dropped 40% from 2025 to 2026, while exits rose 13%. Who left: 51.7% of 2026 removals came from the 2010 to 2019 SaaS cohort, 41.2% had 1 to 10 employees, and 45.5% had $1 million to $10 million in revenue. In the 2025 edition, the team evaluated 11,133 candidates and admitted 2,489, organized into 49 categories.
Which martech categories grew in 2026
The map groups products into six top-level categories: Advertising and Promotions, Content and Experience, Social and Relationships, Commerce and Sales, Data, and Management. The fastest-growing subcategories in 2026:
| Subcategory | 2026 growth | What it tells you |
|---|---|---|
| CMS and Web Experience Management | +21.4% (504 to 612) | Websites are being rebuilt for AI assistants and agents, not only humans and crawlers |
| Ecommerce Platforms and Carts | +19.9% (547 to 656) | Catalog data has to be machine-readable for AI-mediated product discovery |
| Mobile and Web Analytics | +11.3% | Growth after years of stagnation, as buyer research moves into AI assistants that web tracking cannot see |
| Call Analytics and Management | +8.9% | Same driver: capture signal where you still can |
| iPaaS, Data Integration and Tag Management | +8.0% | Integration doubles as the AI orchestration layer |
| Governance, Compliance and Privacy | +7.1% | New regulation plus new data-use questions created by AI |
| Marketing Automation and Campaign/Lead Management | +5.9% | A quiet comeback, credited partly to agentic campaign orchestration |
The shrinking one is Content Marketing. It nearly doubled from 575 tools in 2023 to 1,102 in 2025 on the first generative AI wave, then posted the largest net removal of any subcategory in 2026: 176 removed, 139 added. The report’s explanation is that ChatGPT, Claude, Gemini and incumbent suites absorbed the features those point tools sold.
Where to get the chiefmartec landscape and State of Martech report
Both are free and ungated. The State of Martech 2026 PDF runs 125 pages and covers the tool-count analysis plus a February 2026 survey of 208 marketing and marketing operations leaders on about 70 AI use cases. A clickable hi-res PDF of the graphic and the searchable version at MartechMap.com are linked from the chiefmartec 2026 announcement. If you searched for “state of martech 2025,” that edition (May 2025) reported the 15,384 count; the 2026 edition replaces it.
Marketing technology spend: martech budgets as a share of marketing, 2021 to 2026
Martech’s share of the marketing budget has fallen in every year Gartner has published since 2021. Gartner’s 2024 release called technology investment the lowest in a decade and attributed it to CMOs’ “diminishing influence over martech as other enterprise leaders, such as IT, take more control,” not to lower appetite for technology.
| Survey year | Martech, % of marketing budget | Marketing budget, % of company revenue | Martech, % of revenue (our math) | Source |
|---|---|---|---|---|
| 2021 | 26.6% | not used here | n/a | Gartner 2026 survey, via Chief Marketer |
| 2023 | 25.4% | 9.1% | 2.31% | Gartner 2023, via Marketing Dive |
| 2024 | 23.8% | 7.7% | 1.83% | Gartner 2024, via MarTech |
| 2025 | 22.4% | 7.7% | 1.72% | Gartner 2025, via Decision Marketing |
| 2026 | 19.4% | 7.8% | 1.51% | Gartner 2026, via Chief Marketer and Gartner |
The last column multiplies the two Gartner ratios (for 2026: 7.8% x 19.4% = 1.51%). It is an average for $1 billion-plus companies, so use it as a sanity check, not a target. Sample sizes: 410 CMOs in 2023, 395 in 2024, 402 in 2025 and 401 in 2026.
Two caveats before you quote the decline. First, a smaller percentage of a bigger budget can still be more dollars. Second, martech’s share fell while paid media rose to a five-year high of 31.4% in 2026, and labor rose from 21.9% to 24.5%. Money is moving to media and people, and AI spend (15.3% of budget) cuts across all of those lines.
Martech budgets are rising in intent, even as the share falls
In the same 2026 survey, 62% of CMOs said they plan to invest more in martech. Pricing is shifting under them: 56% increased the share of martech budget on consumption-based (usage-priced) tools in the past year, against 9% who reduced it. Half of organizations with consumption-based tools say they continually renegotiate contracts, 41% have set up or are setting up real-time usage controls, and 24% are overhauling systems to reduce usage. If your AI features bill by credits, tokens or contacts, budget for variance, not a flat line.
The Gartner marketing technology survey vs the CMO Spend Survey
People searching “Gartner marketing technology survey” often mean one of two different studies. The CMO Spend Survey (spring, about 400 CMOs) gives the budget shares above. The Marketing Technology Survey (summer, martech leaders) gives utilization and AI-agent findings. The 2025 Marketing Technology Survey covered 413 martech leaders, fielded June through August 2025, according to Gartner’s October 2025 release.
Martech utilization: how much of the stack actually gets used
Gartner’s martech research page states that the 2025 Marketing Technology Survey found utilization at 49%, and that “just 15% of organizations qualify as high performers,” defined as meeting strategic goals and showing positive ROI. The same page notes CMOs oversee nine marketing channels on average.
| Survey year | Share of martech capabilities used | Source |
|---|---|---|
| 2020 | 58% | Gartner, cited in 2023 release |
| 2022 | 42% | Gartner, cited in 2023 release |
| 2023 | 33% | Gartner, August 2023 (405 marketing leaders) |
| 2025 | 49% | Gartner 2025 Marketing Technology Survey |
Two details from the 2023 release are more useful than the headline. Organizations that use more than 50% of their stack were “significantly less likely” to be asked to cut their martech budget. And only 11% of respondents raised utilization by more than 10% in a year, so fixing it is slow. The top blockers were ecosystem complexity, customer data problems and inflexible governance. Utilization is self-reported and hard to measure as “percent of features.” Active seats per tool are easy to pull from any admin panel, which is why the worksheet below uses seats.
How AI is changing martech stacks
AI is now the main reason stacks change. The clearest numbers:
- Adoption by category jumped from 2024 to 2026 in the State of Martech survey (208 leaders, skewed toward tech and professional services firms, so read it as leading edge): Content and Experience 79% to 89%, Data 61% to 75%, Management 58% to 72%, Advertising and Promotions 30% to 50%, Commerce and Sales 28% to 49%, Social and Relationships 33% to 49%. No category declined.
- Policy caught up. 73% of those respondents have a formal generative AI policy, up from 52% in December 2024.
- Vendor AI agents are underdelivering for many. In Gartner’s 2025 survey of 413 martech leaders, 81% were piloting or running AI agents, yet 45% of those said vendor-offered agents do not meet expectations of promised business performance. Half said their technical and data stack is not ready for agents, and half cited a shortage of technical talent. Top pilot use cases: content production (52%), content enrichment (49%) and campaign optimization (43%).
- AI is mostly used for one-way blasts so far. Salesforce’s tenth State of Marketing report (4,450 marketing decision makers, fielded October 8 to November 17, 2025) found 75% of marketers have adopted AI, yet 84% admit to running generic campaigns. Only 58% have complete access to service data, 56% to sales data and 51% to commerce data. Marketers with unified data are 60% more likely to use AI agents.
- Budgets follow readiness. Gartner’s 2026 survey found 70% of CMOs call becoming an AI leader a critical goal, but only 30% report mature AI readiness.
The structural shift, per State of Martech 2026: stacks are “stratifying, not consolidating.” AI-native tools are winning creation tasks such as copy ideation, pitch decks and competitive intelligence, while incumbent platforms hold orchestration tasks such as lead scoring, deliverability and pipeline, where the data already lives. The report calls the deciding variable “data gravity.” For a CMO modernizing a stack, the practical reading is to keep systems of record on the platform, test AI-native tools at the creative edge, and fix data access before buying agents. Our AI in marketing statistics page goes deeper on adoption and productivity numbers.
Martech replacement: which tools companies swap, and why
The 2025 MarTech Replacement Survey (207 marketers, fielded Q4 2025) shows replacement slowing sharply while stacks keep growing.
| Metric | Earlier | 2025 survey |
|---|---|---|
| Replaced a martech application in the past year | 69.8% (2022 peak) | 59.9% |
| Marketing automation replaced | 31.1% (2024) | 19.4% |
| Email platform replaced | 24.3% (2024) | 13.7% |
| CRM replaced | 22.1% (2024) | 9.7%, lowest in survey history |
| Cited cost reduction as a reason | 23.0% (2024) | 43.8% |
| Replaced a commercial tool with a homegrown one | 3.4% (2024) | 8.1% (2.1% built with AI) |
| Cited AI capabilities as important | n/a | 37.1% |
Sources: MarTech, April 2026; MarTech, March 2026. SEO tools overtook marketing automation as the most-replaced category, ending a five-year run. Among replacers, 62.9% added applications, 22.6% shrank their stack and 14.5% stayed flat, and 35.5% of replacements took more than six months to decide. As MarTech put it, replacement has become harder to justify, not harder to execute. That is the case for auditing what you have before swapping it.
How much should a martech stack cost?
There are two honest ways to answer: top down from budget ratios, and bottom up from the price of the core platform, which is usually the biggest single license. Run both and compare.
Top down. Martech budget = revenue x marketing budget % x martech share. With Gartner’s 2026 averages: a $1 billion company x 7.8% = $78 million marketing budget, x 19.4% = about $15.1 million on martech. A $50 million company using the same ratios lands at $3.9 million in marketing and about $757,000 in martech. Smaller firms usually spend a lower share on tools because one platform covers most needs, so treat the ratio as a ceiling below enterprise scale.
Bottom up. List prices for two common core platforms, checked on the vendors’ US pricing pages:
| Company size | Typical core platform | List price | Year-one platform cost |
|---|---|---|---|
| SMB | HubSpot Marketing Hub Starter | $20 per seat per month (new-customer promos from $7), 1,000 marketing contacts | 3 seats: $720 at list |
| Mid-size | HubSpot Marketing Hub Professional | $800 to $890 per month depending on commitment, 3 core seats, 2,000 contacts, $3,000 one-time onboarding | $12,600 to $13,680 |
| Mid-size B2B | Salesforce Marketing Cloud Account Engagement Growth+ | $1,250 per org per month, billed annually, 10,000 contacts | $15,000 |
| Enterprise | HubSpot Marketing Hub Enterprise | $3,600 per month, 5 core seats, 10,000 contacts, $7,000 one-time onboarding | $50,200 |
| Enterprise B2B | Account Engagement Advanced+ / Premium+ | $4,400 / $15,000 per org per month, billed annually | $52,800 / $180,000 |
Then add the layers around the platform: CRM seats if separate, analytics, SEO, content and design tools, data and integration, plus usage-priced AI. My view: the platform is the line people budget for, and the add-ons are the line that grows unnoticed, which is why the worksheet below starts with an inventory. Contact tiers move these prices fast, so price your real database size, not the entry tier. If you are building from scratch, our guide on how to build a marketing technology stack walks through what to buy first, and choosing a marketing automation platform covers the core-platform decision.
Martech stack audit worksheet (copy this)
Gartner’s research page calls martech audits essential to “identify underused tools.” Here is a worksheet built on the numbers above. One row per tool. Pull seat activity from each tool’s admin panel for the last 30 days, and contract terms from your finance system.
| Column | What to enter | Example |
|---|---|---|
| Tool and owner | Product name, the person accountable | Webinar platform, demand gen lead |
| Category | One of the six martech map categories: Advertising, Content, Social, Commerce and Sales, Data, Management | Content and Experience |
| Annual cost | License + onboarding amortized + usage overage last 12 months | $9,600 |
| Pricing model | Seat, contact tier, or consumption | Seat |
| Seats paid / seats active (30 days) | Count both; divide | 10 / 4 = 40% |
| Overlap | Does your CRM, MAP or AI assistant already do this job? | Yes, MAP has webinar integration |
| System of record? | Does other data or automation depend on it? | No |
| Renewal date and notice period | From the contract | March 1, 60 days |
| Cost per active user | Annual cost / active seats | $9,600 / 4 = $2,400 |
| Verdict | Apply the rules below | Cut or consolidate |
Pass/fail rules. These thresholds are mine, anchored to Gartner’s finding that teams above 50% utilization are far less likely to face cuts:
- Keep if active seats are 80% or more, or the tool is a system of record.
- Renegotiate if active seats are 50% to 79%: drop unused seats at renewal, or move to a lower contact tier.
- Cut or consolidate if active seats are under 50% and the tool is not a system of record, or if the overlap column says yes.
- Cap any consumption-priced tool: set a monthly usage alert at 80% of budget, the same kind of control 41% of Gartner’s 2026 respondents are building.
- Calendar every renewal notice date 90 days out, so the verdict happens before auto-renewal, not after.
Worked example: a stack with $150,000 in annual tool spend and 49% utilization, the Gartner 2025 average, has roughly $76,500 tied to capability nobody uses ($150,000 x 51%). That is illustrative math, not a measured waste figure, but it tells you the order of magnitude an audit is chasing. If you want a second set of eyes on the results, you can book a consultation.
Martech market size: why estimates disagree
There is no agreed martech market size, because research firms define it differently; some count only marketing software and others fold in advertising and data spend. As one example, Precedence Research values the global market at $557.94 billion in 2025 and $669.14 billion in 2026, forecasting about $3.29 trillion by 2035 (19.4% CAGR). Other firms publish figures far apart from that. For planning a budget, the Gartner ratios and vendor prices above are more useful than any market total.
Frequently asked questions
How much do companies spend on marketing technology?
Large companies put 19.4% of their marketing budget into martech in 2026, down from 26.6% in 2021, according to Gartner's 2026 CMO Spend Survey of 401 CMOs. Marketing budgets averaged 7.8% of revenue, so martech works out to roughly 1.5% of revenue. Most respondents had revenue above $1 billion, so smaller firms usually spend less in absolute terms and often a lower share.
How many tools are on the marketing technology landscape in 2026?
The 2026 Marketing Technology Landscape from chiefmartec and MartechTribe counts 15,505 products, up 121 or 0.79% from 15,384 in 2025. It was the flattest year since the first edition listed about 150 tools in 2011. Underneath, 1,488 products were added and 1,367 removed, so the market is churning rather than standing still.
Is the State of Martech report free, and does chiefmartec publish research reports?
Yes. Scott Brinker and Frans Riemersma publish the State of Martech report free and ungated each May alongside the landscape. The 2026 edition is a 125-page PDF covering the tool count, category growth, exits and a February 2026 survey of 208 marketing leaders on about 70 AI use cases. The landscape itself is searchable at MartechMap.com.
What did the Gartner 2025 marketing technology survey find about martech utilization?
Gartner's 2025 Marketing Technology Survey found marketers use 49% of their martech stack's capabilities, and only 15% of organizations qualify as high performers that meet strategic goals with positive ROI. Earlier Gartner readings were 58% in 2020, 42% in 2022 and 33% in 2023. Gartner's 2023 release also found teams using over half their stack were less likely to face budget cuts.
How much should a martech stack cost for a mid-size business?
Start with the core platform. HubSpot Marketing Hub Professional lists at $800 to $890 a month with three core seats plus a $3,000 onboarding fee, about $12,600 to $13,680 in year one. Salesforce Account Engagement Growth+ is $1,250 a month billed annually, or $15,000 a year. Add CRM, analytics, SEO, content and usage-priced AI tools on top, and price your real contact count.
How much should a martech stack cost for an enterprise business?
Use Gartner's ratios as a check: marketing at 7.8% of revenue and martech at 19.4% of that means a $1 billion company averages about $15.1 million on martech. Core platform list prices alone run from HubSpot Marketing Hub Enterprise at $3,600 a month plus $7,000 onboarding to Salesforce Account Engagement Premium+ at $15,000 a month billed annually.
How do you reduce martech stack costs in 2026?
Audit before you replace. List every tool with annual cost, paid versus active seats, overlap with your CRM or automation platform, and renewal notice dates. Keep tools above 80% active seats or that hold system-of-record data, renegotiate between 50% and 79%, and cut or consolidate below 50%. Put usage alerts on consumption-priced AI tools, since 56% of CMOs shifted budget to that pricing model.
More CO Consulting marketing research
- AI in Marketing Statistics 2026: Verified Adoption, Budget, and Productivity Data From McKinsey, Gartner, The CMO Survey, HubSpot, and Salesforce
- E-commerce Statistics 2026: 32 Verified Data Points on US Online Retail
- 42 Small Business Marketing Statistics and Data Points for 2026
- AI Search and GEO Statistics for 2026: How People Use AI Search and How Engines Cite Sources
- 37 Page Speed and Core Web Vitals Statistics for 2026
- FTC Advertising and Endorsement Enforcement: 12 Compliance Statistics for 2026
- Marketing Cost & CAC Benchmark by Industry 2026: The True Cost Per Acquired Client
B2B & marketing-strategy research
More Marketing Research guides
- 27 Local SEO and Google Business Profile Statistics and Data Points for 2026
- 31 Online Reviews and Reputation Statistics for 2026
- 37 Page Speed and Core Web Vitals Statistics for 2026
- Podcast and Audio Advertising Statistics for 2026: 27 Verified Data Points
- 52 SEO Statistics and Data Points for 2026: Search Share, Zero-Click, and the AI Overviews Shift
- 42 Small Business Marketing Statistics and Data Points for 2026
- All Marketing Research guides →