

The SMS text marketing statistics that hold up in November 2026 are these: 91% of U.S. adults own a smartphone, Americans exchanged nearly 2.2 trillion SMS and MMS messages in 2024, 84% to 89% of surveyed consumers say they are opted in to business texts, and ecommerce SMS campaigns average a 5.6% to 12.4% click rate with orders on well under 1% of messages sent. The two numbers you see everywhere, a 98% open rate and 90% read within three minutes, trace back to a 2010 white paper whose own publisher now says they no longer reflect reality. Every figure below carries its source, sample, date and method, and the 2022 numbers sit in their own labeled section so you can compare then and now.
SMS text marketing statistics at a glance (2026)
Read the method column before you quote anything. “Probability survey” means the sample represents U.S. adults. “Vendor survey” means a texting company paid for an online panel. “Platform data” means measured sends from one vendor’s customers, mostly ecommerce brands.
| Statistic | Number | Source | Sample | Date | Method |
|---|---|---|---|---|---|
| U.S. adults who own a smartphone | 91% (98% own any cellphone) | Pew Research Center Mobile Fact Sheet | 5,511 U.S. adults | Jan 30 to Jun 18, 2026 | Probability survey, online, mail or phone, margin of error 1.8 points |
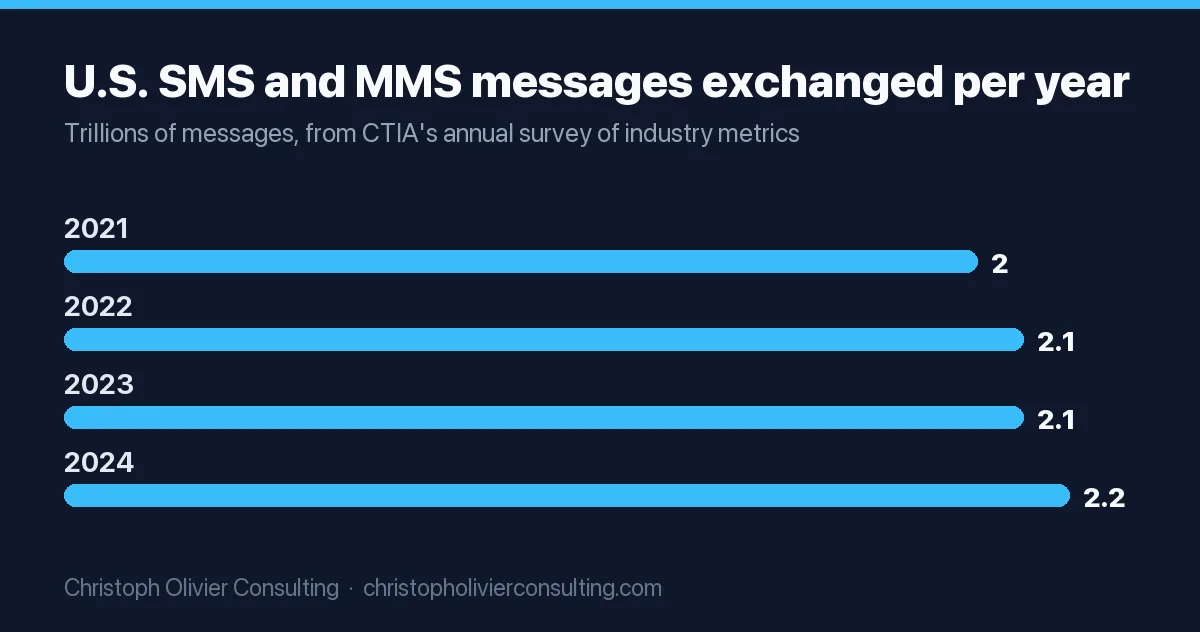
| SMS and MMS messages exchanged in the U.S. | Nearly 2.2 trillion in 2024, 42 billion more than 2023 | CTIA 2025 Annual Survey Highlights | U.S. wireless industry totals | Calendar 2024, published Sep 2025 | Trade association’s annual survey of industry metrics |
| Consumers opted in to texts from businesses | 85.6% | SimpleTexting 2026 report | 1,000 U.S. consumers | Jan 7 to 8, 2026 | Vendor survey, panel not named |
| Consumers who have signed up for texts from a business | 89%, up from 66% five years earlier | EZ Texting 2026 Consumer Texting Behavior Report | 959 U.S. mobile phone owners | Jan 20 to 23, 2026 | Vendor survey, independent online panel |
| Consumers who check a new text within 15 minutes | 87% (32% immediately) | EZ Texting 2026 | 959 | Jan 2026 | Vendor survey, self-reported |
| Businesses using SMS marketing | 75.3%; 65.4% plan to raise texting budgets | SimpleTexting 2026 | 400 U.S. business owners and digital marketing managers | Jan 7 to 8, 2026 | Vendor survey, self-reported |
| Ecommerce SMS campaign click rate | 5.6% campaigns, 9.65% flows | Klaviyo 2026 SMS benchmarks | 183,000+ Klaviyo customers | 2026 edition, data window not stated | Platform data |
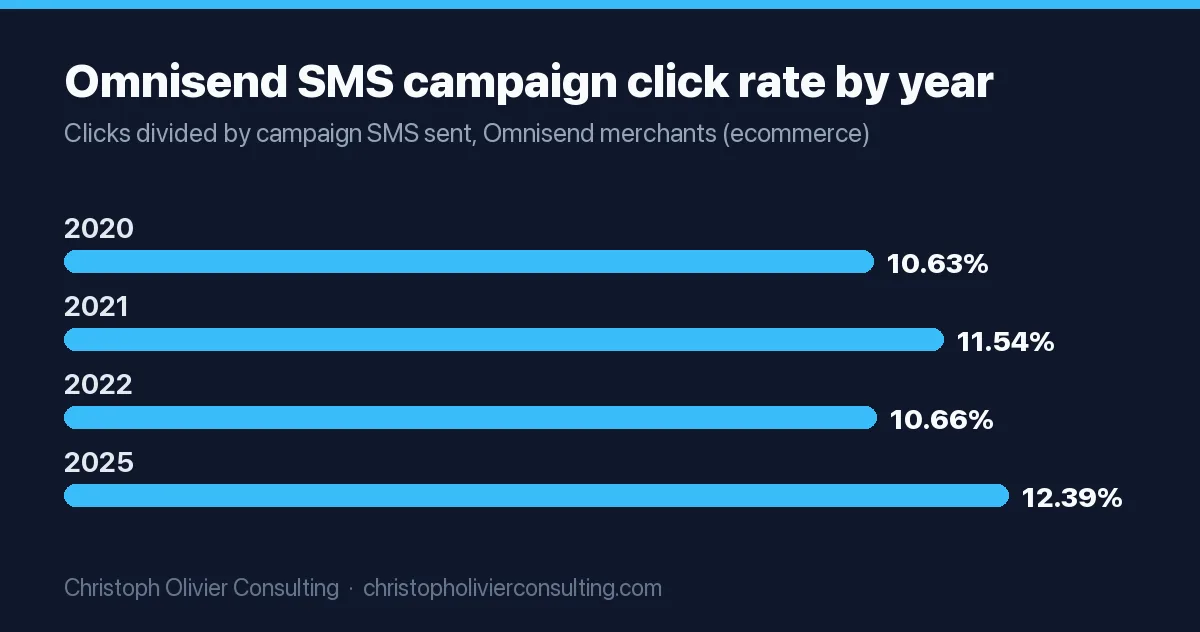
| Ecommerce SMS campaign click rate | 12.39%; conversion 0.12%; $0.15 revenue per SMS | Omnisend SMS benchmarks | 246M+ campaign sends, 27,000+ brands | Calendar 2025, published Jun 11, 2026 | Platform data |
| SMS revenue per message, median store | $0.98 (75th percentile $2.13, 90th $4.54) | Postscript 2026 benchmarks | 17,000+ Shopify stores | Jan 1 to Dec 15, 2025 | Platform data: attributed SMS revenue divided by messages sent, last 30 days |
| Share of SMS revenue from automated flows | 45.2% of revenue from 7.6% of sends | Klaviyo 2026 | 183,000+ customers | 2026 edition | Platform data, Klaviyo attribution |
Where the “98% open rate” and “90% read within 3 minutes” come from
Both numbers have one origin. In a post on its own site, the UK research firm mobileSQUARED writes that its 2010 white paper “Conversational Advertising” found “98% of all SMS messages were read” and “90% of all SMS messages were read within 3 minutes.” In the same post, mobileSQUARED says “neither datapoints represent an accurate reflection of today’s world of mobile messaging” and that its latest data suggests 55% of SMS are read, while 100% are viewed. The post gives no sample size or method for either the 2010 or the newer figure.
From there the numbers spread. A 2015 VentureBeat partner piece sponsored by Nexmo repeated that “more than 90 percent of people read a text message within the first three minutes,” citing mobileSQUARED. On November 3, 2016, a Gartner article by contributor Chris Pemberton wrote that “various sources report SMS open and response rates as high as 98% and 45%, respectively,” against 20% and 6% for email. Gartner did not run a study. It summarized unnamed sources, and that sentence is why so many blogs now write “according to Gartner.”
There is also a measurement problem. An SMS has no tracking pixel, so nobody can measure an “open.” Twilio’s status documentation says a message can reach a “read” status only on channels with read receipts, and names RCS and WhatsApp. A plain SMS stops at “delivered.” Any SMS “open rate” is a delivery rate or a survey answer, not a count of opens.
| Viral claim | Earliest source found | Sample and method disclosed? | Status in 2026 | Honest way to cite it |
|---|---|---|---|---|
| 98% of texts are read (or “opened”) | mobileSQUARED white paper, 2010 | No | Publisher says outdated; its newer figure is 55% read | “A 2010 mobileSQUARED estimate, since withdrawn by its author” |
| 90% of texts are read within 3 minutes | mobileSQUARED white paper, 2010 | No | Publisher says outdated | Use a current survey instead: 74% check within five minutes (SimpleTexting, 2026) or 87% within 15 minutes (EZ Texting, 2026) |
| SMS open rate 98%, response rate 45% (vs email 20% and 6%) | Gartner article, Nov 3, 2016 | No, Gartner cites “various sources” | Ten years old, secondhand | “Gartner (2016), summarizing unnamed sources” |
| SMS click rate 10.66% (often quoted with no year) | Omnisend 2023 yearly stats report | Yes: 107 million SMS sent by Omnisend merchants in 2022, clicks divided by messages sent | Omnisend’s 2025 figure is 12.39% | “Omnisend campaign click rate, 2022 data” |
SMS marketing statistics 2022: the numbers as originally published
If you searched for 2022 figures, these are the originals, quoted as their publishers released them. They are historical. Use them for trend lines and before-and-after comparisons, not as current benchmarks.
| 2022-era statistic | Number | Source | Sample | Date | Method |
|---|---|---|---|---|---|
| U.S. adults who own a smartphone | 85% | Pew, Mobile Technology and Home Broadband 2021 | 1,502 U.S. adults | Jan 25 to Feb 8, 2021 | Probability survey by cellphone and landline |
| Text messages exchanged in the U.S. | More than 2.1 trillion in 2022, 6% more than 2021 | CTIA 2023 Annual Survey Highlights | U.S. wireless industry totals | Calendar 2022 | Annual survey of industry metrics |
| Consumers subscribed to SMS marketing | 70%, up from 62% in 2021 | SimpleTexting 2022 report | 813 U.S. consumers | Apr 12 to 13, 2022 | Vendor survey |
| Consumers who check a text within one minute | 1 in 3; 85% within 1 to 5 minutes; Gen Z 44% within one minute | SimpleTexting 2022 | 813 consumers | Apr 2022 | Vendor survey, self-reported |
| Businesses texting customers | 55%, up from 42% in 2021; 60% planned to raise SMS budgets | SimpleTexting 2022 | 501 business owners and marketing managers | Apr 12 to 15, 2022 | Vendor survey |
| Business-reported SMS click rate | Majority said 20% to 35% | SimpleTexting 2022 | 501 | Apr 2022 | Self-reported, not measured |
| Consumers subscribed to texts from at least one brand | 81%; 63% of subscribers bought from a text in the last three months | Attentive, State of Conversational Commerce in 2022 | 5,000+ responses | Released Mar 16, 2022 | Vendor survey, geography not stated |
| Ecommerce SMS campaign sends | Up 62.3% on 2021, nearly 100 million campaign SMS | Omnisend 2023 yearly stats report | 107 million SMS from Omnisend merchants | Calendar 2022 | Platform data |
| Ecommerce SMS campaign click and conversion rate | 10.66% click, 0.19% conversion; orders up 23.8% | Omnisend 2023 report | Same | 2022 | Clicks or attributed orders divided by messages sent |
| Automated SMS | Sends down 21%, orders up more than 600% | Omnisend 2023 report | Same | 2022 | Platform data |
2022 vs 2026: what actually changed
Only compare a 2022 number with a later one from the same publisher. Different vendors ask different questions.
| Metric (same source both years) | 2022 era | Latest | Change |
|---|---|---|---|
| Smartphone ownership, U.S. adults (Pew) | 85% (2021) | 91% (2026) | +6 points |
| SMS and MMS messages per year (CTIA) | More than 2.1 trillion (2022) | Nearly 2.2 trillion (2024) | Roughly flat to slightly up |
| Consumers opted in (SimpleTexting) | 70% | 85.6% (Jan 2026) | +15.6 points |
| Businesses using SMS (SimpleTexting) | 55% | 75.3% (Jan 2026) | +20.3 points |
| Check texts within one minute (SimpleTexting) | 1 in 3 | 23% (Jan 2026) | Down about 10 points |
| Campaign click rate (Omnisend) | 10.66% | 12.39% (2025) | +1.73 points |
| Campaign conversion per message (Omnisend) | 0.19% | 0.12% (2025) | Down 0.07 points |
The pattern: more people opted in, more businesses texting, and less immediate attention per message. Omnisend’s conversion per message fell while clicks rose, which is what you would expect when more brands send more texts to the same phones. Notice too that businesses in SimpleTexting’s surveys report click rates of 20% or more (66.2% said so in 2026), while measured platform data puts campaign click rates at 5.6% (Klaviyo) to 12.39% (Omnisend). Self-reported and measured numbers are not the same statistic.
SMS usage statistics: how much Americans text
CTIA, the U.S. wireless industry association, publishes a national text-message count in its annual survey. Its highlights reports put total SMS and MMS traffic at 2.0 trillion in 2021, more than 2.1 trillion in 2022, more than 2.1 trillion in 2023 (“more than 67,000 messages every second”) and nearly 2.2 trillion in 2024. That is about 6 billion messages a day (2.2 trillion divided by 365). CTIA’s 2026 highlights report, published in September 2026, leads with data use and does not restate a text total, so 2024 is the latest year with a published count.
For behavior per person, Pew’s dedicated texting survey is old, but it measured a probability sample of adults rather than an opt-in panel. In April and May 2011 (2,277 adults, phone survey), 73% of cell owners sent and received texts, the median texter exchanged 10 a day and the mean was 41.5. Adults 18 to 24 averaged 109.5 a day with a median of 50. Treat those as a 2011 baseline, not a 2026 measurement.
SMS mobile marketing statistics by age
Reach is no longer the constraint for any age group under 65. Pew’s 2026 survey puts smartphone ownership at 97% for adults 18 to 29, 97% for 30 to 49, 91% for 50 to 64 and 79% for 65 and older. Basic SMS works on any cellphone, and 98% of adults own one. App, mobile search and mobile commerce figures are tracked in our mobile marketing statistics.
Ecommerce SMS marketing statistics: clicks, orders and revenue
Three platforms publish measured SMS data from their customers, and all three customer bases are mostly online stores. Their numbers differ mainly because each one divides by something different.
| Metric | Klaviyo 2026 | Omnisend (2025 data) | Postscript (2025 data) |
|---|---|---|---|
| Dataset | 183,000+ customers | 246M+ campaign and 20M+ automation sends, 27,000+ brands | 17,000+ Shopify stores, Jan 1 to Dec 15, 2025 |
| Campaign click rate | 5.6% (top 10%: 10.44%) | 12.39% | Not published as one figure |
| Automated flow click rate | 9.65% (top 10%: 16.6%) | 20.34% | Back-in-stock: 36% to 58% |
| Campaign conversion | 0.27% order rate (top 10%: 0.61%) | 0.12% | Not published |
| Flow conversion | 1.9% (top 10%: 3.92%) | 0.78% | Back-in-stock: 7% to 13.8% |
| Revenue per message | Campaign RPR $0.26 to $0.36 by industry; flows about 8 times campaigns | $0.15 campaigns, $0.75 automations | Median $0.98 across all messages |
| Other | Flows: 7.6% of sends, 45.2% of SMS revenue; 64.4% of flow revenue from new buyers | Deliverability 96.6% campaigns, 92.8% automations | Median 30-day subscriber retention 93.1%; median 1.91 texts per subscriber per month |
Omnisend’s monthly 2025 figures show why click rate alone misleads. Campaign click rate climbed from 3.47% in January to 23.92% in December, while conversion stayed between 0.10% and 0.14% all year. Holiday traffic inflates clicks far more than it inflates orders. Judge an SMS program on revenue per message, and compare it with the same month last year.
SMS revenue per recipient by industry (Klaviyo 2026)
| Industry | SMS campaigns | SMS flows | Flow multiple |
|---|---|---|---|
| Automotive | $0.35 | $6.15 | 17.6x |
| Hardware and home improvement | $0.26 | $4.57 | 17.6x |
| Home and garden | $0.32 | $3.74 | 11.7x |
| Electronics | $0.28 | $3.48 | 12.4x |
| Sporting goods | $0.34 | $3.30 | 9.7x |
| Jewelry | $0.31 | $2.85 | 9.2x |
| Toys and hobbies | $0.28 | $2.82 | 10.1x |
| Miscellaneous ecommerce | $0.36 | $2.52 | 7.0x |
| Clothing and accessories | $0.32 | $2.31 | 7.2x |
| Specialty | $0.31 | $2.21 | 7.1x |
| Health and beauty | $0.32 | $2.09 | 6.5x |
| Food and beverage | $0.34 | $1.83 | 5.4x |
Campaign revenue per recipient barely moves across industries ($0.26 to $0.36). Flow revenue ranges more than threefold, from $1.83 in food and beverage to $6.15 in automotive. The flow multiple column is our division of Klaviyo’s two figures. If you sit in one of the top rows, the abandoned cart and browse flows are where SMS earns its keep, and a campaign calendar matters less. Our marketing automation statistics cover the same flow-versus-blast pattern across channels.
SMS vs email marketing statistics from the same brands
Most “SMS vs email” comparisons pair one vendor’s SMS number with another vendor’s email number. Omnisend’s 2025 dataset covers both channels across the same brand base, which makes it the cleanest comparison published.
| Omnisend 2025 | SMS | Winner | |
|---|---|---|---|
| Campaign click rate | 12.39% | 0.74% | SMS, about 17 times higher |
| Campaign conversion rate | 0.12% | 0.08% | SMS, slightly |
| Automation click rate | 20.34% | 4.66% | SMS |
| Automation conversion rate | 0.78% | 1.49% | Email, about 2 times higher |
| Automation revenue per message | $0.75 | $3.41 |
SMS wins attention. Email automations win conversion and revenue per message. The practical reading: run email as the base of every flow and add an SMS step at the moments where speed matters, such as cart abandonment or a back-in-stock alert. Our email marketing benchmarks break down the email side by industry.
Gen Z SMS marketing statistics
All Gen Z texting data comes from SimpleTexting’s vendor surveys, so read it as directional.
| Gen Z statistic | Number | Survey |
|---|---|---|
| Opted in to texts from businesses | 93%, the highest of any generation | SimpleTexting, 1,000 consumers, Jan 2026 |
| Text every day | 88% (82% of all consumers) | SimpleTexting, Jan 2026 |
| Prefer texting for customer support | 37% | SimpleTexting, Jan 2026 |
| Check texts within five minutes | 90% (82% of all consumers) | SimpleTexting 2025 report, 1,000 consumers, Dec 23 to 26, 2024 |
| Check text notifications within one minute | 44% | SimpleTexting, 813 consumers, Apr 2022 |
| Likely to use text-to-buy | 20% | SimpleTexting, Apr 2022 |
Pew’s 2026 data puts smartphone ownership at 97% for adults 18 to 29, so Gen Z reach is a given. The useful number is the support preference: when more than a third would rather text than call, a two-way number that a person actually answers matters more than another promotion.
Opt-in, opt-out and frequency numbers
Why people opt in. In SimpleTexting’s January 2026 survey the top reasons were appointment and reservation reminders (76%), shipment tracking (61%), promotions and sale alerts (59%), loyalty updates (46%) and customer service (40%). EZ Texting’s January 2026 survey, worded differently, ranked discount offers (56%), delivery updates (50%) and appointment reminders (42%) as the strongest drivers. EZ Texting also found 67% are more likely to buy from a business whose texts they subscribe to.
How often to text. 50% of SimpleTexting’s respondents prefer a text every other week and 37% once a week. Postscript’s measured cadence shows the median store sends 1.91 texts per subscriber per month, the 75th percentile 3.84 and the 90th percentile 6.65.
Why people leave. Frequency is the top reason in both surveys: 55% in SimpleTexting’s 2026 data (53% in its 2025 report) and 40% in EZ Texting’s. In SimpleTexting’s business survey, the largest group (30%) reports unsubscribe rates of 1% to 2%. Postscript’s median store keeps 93.1% of new subscribers after 30 days.
The planning rule these numbers support: two to four texts a month is where both consumer preference and the median store sit. Go above that only with flows that respond to something the customer just did.
What the benchmarks predict for a 5,000-subscriber text
Here is the same send, one campaign text to 5,000 subscribers, run through each published benchmark. Each text is assumed to fit in one segment.
| Benchmark | Rate | Math | Predicted result |
|---|---|---|---|
| Klaviyo campaign click rate | 5.6% | 5,000 x 0.056 | 280 clicks |
| Klaviyo campaign order rate | 0.27% | 5,000 x 0.0027 | 13 to 14 orders |
| Klaviyo campaign RPR, health and beauty | $0.32 | 5,000 x $0.32 | $1,600 |
| Omnisend campaign click rate | 12.39% | 5,000 x 0.1239 | About 620 clicks |
| Omnisend campaign conversion | 0.12% | 5,000 x 0.0012 | 6 orders |
| Omnisend revenue per campaign SMS | $0.15 | 5,000 x $0.15 | $750 |
| Postscript median revenue per message | $0.98 | 5,000 x $0.98 | $4,900, but this blends flow revenue into all messages, so it overstates a single campaign |
Cost side, on Twilio’s published U.S. rates (“pricing current as of October 2026”): 5,000 x $0.0083 = $41.50 in message fees, plus carrier fees of $17.50 if every recipient is on AT&T ($0.0035 each) up to $25.00 if all are on Verizon ($0.005). Delivery cost: $59.00 to $66.50, before your monthly campaign fee and platform subscription. That is $0.0118 to $0.0133 per text, so even Omnisend’s conservative $0.15 revenue per SMS is 11 to 13 times delivery cost. Revenue, not profit: subtract product cost and discounts before you call it ROI.
The spread, $750 to $1,600 for the same campaign depending on whose benchmark you use, is the honest answer to “what should SMS make us.” Benchmark against your own last 90 days first. Use the published numbers only to see whether you sit near the median or far below it. Per-text prices for ten tools, Klaviyo and Postscript included, are in our comparison of SMS marketing platforms with 2026 prices.
The consent rules and carrier fees behind every number (November 2026)
Every opt-in and engagement rate above assumes a legal, registered program. The rules changed twice in 2025 and change again on November 25, 2026.
| Rule or fee | What it says | Status and date | Source |
|---|---|---|---|
| Revocation of consent (current text) | Consumers may revoke by any reasonable method. Replies of “stop,” “quit,” “end,” “revoke,” “opt out,” “cancel” or “unsubscribe” count per se. Revocations must be honored within ten business days. | In force since April 11, 2025, except the “revoke-all” piece, which the FCC delayed by waiver (DA 26-12) | 47 CFR 64.1200(a)(10), eCFR as of Oct 29, 2026 |
| New revocation rule | Senders may treat a revocation as applying only to the category of informational messages it was aimed at, and may designate an exclusive means to revoke consent | Published Oct 26, 2026; effective Nov 25, 2026, replacing the delayed revoke-all piece | 91 FR 67214 |
| One-to-one consent rule | Vacated by the Eleventh Circuit (Insurance Marketing Coalition v. FCC, Jan 24, 2025); FCC removed the text from its rules | Gone from the CFR since Aug 29, 2025 | 90 FR 42137 |
| Statutory damages | $500 per violation, up to three times that if willful or knowing | In force | 47 U.S.C. 227(b)(3) |
| 10DLC brand registration | $4.50 one-time; Standard brand vetting $41.50 one-time (brands above 6,000 segments a day) | Current | Twilio A2P 10DLC brand docs |
| 10DLC campaign fees | $15 one-time campaign vetting; $1.50 to $10 per campaign per month ($2 for sole proprietors) | Current | Twilio 10DLC overview |
The November 2026 rule is about informational messages, so check with counsel before you narrow how you process STOP replies on marketing texts. Regulated firms carry extra rules on top: our guide to text message marketing for financial advisors covers SEC and FINRA recordkeeping for texts. This is general information, not legal advice.
Before you quote an SMS statistic: a 6-point check
Use this on any SMS number before it goes into a deck, a blog post or a budget request. A stat that fails two or more checks should not be quoted as fact.
- Named original publisher. Pass: you can link the study, report or dataset itself. Fail: “studies show,” “according to Gartner” with no link, or a blog citing a blog.
- Sample size stated. Pass: a number of people, brands or messages. Fail: no sample anywhere in the source.
- Field dates or data window. Pass: survey dates or a data period. Fail: only a publication year, or none.
- Method you can name. Pass: probability survey, vendor panel or platform data, and you know which. Fail: you cannot tell whether a business reported it or a system measured it.
- Metric definition. Pass: you know the denominator (per message sent, per recipient, per click). Fail: a “conversion rate” with no denominator. Klaviyo’s 0.27% and Omnisend’s 0.12% are both called conversion, and they are not the same thing.
- Age. Pass: data from the last two to three years, or clearly labeled as historical. Fail: a 2010 or 2016 figure presented as current.
Scored honestly, “98% open rate” fails checks 1 through 6 in most places it appears. Klaviyo’s 5.6% campaign click rate passes checks 1, 2, 4 and 5 and half-passes 3, because the data window is not stated. Pew’s 91% passes all six. My rule: if a texting vendor’s sales page leads with 98%, ask what their own customers’ measured click and order rates were last quarter.
If you want a second pair of eyes on whether SMS belongs in your channel mix and what it should return, you can book a consultation.
Frequently asked questions
What are the most reliable SMS text marketing statistics?
The most defensible ones come from probability surveys and measured platform data: 91% of U.S. adults own a smartphone (Pew, 2026, 5,511 adults), Americans exchanged nearly 2.2 trillion SMS and MMS messages in 2024 (CTIA), and ecommerce SMS campaigns average a 5.6% click rate on Klaviyo and 12.39% on Omnisend, with orders on 0.12% to 0.27% of messages. Vendor opt-in surveys put consumer opt-in at 84% to 89%.
Is the 98% SMS open rate real?
No, not as a measurement. It traces to a 2010 mobileSQUARED white paper that said 98% of texts were read; mobileSQUARED now says the figure no longer reflects reality and its newer data shows 55% read. Gartner repeated 98% in 2016 citing unnamed sources. SMS has no open tracking: a plain text's status stops at delivered, so any SMS open rate is really a delivery rate or survey answer.
Where does the 90% of texts read within 3 minutes statistic come from?
It comes from the same 2010 mobileSQUARED white paper, Conversational Advertising, and spread through sponsored articles such as a 2015 VentureBeat partner piece. mobileSQUARED has since said it is not an accurate picture of messaging today and disclosed no sample or method. Current surveys say 74% of consumers check texts within five minutes (SimpleTexting, January 2026) and 87% within 15 minutes (EZ Texting, January 2026).
What were the SMS marketing statistics in 2022?
In SimpleTexting's April 2022 survey, 70% of 813 U.S. consumers were subscribed to SMS marketing and 55% of 501 businesses texted customers. Attentive's March 2022 survey of 5,000+ found 81% subscribed to at least one brand. Omnisend merchants sent 62.3% more campaign SMS in 2022 with a 10.66% click rate and 0.19% conversion. CTIA counted more than 2.1 trillion U.S. texts in 2022.
What is a good SMS click rate for ecommerce?
Klaviyo's 2026 benchmarks, from 183,000+ customers, put a good campaign click rate at 5.6% and flows at 9.65%, with the top 10% at 10.44% and 16.6%. Omnisend's 2025 data shows 12.39% for campaigns and 20.34% for automations. Click rates swing with the season: Omnisend's ran from 3.47% in January to 23.92% in December, so compare against the same month last year.
How do SMS and email marketing statistics compare?
Across the same Omnisend brands in 2025, SMS campaigns got a 12.39% click rate against 0.74% for email, and converted 0.12% of messages against 0.08%. Email automations won on conversion (1.49% vs 0.78%) and revenue per message ($3.41 vs $0.75). SMS earns attention; email automations earn more per message, so most stores run both.
How many text messages are sent in the US each year?
CTIA's 2025 Annual Survey counted nearly 2.2 trillion SMS and MMS messages exchanged in the U.S. in 2024, 42 billion more than in 2023, or about 6 billion a day. CTIA counted 2.0 trillion in 2021 and more than 2.1 trillion in both 2022 and 2023. Its 2026 highlights report does not restate a text total.
Channel benchmarks