

The core webinar lead generation statistics for 2026: 40% to 60% of registrants attend (Goldcast counts live only, ON24 includes replays), the average B2B webinar draws 251 registrants and 102 live attendees, and 22% of attendees click a call to action. On ON24’s platform, demo bookings from webinars rose 73% in 2025 and meeting bookings during webinars grew 4X. No independent study proves webinar leads close at a higher rate than other leads, but webinars give you more intent signals per lead than almost any other channel: watch time, poll answers, questions asked and CTA clicks.
Every figure below comes from the vendor that collected it, with its own definition next to it, because most disagreement between webinar benchmarks comes down to what each one counts. All the platform reports are vendor data from their own customers, so read them as benchmarks for B2B marketing webinars, not for every webinar ever run.
Webinar lead generation statistics: the numbers people ask for
| Statistic | Figure | Source and data period |
|---|---|---|
| Registrants who become attendees (live plus on-demand) | 60% | ON24 2026 Webinar Benchmarks, 2025 platform data |
| Average live attendance rate | 40% | Goldcast 2026 B2B Webinar Benchmark Report, 26,190 webinars in 2025 |
| Average show-up rate | 47.7% | Livestorm 2026 Webinar Benchmark Report, 33,786 sessions in 2025 |
| Attendees who click a call to action | 22% (25% with two CTAs) | Univid Webinar Insights 2026, 2,000+ webinars, Jan 2023 to Aug 2026 |
| Change in demo bookings from webinars | +73% | ON24, 2025 vs 2024 |
| Meeting bookings during webinars | 4X increase | ON24, 2025 vs 2024 |
| Live chat with sales teams during webinars | +51% | ON24, 2025 vs 2024 |
| Interactions produced per webinar | Over 300 (1.8 per attendee) | ON24, 2025 |
| Webinar organizations that use webinars for lead generation | 65% | TwentyThree, as cited in Zoom’s webinar statistics roundup (Oct 2025) |
| B2B marketers who rate webinars a most effective distribution channel | 51% (in-person events 52%) | CMI B2B Content Marketing 2025, 980 B2B marketers, fielded June to Aug 2024 |
| B2B marketers who collect first-party data through gated assets, webinars and interactive tools | 68% | CMI B2B Content and Marketing Trends 2026, 1,015 B2B marketers, fielded June to Aug 2025 |
Two of those numbers do most of the work in a lead plan: the attendance rate, because it sets how many people hear your offer, and the CTA click rate, because it is the closest public benchmark to “attendee raised a hand.” The rest describe direction and buyer behavior.
Do webinar attendees make higher-intent leads? What the data shows
The honest answer: the data shows webinar attendees give you much stronger buying signals, but no independent study compares their close rate with leads from other channels. Here is what is actually measured.
- They stay. ON24’s average engagement time was 49 minutes in 2025. Goldcast found live attendees complete about 74% of a webinar and on-demand viewers 91%. Few other lead sources give you 49 minutes of a prospect’s attention before the first sales touch.
- They take action inside the session. On ON24, demo bookings rose 73% and meeting bookings during webinars grew 4X in 2025, while CTA engagement per attendee rose 49%. Univid’s median attendee CTA click rate is 22%.
- They tell you what they want. ON24 webinars averaged 150 poll responses and 101 resource downloads each in 2025. Each one is a field you can route on.
- Vendor case studies report high conversion into sales talks. In an ON24 customer story, CooperVision says over 70% of attendees of a five-part webinar series for eye-care professionals moved into follow-up sales conversations. That is one vendor-published program, not a benchmark.
The widely quoted “73% of B2B marketers and sales leaders say webinars are the best way to generate high-quality leads” is an opinion survey. GoTo’s 2019 benchmark post attributes it to an InsideSales study. It measures what marketers believe, not how leads convert, and it is now years old. If you want to prove intent for your own program, compare opportunity rates for webinar attendees who clicked a CTA, attended without clicking, and registered without attending. Our lead qualification guide shows how to turn those behaviors into a score.
Webinar attendance rate: five sources, five definitions
Attendance benchmarks range from 40% to 60% because each source divides a different numerator by a different denominator. Match the definition to what your platform reports before you compare.
| Source | Rate | What it counts | Dataset |
|---|---|---|---|
| ON24 2026 benchmarks | 60% | Registrations that convert to attendees, live or on-demand | ON24 platform, 2025; enterprise-heavy customer base |
| Univid 2026 | 49% live, 57% including replay | Live attendees over registrants; total adds replay viewers | 2,000+ webinars, about 70% Europe, 20% US |
| Livestorm 2026 | 47.7% | Attendees divided by registrants; 175 average registrants to 83 live attendees | 33,786 sessions, 7,062,572 registrations, 2025 (report page) |
| Goldcast 2026 | 40% (33% in 2024) | Average attendance rate; Goldcast does not publish its exact formula | 26,190 webinars from 522 B2B organizations, 2025 |
| GoTo (2019) | 44% | Average attendance rate for marketing webinars | Older GoToWebinar analysis |
One detail most roundups miss: an average of per-webinar rates is not the same as a pooled rate. Goldcast’s totals are 2,220,718 attendees from 6.8 million registrants, which works out to about 33% pooled, against its 40% average. The gap suggests large events show up at lower rates and pull the pooled figure down, which matches Goldcast’s Thursday pattern: the most registrants per event and the lowest attendance rate. If you run one large flagship event, plan from the lower number.
Audience size follows the same pattern. Goldcast reports 251 average registrants and 102 average attendees per event, up from 238 and 51. ON24 reports 239 average attendees, an 11% rise. Univid also reports 102 average live attendees, with 71% of webinars under 100 live attendees and half under 50. Dividing Goldcast’s totals by its 26,190 webinars gives about 85 attendees per webinar, so treat 102 as a rounded average of a subset rather than an exact mean.
ON24 webinar benchmarks: 2024 vs 2025 attendance and conversion
ON24 publishes its report in the year after the data, so the “2025 report” describes 2024 webinars and the “2026 report” describes 2025 webinars. That naming causes most of the confusion in searches for ON24 attendance rates.
| Metric | 2025 report (2024 data) | 2026 report (2025 data) |
|---|---|---|
| Registration-to-attendee conversion | 57% | 60% |
| Attendees joining live | 56% | 67% |
| Attendees joining on-demand | 45% (1% joined both) | 43% |
| Average attendees per webinar | Q4 average: 219 | 239 for the year (Q4: 254) |
| Average engagement time | Not in the public summary | 49 minutes |
| Where it is published | MarketingProfs summary of ON24’s 2024 platform data | ON24 blog, June 19, 2026 |
Two cautions when quoting ON24. Its 2026 blog summary box says “on-demand viewing accounts for 50% of all webinar attendees” and “an average of 51 minutes,” while the body text gives 67% live, 43% on-demand and 49 minutes. Cite the body figures, which are the detailed ones. And remember that ON24’s 60% includes replay viewers, so it is not comparable with a live-only rate from Goldcast or Livestorm.
Live vs on-demand: how much of the audience watches the replay
Replays matter, but less than ON24’s numbers alone suggest. On Goldcast, on-demand was only 15.9% of total viewership in 2025, so the live session still does most of the work.
| Finding | Figure | Source |
|---|---|---|
| Attendees who joined on-demand | 43% | ON24, 2025 |
| Webinars made available on demand | 89.1% (79.9% in 2024) | Goldcast, 2025 |
| On-demand share of total viewership | 15.9% | Goldcast, 2025 |
| Live attendees who later watched the replay | 10.61% | Goldcast, 2025 |
| Registrants who only watched on demand | 2.62% | Goldcast, 2025 |
| Attendance gain from adding replay | 49% live to 57% total | Univid, 2023 to 2026 |
| Average views per session, public vs gated replay | 14.60 vs 3.97 | Livestorm, 2025 |
| Teams that restrict replays to registered users | 62% | Livestorm, 2025 |
For lead generation, the Livestorm gap is the useful one: public replays get about 3.7 times the views, but gated replays capture contact details. A practical split is a gated full replay for lead capture plus public short clips that link to the registration page for the next session.
Best day and time for a webinar, by source
The busiest slots are not the best-attended ones. Goldcast’s Thursday webinars drew the most registrants (486 on average) but the lowest attendance rate (38.7%), while Monday (47.2%) and Friday (46.9%) converted registrants best on far smaller lists.
| Source | Best day for attendance | Best time | Note |
|---|---|---|---|
| Goldcast 2025 | Monday 47.2%, Friday 46.9% | Noon ET is the most common start (about 16% of webinars); consulting firms did best Tuesday 8 to 11 AM ET (46.9%) | Wednesday and Thursday host about 30% of webinars each; per-slot samples are small |
| Livestorm 2025 | Tuesday 51.7% | Not published in the summary | Wednesday draws the largest live audience; January best month (50.4%), August weakest (42.9%) |
| Univid 2023 to 2026 | Wednesday 51%, Thursday 50% | 3 PM (58.3%), then 11 AM (56.9%) | Mostly European audiences; January best month (51%) |
| GoTo (2019) | Wednesday and Thursday, 26% of attendees each | 10 and 11 AM PT | Older data |
If your buyers are US business owners, start with a Tuesday late-morning ET slot, then test Monday or Friday on your next run. Also plan promotion around timing data: Livestorm found 49.7% of registrations arrive in the final 7 days and 15% on the day of the event, close to GoTo’s older 59% and 17%.
Webinar length and watch time
Sixty minutes is still the standard, and the data supports it for lead generation.
- Goldcast’s average webinar ran 56.8 minutes with a 60 minute median; 50.5% were exactly 60 minutes and 15.5% exactly 30 minutes. Consulting firms averaged 69.4 minutes.
- Univid found 60 minute webinars had the highest total attendance rate (62%) and the highest CTA conversion (26%), with 45 minutes second (25%).
- Livestorm’s average watch time was 26 minutes, about 38% of runtime, far below ON24’s 49 minutes. ON24’s figure comes from a different, enterprise-heavy customer base, so expect your own number to sit between the two.
Because live attendees finish about 74% of a session (Goldcast), put your first call to action in the first two-thirds of the hour, not in the closing minutes.
Engagement benchmarks: chat, polls, CTAs and downloads
Engagement features are where lead data comes from, yet most webinars barely use them. Goldcast measured how many of its 2025 webinars used each feature.
| Feature | Goldcast: share of webinars using it (2025) | Univid: share of webinars using it | ON24: average per webinar (2025) |
|---|---|---|---|
| Chat | 62.3% | 63% | Not reported |
| Q&A | 56.1% | 49% | Not reported |
| Polls | 19% | 40% | 150 poll responses |
| Resource clicks or downloads | 35.1% | Not reported | 101 downloads |
| CTA clicks | 17.8% | 70% had a CTA active | CTA engagement per attendee up 49% |
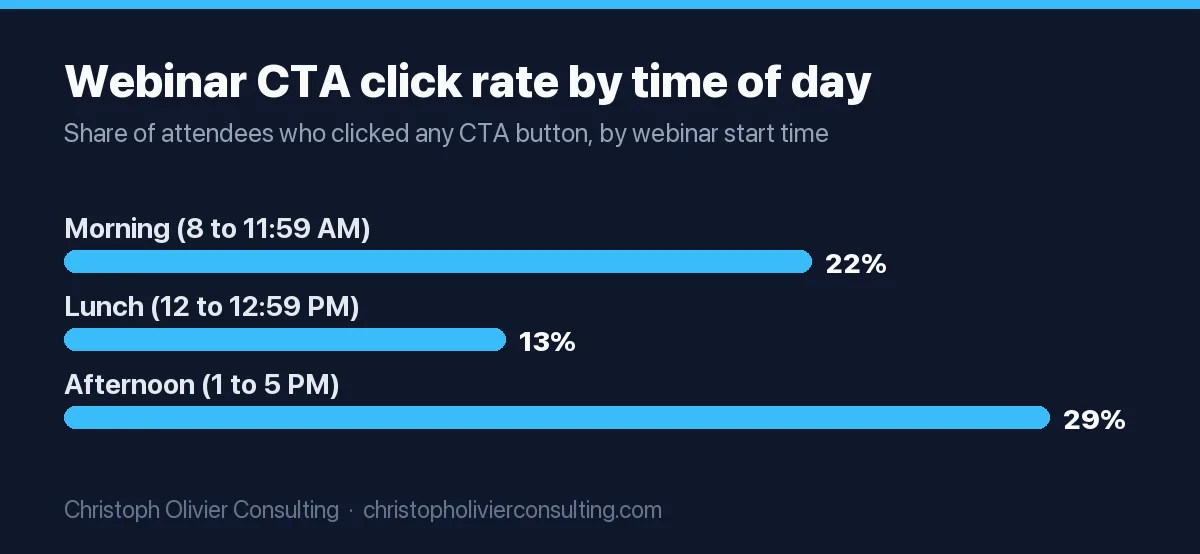
Univid’s CTA data is the most useful set for lead generation. Its attendees clicked a CTA 22% of the time with one CTA and 25% with two, and webinars with 50 to 100 attendees had the highest click rate (26%). Time of day mattered even more than CTA count.
Webinar cost per lead: why the $72 figure is shaky, and how to calculate yours
The most repeated webinar cost per lead is $72. Zoom’s roundup attributes it to Visitor Queue, a website visitor tracking vendor, and we could not find a dataset or methodology behind it, so do not plan a budget on it. Cost per lead depends on your list size, ad spend and what you count as a lead. Calculate it from your own costs instead.
Here is the lead-gen math for one webinar. The conversion rates are the published benchmarks above; the spend lines are assumptions you should replace.
| Line | Rate | Count | Cost per unit | Where the input comes from |
|---|---|---|---|---|
| Platform | $79 | WebinarJam Basic, $79 per month billed annually (500 attendees, 2 hour sessions), one webinar per month | ||
| Paid promotion | $1,500 | Assumption: LinkedIn or retargeting spend | ||
| Total cost | $1,579 | |||
| Registrants | 250 | $6.32 per registrant | Close to Goldcast’s 251 average | |
| Live attendees | 40% | 100 | $15.79 per attendee | Goldcast average attendance rate |
| On-demand only viewers | 2.62% of registrants | 7 | $14.76 per viewer (107 total) | Goldcast |
| Clicked a CTA live | 22% | 22 | $71.77 per hand-raiser | Univid median CTA click rate |
| Booked a meeting | 50% of clickers | 11 | $143.55 per meeting | Assumption: replace with your calendar data |
Notice the gap: the same webinar costs $6.32 per lead if you count registrants and $143.55 if you count booked meetings. Always state which one you mean. If you use ON24’s 60% rate instead of Goldcast’s 40%, the same spend produces 150 attendees at $10.53 each, which is why the source you cite changes the story.
The same math works backward. With 40% attendance, 22% CTA clicks and half of clickers booking, each registrant is worth 0.044 meetings, so 10 meetings needs about 227 registrants. Our guide on how many leads you need walks through this reverse funnel, and our average cost per lead by industry page gives channel comparisons to set the result against.
Which webinar statistic to cite
Use this table when you need one number for a slide, a plan or an article.
| If you want to say | Cite | Exact definition | Do not use it for |
|---|---|---|---|
| What share of registrants attend live | Goldcast 40% (2025) or Livestorm 47.7% (2025) | Live attendees over registrants | Totals that include replay viewers |
| What share watch at all, live or replay | ON24 60% (2025) or Univid 57% | Live plus on-demand attendees over registrants | Live show-up targets |
| How many people attend an average B2B webinar | Goldcast 102 from 251 registrants, or ON24 239 | Average per event on that platform | Small firm forecasts; half of Univid’s webinars had under 50 live attendees |
| How many attendees act on an offer | Univid 22% CTA click rate | Share of attendees who clicked any CTA button | Booked meetings or closed deals |
| Webinars drive sales meetings | ON24: demo bookings +73%, meetings booked during webinars 4X (2025) | Year-over-year change on ON24’s platform | An absolute conversion rate |
| Marketers rate webinars highly | CMI 2025: 51% most effective distribution channel | Survey of 980 B2B marketers, 2024 fieldwork | Lead quality or ROI claims |
| When people register | Livestorm: 49.7% in the final 7 days, 15% on the day (2025) | Share of registrations by timing | Attendance timing |
| Cost per webinar lead | Your own math (table above) | Total cost over the lead type you name | The $72 figure, which has no published method |
Three more numbers to stop repeating. TwentyThree’s “63% live webinar conversion” and “19% on-demand conversion” appear in Zoom’s roundup without a definition of conversion. The “20% to 40% of attendees become qualified leads” range circulates on vendor blogs without a primary source. And the 73% “best way to get high-quality leads” figure is a 2019-era opinion survey. If your audience is planners comparing webinars with in-person formats, our event marketing statistics page covers the event side.
Turning benchmarks into a plan
Benchmarks tell you where to look, not what to fix. Measure your own registrant-to-live rate, CTA click rate and meeting rate for three consecutive webinars, then compare each against the matching benchmark: the stage furthest below its benchmark is the one to fix first. If attendance is fine but nobody clicks, the problem is usually the offer, and our guide to structuring a webinar offer that converts covers that. If the whole funnel needs work, the end-to-end playbook for webinar marketing that drives leads and sales has the promotion calendar, run of show and follow-up sequence. If you would rather walk through your numbers with someone, you can book a consultation.
Frequently asked questions
What are the key webinar lead generation statistics for 2026?
Across 2025 platform data, 40% (Goldcast, live only) to 60% (ON24, including replays) of registrants attend, the average B2B webinar has 251 registrants and 102 live attendees, and 22% of attendees click a call to action (Univid). ON24 also reported demo bookings from webinars up 73% and meetings booked during webinars up 4X year over year.
Are webinar attendees higher intent leads?
They produce stronger intent signals than most lead sources: ON24 measured 49 minutes of average engagement and Goldcast found live attendees complete about 74% of a session. But no independent study compares webinar lead close rates with other channels. Test it in your own CRM by comparing opportunity rates for CTA clickers, attendees who did not click, and no-shows.
What was the ON24 webinar benchmark attendance rate in 2024 and 2025?
ON24's 2025 report, based on 2024 platform data, found 57% of B2B registrations converted to attendees, with 56% of attendees joining live and 45% on demand. Its 2026 report, based on 2025 data, put registration-to-attendee conversion at 60%, average attendees at 239 and average engagement at 49 minutes, with 67% joining live. Both rates include on-demand viewers.
What is a good webinar attendance rate in 2026?
For live attendance, 40% to 48% is the benchmark range: Goldcast reported a 40% average across 26,190 B2B webinars in 2025 and Livestorm 47.7% across 33,786 sessions. If you count replay viewers too, compare with ON24's 60% or Univid's 57%. Small, well-targeted lists often beat these averages, because large events tend to pull rates down.
What is the average cost per lead for a webinar?
The widely repeated figure is $72, but it traces to a vendor blog with no published methodology, so it is not a reliable benchmark. Calculate your own: total platform and promotion cost divided by the lead type you name. In a worked example with $1,579 of spend and benchmark rates, cost was $6.32 per registrant but $143.55 per booked meeting.
What is the best day and time to host a webinar?
It depends on the dataset. Goldcast's 2025 data showed the highest attendance rates on Monday (47.2%) and Friday (46.9%), with Tuesday 8 to 11 AM ET best for consulting firms. Livestorm found Tuesday best (51.7%). Univid, with mostly European audiences, found Wednesday and 3 PM starts best. Test two slots with your own list.
How many webinar registrants do I need to book sales meetings?
Using 40% live attendance, a 22% CTA click rate and an assumed 50% of clickers booking, each registrant is worth about 0.044 meetings. That means roughly 227 registrants for 10 booked meetings. Replace the booking assumption with your own calendar data after your first webinar, then rerun the math.