
Last reviewed: September 2026
What the average cost per lead by industry looks like in 2026
The average cost per lead by industry runs from about $91 in ecommerce to roughly $890 in industrial manufacturing in 2026, with most B2B sectors landing between $200 and $720. The blended cross-industry average sits near $214, up from about $198 in 2025. Long sales cycles, tight regulation, and high deal value push some verticals far above the mean.
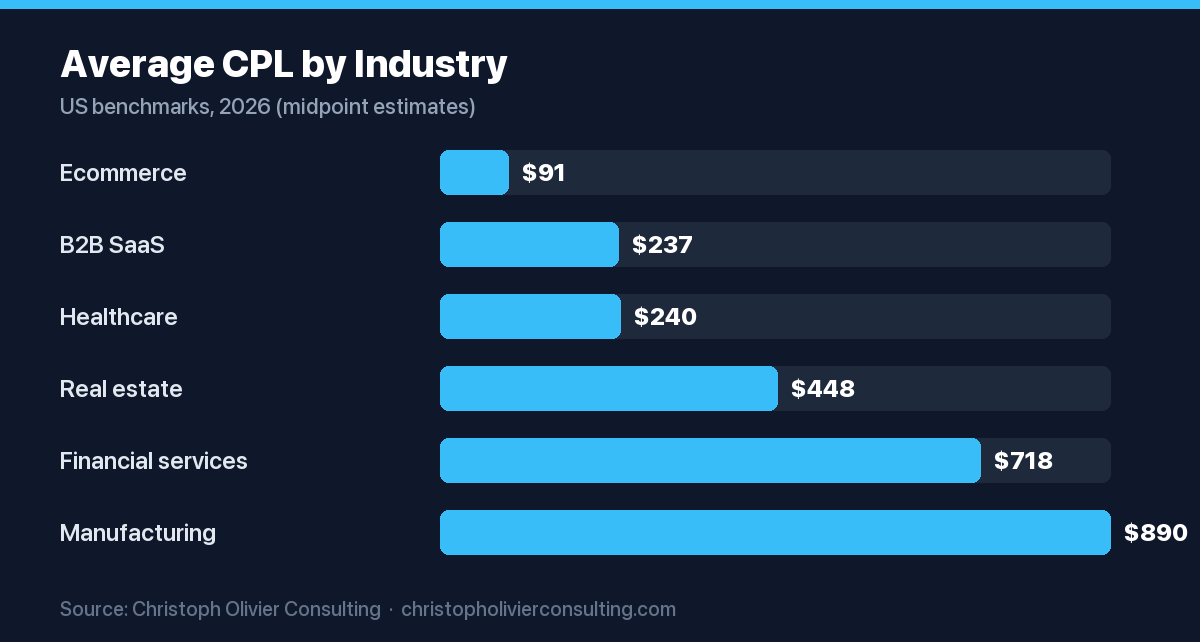
The figures below are midpoint estimates drawn from public 2026 benchmark reports (WordStream, LocaliQ, First Page Sage, and HubSpot-style CPL research). Treat each number as a directional range, not a fixed price, because a “lead” is defined differently in every report.
| Industry | Typical CPL range (2026) | Midpoint estimate |
|---|---|---|
| Ecommerce / retail | $60 to $120 | $91 |
| B2B SaaS | $150 to $320 | $237 |
| Healthcare | $160 to $320 | $240 |
| Real estate | $300 to $600 | $448 |
| Financial services | $550 to $900 | $718 |
| Industrial manufacturing | $700 to $1,050 | $890 |
Read your own number against the sector you sell into, not the blended average. A $400 lead can be a bargain in financial services and a disaster in retail. For the wider playbook these numbers plug into, see our B2B lead generation strategies guide.
Why channel changes your cost per lead more than industry
Channel choice moves cost per lead further than industry does. Within the same vertical, a referral can cost about $25 while a trade-show lead can cost around $840. That is a 30x swing driven by the acquisition method alone. Owned and earned channels sit low, paid social sits in the middle, and events and premium paid search sit at the top.
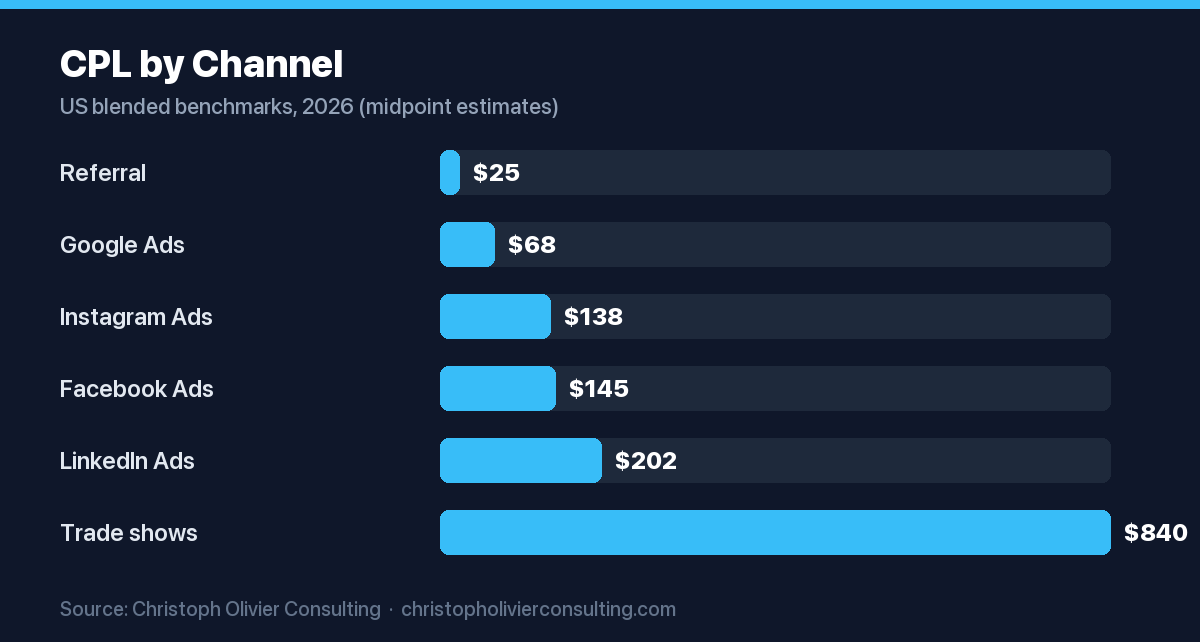
The table below shows 2026 midpoint CPL by channel, blended across industries. Paid numbers reflect campaign benchmarks from WordStream and platform advertiser data; referral and event figures reflect published survey ranges.
| Channel | Typical CPL range (2026) | Midpoint estimate |
|---|---|---|
| Referral | $15 to $40 | $25 |
| Google Ads (search) | $50 to $90 | $68 |
| Instagram Ads | $110 to $170 | $138 |
| Facebook Ads | $115 to $175 | $145 |
| LinkedIn Ads | $150 to $260 | $202 |
| Trade shows / events | $700 to $980 | $840 |
SEO and email sit below most paid channels once they are established, often in the $15 to $60 band per lead, though they carry upfront time and setup cost that a per-lead figure hides. Blend channels on purpose rather than chasing the single cheapest one, because the mix that produces leads that actually close is what controls real acquisition cost.
How to calculate your own cost per lead
Cost per lead equals total spend on a campaign divided by the number of leads it produced. Spend $1,000 and get 100 leads and your CPL is $10. Include media, tools, agency fees, and the labor hours tied to the effort so the number reflects true cost, not just ad spend.
- Set the time window and the campaign or channel you want to measure.
- Add every cost inside that window: ad spend, software, creative, and staff time.
- Count only leads that meet your agreed definition, such as a form fill or booked call.
- Divide total cost by lead count to get CPL.
- Repeat per channel so you can compare, then track the trend month over month.
Segment by lead quality once the basic number is stable. A newsletter signup and a sales-qualified demo request can differ 50x in value while both get called a lead, so split marketing-qualified from sales-qualified before you compare against any benchmark. Our note on how to measure marketing effectiveness covers the wider metric set CPL belongs to.
What counts as a good cost per lead
A good cost per lead is any figure comfortably below what a converted customer is worth to you. There is no universal target. Compare CPL against average customer value and close rate, then against your own sector benchmark after adjusting for season, region, and funnel stage. A cheap lead that never closes costs more than an expensive lead that does.
Work the math backward from lifetime value. If a customer is worth $6,000 and one in ten qualified leads closes, a $400 lead still returns your money several times over. The same $400 lead is a loss if a customer is worth $800. Judge CPL beside conversion rate, never on its own.
How to lower your cost per lead
You lower cost per lead by raising conversion rate and tightening targeting before you cut spend. Landing page optimization, sharper audience definition, retargeting, and a heavier organic mix each reduce CPL without buying more media. Retargeting often runs 50 to 70 percent below prospecting, and organic leads tend to run 20 to 40 percent below paid.
- Optimize the landing page and shorten the lead form to lift conversion rate.
- Tighten targeting by job title, company size, and behavior to cut wasted clicks.
- Add retargeting layers, which usually convert far cheaper than cold prospecting.
- Shift budget toward SEO, referral, and email as they mature and compound.
- Kill the lowest-quality sources and reinvest in the channels that actually close.
Fix quality and conversion first, because a lower CPL that produces dead leads raises real acquisition cost. A structured plan helps here, and our sales and marketing strategy approach ties channel choice to pipeline value rather than to headline CPL alone.
Where cost per lead fits in your growth plan
Cost per lead is an input, not the destination. It feeds customer acquisition cost, which feeds return on marketing spend. Track CPL by channel and by lead quality, connect it to close rate and customer value, and use it to reallocate budget every month rather than to declare one channel the winner.
If you want a second set of eyes on your benchmarks and channel mix, our fractional-CMO services build the measurement layer and the acquisition plan together. The goal is fewer, better leads at a cost your unit economics can carry.
Frequently asked questions
What is the average cost per lead across all industries in 2026?
The blended cross-industry average cost per lead sits near $214 in 2026, up from roughly $198 in 2025. That single figure hides a wide spread. Ecommerce leads average around $91 while industrial manufacturing leads average around $890. Use the blended number only as a rough anchor, then compare your own CPL against your specific sector and channel mix.
Which industries have the highest cost per lead?
Industrial manufacturing, financial services, and real estate carry the highest cost per lead in 2026, with midpoint estimates near $890, $718, and $448. These verticals combine long sales cycles, heavy regulation, and high deal value, so buyers research longer and each qualified lead costs more to earn. High customer value usually justifies the higher CPL in these sectors.
Does channel or industry affect cost per lead more?
Channel moves cost per lead more than industry. Inside one vertical, a referral can cost about $25 while a trade-show lead can cost around $840, a 30x swing. Referral, SEO, and email sit low, paid social sits in the middle, and events plus premium paid search sit at the top. Blend channels rather than chasing the cheapest one.
How do I calculate cost per lead?
Divide total campaign cost by the number of leads produced in a set window. Spend $1,000 and get 100 leads and your CPL is $10. Include ad spend, software, creative, and staff time, not just media. Calculate per channel so you can compare, and count only leads that meet your agreed definition, such as a form fill or booked call.
What is a good cost per lead?
A good cost per lead is any figure comfortably below what a converted customer is worth to you. There is no fixed target. Compare CPL against average customer value and close rate, then against your sector benchmark after adjusting for season, region, and funnel stage. An expensive lead that closes beats a cheap lead that never does.
How can I lower my cost per lead?
Raise conversion rate and tighten targeting before cutting spend. Optimize landing pages, shorten forms, sharpen audience settings, and add retargeting, which often runs 50 to 70 percent below prospecting. Shift budget toward organic, referral, and email as they mature, since organic leads tend to run 20 to 40 percent below paid. Cut the lowest-quality sources first.
More marketing guides for rank on ai: get cited by ai search
- Cosmetic Dentist Marketing: A Cost-Per-Case Playbook for 2026
- Foundation Repair Marketing: The Cost-Per-Booked-Job Playbook
- Garage Door Company Marketing: The 2026 Channel and Cost Guide
- Hair Restoration Marketing: A 2026 Cost Per Consult Playbook
- Kitchen Remodeling Marketing: A Channel Plan That Books High-Ticket Projects
- Locksmith Marketing: A 2026 Playbook for Booked Jobs and Beating Lead-Gen Spam
- Rank on AI: Get Cited by AI Search