
The 2026 LocaliQ and WordStream Search Advertising Benchmarks put Business Services at a $5.87 average CPC, a 6.10% click-through rate, a 4.85% conversion rate and a $93.69 cost per lead, against $5.42, 6.64%, 8.18% and $66.69 across all 23 industries. The 2025 edition, which most “2025 benchmark” searches are after, had Business Services at $5.58 CPC, 5.65% CTR, 5.14% conversion rate and $103.54 per lead. Both full by-industry tables are below, with year-over-year change on every cell, followed by how to turn a benchmark into a max CPC for your own firm.
Business consulting and services: average CPC, CTR, conversion rate and cost per lead
Consulting is not broken out on its own in the study. It falls inside the Business Services category, which is the closest published benchmark for consultants, agencies, IT services and other B2B service firms. Here is how that category has moved over the last three editions:
| Edition (data window) | Business Services CPC | CTR | Conversion rate | Cost per lead | All-industry CPC |
|---|---|---|---|---|---|
| 2026 (Apr 2025 to Mar 2026) | $5.87 | 6.10% | 4.85% | $93.69 | $5.42 |
| 2025 (Apr 2024 to Mar 2025) | $5.58 | 5.65% | 5.14% | $103.54 | $5.26 |
| 2024 (Apr 2023 to Mar 2024) | $5.37 | 5.62% | 5.78% | $105.64 | $4.66 |
| Change, 2024 to 2026 | +9.3% | +8.5% | -16.1% | -11.3% | +16.3% |
Three things stand out for anyone budgeting business services or consulting campaigns in 2026:
- Clicks got dearer, leads got cheaper. CPC rose 9.3% across the two years, yet cost per lead fell 11.3%, from $105.64 to $93.69. That looks impossible when conversion rate also fell. It happens because each column is a separate median across campaigns (explained below), so read the CPL column as its own benchmark.
- Conversion rate has fallen two years running. From 5.78% to 5.14% to 4.85%. WordStream’s 2026 report puts the Business Services decline at 5.65%, and it is one of only three categories whose conversion rate fell in 2026, alongside Career and Employment and Automotive, For Sale. Six categories convert worse in absolute terms, led by Finance and Insurance at 2.64%.
- Cost per lead is the fifth highest of 23 categories. Only Attorneys and Legal Services ($131.63), Furniture ($106.70), Real Estate ($102.51) and Apparel ($97.51) cost more per lead. The 2025 report’s own explanation: “a Business Services lead could equate to a larger, higher value purchase as the lead moves through the B2B sales cycle.”
If you sell consulting, the lead price matters less than what a lead is worth to you, which is why the max CPC worked example further down uses your close rate and deal value, not the benchmark.
Google Ads CPC by industry: 2026 benchmarks with year-over-year change
The 2026 edition is the latest release (last updated May 19, 2026 on WordStream; June 1, 2026 on LocaliQ). Across all industries, CPC rose 3.0% to $5.42 and cost per lead fell 4.9% to $66.69, which WordStream describes as the first CPL decline in five years. Attorneys and Legal Services pay the most per click ($9.87) and per lead ($131.63). Arts and Entertainment pay the least on both ($1.63, $26.84). Business Services is in bold.
| Industry | Avg CPC (YoY) | Avg CTR (YoY) | Conversion rate (YoY) | Cost per lead (YoY) |
|---|---|---|---|---|
| Animals & Pets | $4.06 (+2.3%) | 7.49% (+13.8%) | 16.22% (+24.1%) | $31.50 (-1.0%) |
| Apparel, Fashion & Jewelry | $4.44 (+3.0%) | 6.64% (-1.9%) | 4.50% (+12.8%) | $97.51 (-3.9%) |
| Arts & Entertainment | $1.63 (+1.9%) | 12.75% (-2.7%) | 5.91% (+22.1%) | $26.84 (-11.3%) |
| Attorneys & Legal Services | $9.87 (+15.0%) | 5.87% (-1.7%) | 5.55% (+9.0%) | $131.63 (+0.0%) |
| Automotive, For Sale | $2.27 (-5.8%) | 8.28% (-0.1%) | 6.01% (-22.6%) | $44.26 (+13.9%) |
| Automotive, Repair, Service & Parts | $4.35 (+11.5%) | 5.56% (+0.0%) | 15.51% (+5.7%) | $29.96 (+5.1%) |
| Beauty & Personal Care | $4.62 (-18.9%) | 6.75% (+18.2%) | 10.35% (+32.4%) | $39.25 (-35.0%) |
| Business Services | $5.87 (+5.2%) | 6.10% (+8.0%) | 4.85% (-5.6%) | $93.69 (-9.5%) |
| Career & Employment | $5.81 (+12.6%) | 5.88% (-10.5%) | 3.05% (-29.6%) | $67.36 (+7.3%) |
| Dentists & Dental Services | $8.00 (+1.9%) | 5.66% (+4.0%) | 10.67% (+17.5%) | $72.97 (-13.1%) |
| Education & Instruction | $4.81 (-22.8%) | 7.56% (+31.7%) | 13.14% (+15.5%) | $77.48 (-13.9%) |
| Finance & Insurance | $3.39 (-2.0%) | 9.83% (+18.0%) | 2.64% (+3.5%) | $74.44 (-11.3%) |
| Furniture | $3.97 (+2.8%) | 6.57% (+7.5%) | 2.99% (+9.5%) | $106.70 (-12.2%) |
| Health & Fitness | $6.17 (+23.4%) | 5.81% (-19.1%) | 6.94% (+2.1%) | $67.36 (+7.3%) |
| Home & Home Improvement | $8.33 (+6.1%) | 6.47% (+1.6%) | 8.05% (+9.8%) | $90.92 (+0.0%) |
| Industrial & Commercial | $5.87 (+3.0%) | 6.57% (+5.5%) | 8.20% (+14.4%) | $75.19 (-12.2%) |
| Personal Services | $7.17 (+23.4%) | 7.16% (-6.9%) | 12.34% (+26.7%) | $54.60 (+2.0%) |
| Physicians & Surgeons | $4.76 (-4.8%) | 6.61% (-1.8%) | 12.43% (+7.0%) | $40.04 (-29.5%) |
| Real Estate | $3.22 (+27.3%) | 7.61% (-9.7%) | 3.70% (+12.8%) | $102.51 (+2.0%) |
| Restaurants & Food | $2.05 (+0.0%) | 6.83% (-9.9%) | 8.05% (+13.5%) | $30.57 (+1.0%) |
| Shopping, Collectibles & Gifts | $4.14 (+18.6%) | 8.28% (-7.2%) | 4.01% (+4.7%) | $49.40 (+3.0%) |
| Sports & Recreation | $2.77 (+4.9%) | 8.75% (-4.8%) | 7.69% (+0.9%) | $44.26 (-6.8%) |
| Travel | $2.14 (+0.9%) | 9.32% (+6.8%) | 5.83% (+1.4%) | $44.70 (-39.3%) |
| All industries | $5.42 (+3.0%) | 6.64% (-0.3%) | 8.18% (+8.8%) | $66.69 (-4.9%) |
The biggest CPC moves in 2026: Real Estate up 27.3% ($2.53 to $3.22), Personal Services and Health and Fitness both up 23.4%, Education and Instruction down 22.8% ($6.23 to $4.81) and Beauty and Personal Care down 18.9%. On cost per lead, Travel fell 39.4% and Automotive, For Sale rose 13.9%, the largest increase. WordStream notes that conversion rate improved for 87% of industries.
LocaliQ 2025 search advertising benchmarks: average CPC, CTR, conversion rate and CPL
The 2025 edition covers 16,446 US campaigns from April 1, 2024 to March 31, 2025. Its all-industry averages were $5.26 CPC, 6.66% CTR, 7.52% conversion rate and $70.11 cost per lead. That year was the expensive one: WordStream reported CPC up 12.88% overall and up for 87% of industries, with Beauty and Personal Care up 60.11% and Education and Instruction up 41.91%. Cost per lead rose 5.13%, from $66.69 to $70.11.
| Industry | Avg CPC (YoY) | Avg CTR (YoY) | Conversion rate (YoY) | Cost per lead (YoY) |
|---|---|---|---|---|
| Animals & Pets | $3.97 (+1.8%) | 6.58% (-11.0%) | 13.07% (+8.6%) | $31.82 (-8.6%) |
| Apparel, Fashion & Jewelry | $4.31 (+27.1%) | 6.77% (+10.4%) | 3.99% (+19.8%) | $101.49 (+22.1%) |
| Arts & Entertainment | $1.60 (-7.0%) | 13.10% (+0.5%) | 4.84% (+14.7%) | $30.27 (-32.3%) |
| Attorneys & Legal Services | $8.58 (-4.0%) | 5.97% (+12.6%) | 5.09% (-9.8%) | $131.63 (-8.6%) |
| Automotive, For Sale | $2.41 (+3.0%) | 8.29% (-3.4%) | 7.76% (+19.6%) | $38.86 (-9.5%) |
| Automotive, Repair, Service & Parts | $3.90 (+15.0%) | 5.56% (-2.3%) | 14.67% (+13.2%) | $28.50 (+2.0%) |
| Beauty & Personal Care | $5.70 (+60.1%) | 5.71% (-15.4%) | 7.82% (-2.4%) | $60.34 (+24.6%) |
| Business Services | $5.58 (+3.9%) | 5.65% (+0.5%) | 5.14% (-11.1%) | $103.54 (-2.0%) |
| Career & Employment | $5.16 (+13.9%) | 6.57% (-3.2%) | 4.33% (-23.1%) | $62.80 (-46.7%) |
| Dentists & Dental Services | $7.85 (+15.1%) | 5.44% (+1.1%) | 9.08% (+8.6%) | $83.93 (-3.0%) |
| Education & Instruction | $6.23 (+41.9%) | 5.74% (-7.6%) | 11.38% (+43.9%) | $90.02 (+25.9%) |
| Finance & Insurance | $3.46 (+15.3%) | 8.33% (+8.0%) | 2.55% (-8.3%) | $83.93 (+10.5%) |
| Furniture | $3.86 (+17.3%) | 6.11% (-6.0%) | 2.73% (+7.9%) | $121.51 (+2.0%) |
| Health & Fitness | $5.00 (+6.2%) | 7.18% (+4.4%) | 6.80% (-8.1%) | $62.80 (+2.0%) |
| Home & Home Improvement | $7.85 (+12.8%) | 6.37% (+14.0%) | 7.33% (-15.0%) | $90.92 (+10.5%) |
| Industrial & Commercial | $5.70 (+15.2%) | 6.23% (+6.9%) | 7.17% (+4.8%) | $85.63 (+10.5%) |
| Personal Services | $5.81 (+17.4%) | 7.69% (-3.3%) | 9.74% (+10.3%) | $53.52 (+1.0%) |
| Physicians & Surgeons | $5.00 (+5.0%) | 6.73% (+0.0%) | 11.62% (+4.9%) | $56.83 (-4.9%) |
| Real Estate | $2.53 (+20.5%) | 8.43% (-8.4%) | 3.28% (+12.7%) | $100.48 (+15.0%) |
| Restaurants & Food | $2.05 (-6.0%) | 7.58% (-12.7%) | 7.09% (-18.7%) | $30.27 (+2.0%) |
| Shopping, Collectibles & Gifts | $3.49 (+33.7%) | 8.92% (+14.2%) | 3.83% (+9.7%) | $47.94 (+13.9%) |
| Sports & Recreation | $2.64 (+12.8%) | 9.19% (-4.9%) | 7.62% (+42.4%) | $47.47 (-4.9%) |
| Travel | $2.12 (+10.4%) | 8.73% (-14.1%) | 5.75% (+7.3%) | $73.70 (+11.6%) |
| All industries | $5.26 (+12.9%) | 6.66% (+3.7%) | 7.52% (+8.0%) | $70.11 (+5.1%) |
Note the coincidence in the all-industry cost per lead: the 2024 and 2026 editions both report exactly $66.69. That is what the two reports print, so 2026 CPL is back to the 2024 level, not a typo on this page.
Google Ads average CPC over the last few years
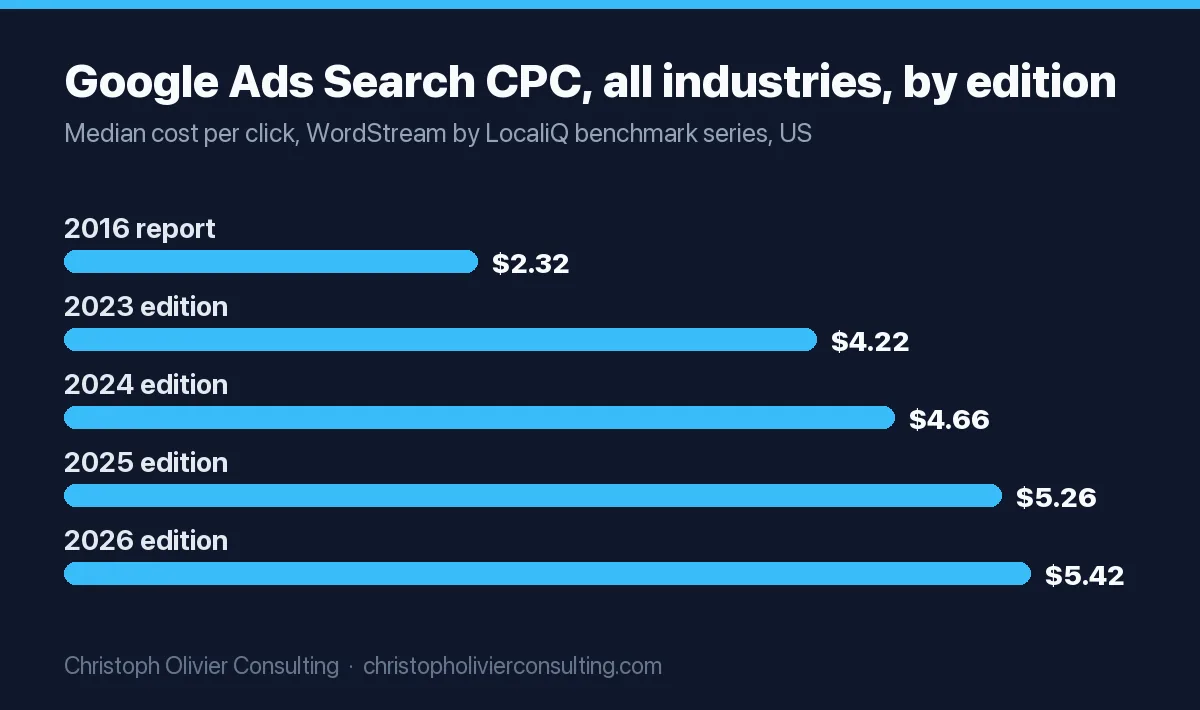
The all-industry median Search CPC in this benchmark series has more than doubled in a decade: $2.32 in the first report (2016), $4.22 in the 2023 edition, $4.66 in 2024, $5.26 in 2025 and $5.42 in 2026, per the 2026 and 2024 reports. Cost per lead moved far less, from $59.18 in 2016 to $66.69 in 2026, about 13%. Here is CPC by industry across the three most recent editions, which answers the 2024 benchmark queries too (the 2024 edition’s all-industry figures were 6.42% CTR, 6.96% conversion rate and $66.69 cost per lead):
| Industry | 2024 edition | 2025 edition | 2026 edition | Change, 2024 to 2026 |
|---|---|---|---|---|
| Animals & Pets | $3.90 | $3.97 | $4.06 | +4.1% |
| Apparel, Fashion & Jewelry | $3.39 | $4.31 | $4.44 | +31.0% |
| Arts & Entertainment | $1.72 | $1.60 | $1.63 | -5.2% |
| Attorneys & Legal Services | $8.94 | $8.58 | $9.87 | +10.4% |
| Automotive, For Sale | $2.34 | $2.41 | $2.27 | -3.0% |
| Automotive, Repair, Service & Parts | $3.39 | $3.90 | $4.35 | +28.3% |
| Beauty & Personal Care | $3.56 | $5.70 | $4.62 | +29.8% |
| Business Services | $5.37 | $5.58 | $5.87 | +9.3% |
| Career & Employment | $4.53 | $5.16 | $5.81 | +28.3% |
| Dentists & Dental Services | $6.82 | $7.85 | $8.00 | +17.3% |
| Education & Instruction | $4.39 | $6.23 | $4.81 | +9.6% |
| Finance & Insurance | $3.00 | $3.46 | $3.39 | +13.0% |
| Furniture | $3.29 | $3.86 | $3.97 | +20.7% |
| Health & Fitness | $4.71 | $5.00 | $6.17 | +31.0% |
| Home & Home Improvement | $6.96 | $7.85 | $8.33 | +19.7% |
| Industrial & Commercial | $4.95 | $5.70 | $5.87 | +18.6% |
| Personal Services | $4.95 | $5.81 | $7.17 | +44.8% |
| Physicians & Surgeons | $4.76 | $5.00 | $4.76 | +0.0% |
| Real Estate | $2.10 | $2.53 | $3.22 | +53.3% |
| Restaurants & Food | $2.18 | $2.05 | $2.05 | -6.0% |
| Shopping, Collectibles & Gifts | $2.61 | $3.49 | $4.14 | +58.6% |
| Sports & Recreation | $2.34 | $2.64 | $2.77 | +18.4% |
| Travel | $1.92 | $2.12 | $2.14 | +11.5% |
| All industries | $4.66 | $5.26 | $5.42 | +16.3% |
Across two years, Business Services rose 9.3%, slower than the all-industry 16.3%. The steepest two-year increases were Shopping, Collectibles and Gifts (+58.6%), Real Estate (+53.3%) and Personal Services (+44.8%). Finance and Insurance (+13.0%) and Attorneys and Legal Services (+10.4%) climbed less than the average.
Which number to cite (2025, 2026 or the year you mean)
The edition year is the publication year, not the year the clicks happened. That trips up a lot of decks and blog posts. Use this table to pick the right one:
| You are describing | Cite | Business Services CPC to quote |
|---|---|---|
| “Current” or “latest” Google Ads costs, written any time after June 2026 | 2026 edition (Apr 2025 to Mar 2026) | $5.87 |
| Calendar year 2025 performance | 2026 edition; it covers April to December 2025, nine of the twelve months | $5.87 |
| A source that says “2025 Google Ads benchmarks” in its title | 2025 edition (Apr 2024 to Mar 2025) | $5.58 |
| Calendar year 2024 performance | 2025 edition; it covers April to December 2024 | $5.58 |
| A trend line | Same category across editions, never a mix of studies | $5.37, $5.58, $5.87 |
A citation that survives a skeptical reader names the edition, the window and the method. Copy and adapt:
Business Services Search campaigns had a median CPC of $5.87 and a median cost per lead of $93.69 (WordStream by LocaliQ, 2026 Search Advertising Benchmarks, 13,474 US Google Ads and Microsoft Ads campaigns, April 2025 to March 2026).
Two details people get wrong when quoting it. First, the “averages” are medians: WordStream’s methodology note says “‘Averages’ are technically median figures to account for outliers.” Second, the data blends Google and Microsoft Ads; the 2024 edition disclosed the split as 80 to 85% Google, 15 to 20% Microsoft. The LocaliQ page labels the conversion rate figure as Google Ads.
How to use these benchmarks without fooling yourself
Do not divide CPC by conversion rate to get cost per lead
Each column is a separate median across campaigns, so the columns do not chain. Business Services’ $5.87 CPC divided by a 4.85% conversion rate gives $121.03, but the published median cost per lead is $93.69. The gap is bigger in some categories:
| Industry | Median CPC | Median CVR | CPC / CVR | Published median CPL |
|---|---|---|---|---|
| Business Services | $5.87 | 4.85% | $121.03 | $93.69 |
| Attorneys & Legal Services | $9.87 | 5.55% | $177.84 | $131.63 |
| Finance & Insurance | $3.39 | 2.64% | $128.41 | $74.44 |
| Industrial & Commercial | $5.87 | 8.20% | $71.59 | $75.19 |
| Career & Employment | $5.81 | 3.05% | $190.49 | $67.36 |
| Real Estate | $3.22 | 3.70% | $87.03 | $102.51 |
Use the CPL column when you want a cost per lead, and compare your own CPC, CVR and CPL to each column one at a time.
Match type changes what a “click” is
The benchmark blends every match type the sampled advertisers ran. Google describes broad match as “the most comprehensive” (ads may show on related searches), phrase match as reaching “fewer searches than with broad match,” and exact match as giving “the most steering over who views your ad” (Google Ads Help, keyword matching options). An exact match campaign on “management consultant for manufacturers” and a broad match campaign on “consulting” are both Business Services, and they will not cost or convert the same. Compare your campaign to the benchmark by match type, and check the search terms report before deciding your CPC is the problem. Running broad match without negatives is one of the common Google Ads mistakes that inflates cost per lead.
Location: the benchmark is a US median, your market is not
The sample is US-only and nationally blended. Your local auction can sit well above or below it. Before you plan around $5.87, pull your own keywords in Keyword Planner: Tools, Keyword Planner, Discover new keywords, then enter terms or your website (Google Ads Help). Set the location to your real service area. The two bid columns that matter are “Top of page bid (low range),” which Google’s API documentation defines as the 20th percentile, and “Top of page bid (high range),” the 80th percentile (Google Ads API reference). Our Keyword Planner guide walks through the settings.
Seasonality and the April to March window
Each edition is a twelve-month median running April to March, so it smooths over your peak and slow months. If you sell tax or year-end advisory work, your Q1 auction will not look like the annual median. Google says Keyword Planner forecasts are refreshed daily from the last 7 to 10 days of data, adjusted for seasonality (Google Ads Help), so run forecasts in the month you plan to spend, not once a year.
Campaign type and conversion definition
These are Search campaign numbers. Do not compare a Performance Max campaign to them. Google describes PMax as accessing “all Google Ads inventory” including YouTube, Display, Search, Discover, Gmail and Maps from a single campaign (Google Ads Help), so its blended CPC is not a Search CPC. Our Performance Max guide covers how to read its channel reporting. Also check what counts as a conversion. A “lead” in the benchmark is any tracked conversion. If your account counts page views or button clicks as conversions, your CVR will look great and mean nothing. Count form fills and qualified calls only. Each category also has a small floor: at least 52 campaigns per category in 2026, 64 in 2025.
Work out your own max CPC from close rate and deal value
The benchmark tells you what other advertisers pay. Your break-even CPC comes from your own numbers. Google charges no more than your maximum CPC bid per click, with exceptions for bid adjustments and some automated strategies (Google Ads Help, max CPC). Here is the arithmetic, using an illustrative consulting firm (swap in your own inputs):
- Gross profit per new client. Average first-year engagement $20,000 at 60% gross margin = $12,000.
- Value of one lead. Close rate from paid search lead to signed client 15%: $12,000 x 0.15 = $1,800 per lead.
- Allowable cost per lead. Decide how much of that you will spend to acquire it. At one third: $1,800 / 3 = $600.
- Break-even max CPC. Multiply by your landing page conversion rate. At the 4.85% Business Services median: $600 x 0.0485 = $29.10 per click.
- Sanity check. Compare $29.10 with the $5.87 median and with the top of page high range for your keywords in Keyword Planner. If your bids need to be far higher than your break-even, fix conversion rate or pick narrower keywords before raising the budget.
The same math as a lookup table:
| Allowable cost per lead | At 3.00% CVR | At 4.85% CVR | At 8.00% CVR |
|---|---|---|---|
| $300 | $9.00 | $14.55 | $24.00 |
| $600 | $18.00 | $29.10 | $48.00 |
| $1,000 | $30.00 | $48.50 | $80.00 |
Notice which lever moves more. Raising conversion rate from 3% to 8% multiplies the CPC you can afford by 2.7 at any lead value. That is why a firm with a strong landing page can outbid the median and still make money. To turn this into a monthly budget, work backward from the number of clients you need, as in how many leads you need, then check the result against the cost per lead benchmarks by industry.
In my experience the close rate is the input most firms guess at. Pull it from the CRM for the last 50 or 100 paid search leads before you trust any max CPC. If you want a second pair of eyes on the inputs, book a consultation.
Where these numbers come from
Every figure on this page comes from three editions of the same annual study, read directly from the reports:
- LocaliQ, Search Advertising Benchmarks (2026 data, last updated June 1, 2026) and WordStream, Google Ads Benchmarks 2026 (Susie Marino, last updated May 19, 2026): 13,474 US campaigns, April 1, 2025 to March 31, 2026, at least 52 campaigns per category.
- WordStream, Google Ads Benchmarks 2025 (last updated September 29, 2025): 16,446 US campaigns, April 1, 2024 to March 31, 2025, at least 64 per category.
- WordStream, Google Ads Benchmarks 2024: 17,998 US campaigns, April 1, 2023 to March 31, 2024, at least 70 per category, 80 to 85% of spend on Google Ads.
Year-over-year percentages are computed from the published two-decimal values and rounded to one decimal, so they can differ slightly from the changes WordStream states in its text. The study is drawn from LocaliQ’s customer base, so it reflects small and mid-sized advertisers using that platform, not every account on Google.
Frequently asked questions
What is the average Google Ads CPC for business consulting and services in 2026?
In the 2026 LocaliQ and WordStream Search Advertising Benchmarks, Business Services had a median CPC of $5.87, up 5.2% from $5.58 in the 2025 edition. The same category showed a 6.10% click-through rate, a 4.85% conversion rate and a $93.69 cost per lead. The study does not break out consulting separately, so Business Services is the closest published benchmark for consulting firms.
What are the LocaliQ 2025 search advertising benchmarks for average CPC and CTR?
The 2025 edition, covering 16,446 US campaigns from April 2024 to March 2025, reported an all-industry average CPC of $5.26 and CTR of 6.66%, with a 7.52% conversion rate and $70.11 cost per lead. CPC rose 12.88% that year. The newer 2026 edition reports $5.42 CPC and 6.64% CTR.
What were the 2025 Google Ads benchmarks for business services CPC and conversion rate?
In WordStream by LocaliQ's 2025 Google Ads Benchmarks, Business Services had a $5.58 average CPC, a 5.65% CTR, a 5.14% conversion rate and a $103.54 cost per lead, the third highest cost per lead of 23 industries that year. In the 2026 edition the same category moved to $5.87 CPC, 4.85% conversion rate and $93.69 per lead.
What is the WordStream average cost per lead by industry for 2025?
The 2025 edition put the all-industry cost per lead at $70.11. The highest were Attorneys and Legal Services at $131.63, Furniture at $121.51 and Business Services at $103.54. The lowest was Automotive Repair, Service and Parts at $28.50. In the 2026 edition the all-industry figure fell to $66.69, the first decline in five years.
What were the LocaliQ 2024 search advertising benchmarks for CTR and CPC?
The 2024 edition, based on 17,998 US campaigns from April 2023 to March 2024, reported an all-industry average CPC of $4.66 and CTR of 6.42%, with a 6.96% conversion rate and $66.69 cost per lead. Business Services that year had a $5.37 CPC, 5.62% CTR and $105.64 cost per lead.
How have Google Ads average CPC rates changed over the last few years?
In the WordStream by LocaliQ series, the all-industry median Search CPC went from $2.32 in the first 2016 report to $4.22 in the 2023 edition, $4.66 in 2024, $5.26 in 2025 and $5.42 in 2026. That is more than double in a decade, while cost per lead rose only about 13%, from $59.18 to $66.69.
How do I calculate the maximum CPC I can afford on Google Ads?
Multiply gross profit per new client by your lead-to-client close rate to get the value of a lead. Decide what share of that you will spend, which gives your allowable cost per lead. Multiply that by your landing page conversion rate. Example: $12,000 profit x 15% close rate = $1,800 per lead; a third is $600; at 4.85% conversion, max CPC is $29.10.