
Last reviewed: October 2026
There is no universal number. A small business needs exactly as many leads as its revenue goal requires once you divide by average deal value, close rate and lead qualification rate. In the illustrative examples on this page, that ranges from about 6 leads per customer for an HVAC replacement company to more than 150 for an IT services firm that counts every form fill as a lead.
This page gives you the reverse funnel formula, benchmark conversion rates from published datasets to sanity-check your inputs, three worked examples, a capacity check and a fill-in template. Every rate you plug in should eventually come from your own CRM. Benchmarks are a starting point, not a target.
Why “how many leads” has no single answer
The right lead count depends on four numbers unique to your business: your revenue goal, your average deal value, your close rate and the share of raw inquiries that become real sales conversations. Change any one of them and the answer moves. A firm closing 40% of consultations needs half the leads of a firm closing 20%.
That is why generic advice like “aim for 50 leads a month” misleads. Fifty leads is plenty for a business with a $15,000 average engagement and a strong close rate. It is nowhere near enough for one selling $300 jobs to cold traffic. The question to ask instead is: how many leads do I need to hit my number, given how my funnel actually converts?
Two more variables matter. The first is your definition of a lead. Some businesses count every newsletter signup, others count only booked calls. The second is your sales capacity. A lead target your team cannot work is just a bigger pile of unanswered inquiries.
The reverse funnel formula, step by step
Start with revenue and divide backward through each stage of your funnel. Revenue goal divided by average deal value gives customers needed. Customers divided by close rate gives qualified leads. Qualified leads divided by your lead-to-qualified rate gives total leads. Total leads divided by your visitor-to-lead rate gives the traffic you need.
- Customers needed = revenue goal ÷ average deal value. Use new-client revenue only, not repeat or retainer revenue you already have.
- Qualified leads needed = customers needed ÷ close rate. “Qualified” here means a held consultation, estimate or sales meeting with a good-fit prospect.
- Total leads needed = qualified leads ÷ lead-to-qualified rate. This is the share of raw inquiries (calls, forms, chats) that turn into a held meeting.
- Traffic needed = total leads ÷ visitor-to-lead rate. Use your website conversion rate, or the click-to-lead rate of a specific ad channel.
- Divide by 12 for a monthly target, then adjust for seasonality and for the length of your sales cycle. If deals take 60 days to close, this month’s leads produce revenue two months from now.
Always round up at each step. You cannot win 0.4 of a client, and rounding down compounds into a real shortfall by the top of the funnel.
Build three versions: a best case, an expected case and a worst case. The worst case is the number you plan marketing spend against. The best case tells you what improving conversion is worth.
Benchmark conversion rates by industry
Published benchmarks suggest that only a small fraction of raw leads become customers. Combining First Page Sage’s stage-by-stage industry data, a typical professional-service funnel converts well under 1% of all leads into customers, while HVAC converts about 3%. Your own numbers will differ, often by a lot.
The table below uses four reports from one source, the agency First Page Sage, which publishes rates drawn from its own and its clients’ data from 2019 through 2025. Each column comes from a separate report: website traffic-to-lead rate, lead-to-MQL rate, MQL-to-SQL rate and SQL-to-closed-won rate. The last two columns are my own arithmetic: the three stage rates multiplied together.
| Industry | Visitor to lead | Lead to MQL | MQL to SQL | SQL to customer (close rate) | Implied lead to customer | Leads per customer |
|---|---|---|---|---|---|---|
| HVAC services | 2.8% | 42% | 26% | 29% | 3.2% | ~32 |
| IT and managed services | 2.8% | 25% | 13% | 20% | 0.65% | ~154 |
| Legal services | 2.4% | 32% | 10% | 19% | 0.61% | ~164 |
| B2B SaaS | 2.5% | 39% | 13% | 12% | 0.61% | ~164 |
| Financial services | 2.5% | 29% | 13% | 16% | 0.60% | ~166 |
| Engineering | 2.2% | 35% | 11% | 14% | 0.54% | ~186 |
| Real estate | 2.8% | 27% | 10% | 14% | 0.38% | ~265 |
| Construction | 2.9% | 17% | 12% | 16% | 0.33% | ~306 |
Read these numbers with three caveats:
- Definitions drive the result. First Page Sage counts a “lead” broadly, defines an MQL as a lead in the target market that matches a buyer persona, and an SQL as a lead that met a salesperson and was judged a good fit. If you only count booked calls as leads, your lead-to-customer rate will be far higher than this table.
- It is agency client data, not a census. The sample skews B2B and SEO-heavy, and the reports do not publish sample sizes.
- Multiplying separate reports is an approximation. The stage rates were not measured on the same set of leads, so the implied column is a rough ceiling check, not a forecast.
The most useful column for a small service firm is usually the close rate. It is measured at the point where your process is most comparable to everyone else’s: a qualified prospect sat down with a salesperson. For more context on what “good” looks like at each stage, see our conversion rate benchmarks.
How many clicks it takes to get one lead from paid search
In paid search, the average click-to-lead conversion rate across industries was 8.18% in LocaliQ’s 2026 benchmarks, with an average cost per lead of $66.69. Service categories range widely, from 2.64% for finance and insurance to 12.43% for physicians and surgeons, so use your own category’s rate.
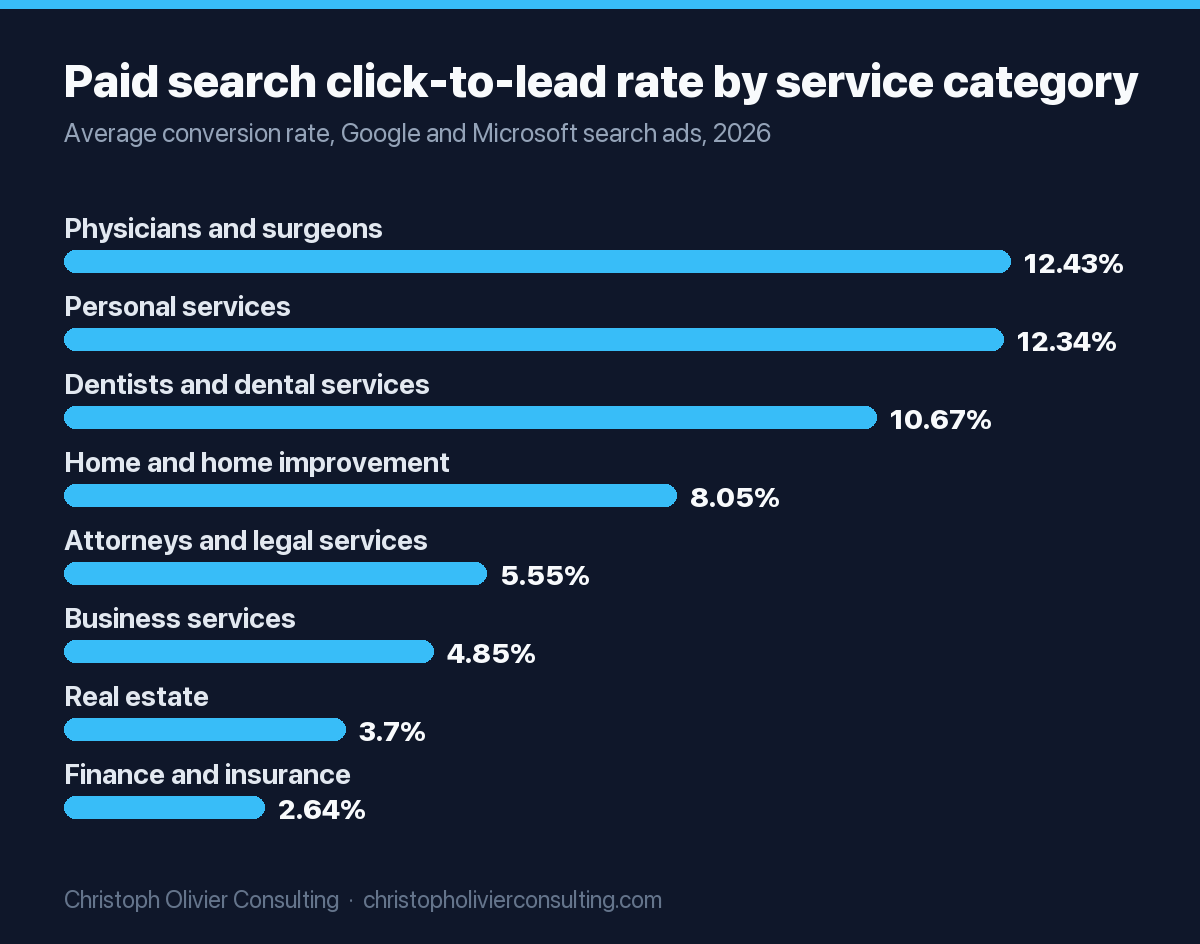
LocaliQ’s 2026 Search Advertising Benchmarks, compiled with WordStream from thousands of Google Ads and Microsoft Ads campaigns, give the cleanest public numbers for the “traffic needed” step. Here are the service categories most relevant to small professional and local firms:
| Business category | Average conversion rate (click to lead) | Average cost per lead | Clicks per lead |
|---|---|---|---|
| Physicians and surgeons | 12.43% | $40.04 | ~8 |
| Personal services | 12.34% | $54.60 | ~8 |
| Dentists and dental services | 10.67% | $72.97 | ~9 |
| Home and home improvement | 8.05% | $90.92 | ~12 |
| Attorneys and legal services | 5.55% | $131.63 | ~18 |
| Business services | 4.85% | $93.69 | ~21 |
| Real estate | 3.70% | $102.51 | ~27 |
| Finance and insurance | 2.64% | $74.44 | ~38 |
A lead in LocaliQ’s data means a call, chat, form fill or email, so it maps to the “total leads” step of the formula, not to qualified leads. Organic and referral traffic often converts differently. For a channel-by-channel view of what those leads cost, see our breakdown of average cost per lead by industry.
Three worked examples
Below are three illustrative service businesses. The revenue goals, deal values and lead-to-qualified rates are made up for illustration and labeled as such. The close rates and traffic conversion rates come from the cited benchmarks. Swap in your own numbers before you act on any of these.
Example 1: estate planning law firm
- New-client revenue goal: $480,000 (illustrative)
- Average matter value: $3,200 (illustrative)
- Close rate on held consultations: 19% (First Page Sage, legal services)
- Inquiry-to-consultation rate: 50% (illustrative)
- Click-to-lead rate: 5.55% (LocaliQ, attorneys and legal services)
The math: $480,000 ÷ $3,200 = 150 clients. 150 ÷ 0.19 = 790 consultations. 790 ÷ 0.50 = 1,580 inquiries, or about 132 a month. If every inquiry came from paid search, that would take roughly 28,469 clicks and, at the $131.63 benchmark cost per lead, about $208,000 in ad spend.
Now change one input. If this firm’s own records show a 40% consultation close rate, it needs 375 consultations and 750 inquiries, about 63 a month. At the same cost per lead, paid search spend drops to roughly $98,700. The close rate halves the lead target. That is the single most important lesson of the reverse funnel.
Example 2: residential HVAC replacement company
- Replacement revenue goal: $1,500,000 (illustrative)
- Average replacement ticket: $11,000 (illustrative)
- Close rate on in-home estimates: 29% (First Page Sage, HVAC)
- Inquiry-to-estimate rate: 60% (illustrative)
- Click-to-lead rate: 8.05% (LocaliQ, home and home improvement)
The math: $1,500,000 ÷ $11,000 = 137 jobs (rounded up). 137 ÷ 0.29 = 473 estimates, about 39 a month. 473 ÷ 0.60 = 789 inquiries, about 66 a month. From paid search alone, that is roughly 9,802 clicks and about $71,700 at the $90.92 benchmark cost per lead.
Seasonality matters here more than in most trades. Replacement demand tends to cluster in peak heating and cooling months, so a flat “66 a month” target will overshoot in shoulder months and undershoot in peak season. Spread the annual number across your own monthly history.
Example 3: managed IT services firm
- New annual contract value goal: $360,000 (illustrative)
- Average first-year contract: $24,000 (illustrative)
- Close rate on qualified sales meetings: 20% (First Page Sage, IT and managed services)
- Lead-to-meeting rate: 3.25%, which is 25% lead-to-MQL times 13% MQL-to-SQL (First Page Sage, First Page Sage)
- Website visitor-to-lead rate: 2.8% (First Page Sage, IT and managed services)
The math: $360,000 ÷ $24,000 = 15 clients. 15 ÷ 0.20 = 75 qualified meetings. 75 ÷ 0.0325 = 2,308 leads, about 192 a month. 2,308 ÷ 0.028 = 82,429 website visitors a year, about 6,869 a month.
This example uses benchmark rates at every stage, and it shows why. When “lead” means any form fill, the top of a B2B funnel gets very wide. Most small IT firms do not have 6,869 monthly visitors, which is why referrals, partnerships and direct outreach usually carry more weight than web traffic at this size.
How speed-to-lead and follow-up change the number
Faster response and disciplined follow-up raise your lead-to-qualified rate, which cuts the number of leads you need. In an HBR study of 2,241 US companies, firms that tried to contact a web lead within an hour were nearly seven times as likely to qualify it as those that waited even an hour longer.
The same Harvard Business Review study (Oldroyd, McElheran and Elkington, 2011) found that only 37% of companies responded within an hour, 23% never responded at all, and the average response time among those that did respond was 42 hours. Firms that contacted leads within an hour were more than 60 times as likely to qualify them as companies that waited 24 hours or longer.
Translate that into the formula. In Example 1, raising the inquiry-to-consultation rate from 50% to 60% drops the inquiry target from 1,580 to 1,317. That is 263 fewer leads a year, about 17%, with no extra marketing spend. You will not necessarily see a sevenfold gain; the study measured contact and qualification in a test setting. But the direction is consistent: response speed is a multiplier on every lead you already pay for.
Practical moves that usually raise this rate:
- Route every form and call to a named person with a response-time standard, ideally within the hour during business hours.
- Use a scheduling link in the first reply so a prospect can book without phone tag.
- Run a written follow-up sequence (calls, emails, texts) for inquiries that do not book on the first touch, and track where it stops working.
- Review lost leads monthly. Unanswered and unbooked leads are often the cheapest source of “new” leads you have.
Our speed-to-lead statistics page collects more of the research on response times.
The capacity check: can your team handle the leads?
A lead target is only valid if someone can work it. Divide the qualified meetings you need each week by the meetings one person can realistically hold. If the result exceeds the people you have, fix capacity before you buy more leads, or the extra leads will go cold.
Selling time is scarcer than most owners assume. In Salesforce’s State of Sales research (7,775 sales professionals surveyed in 2022), reps reported spending just 28% of their week actually selling. Owner-sellers and attorneys who also deliver the work often have even less.
Run the check on Example 1 (illustrative inputs):
- Consultations needed per year: 790.
- Working weeks per year: 48, so about 16.5 consultations a week.
- Hours one attorney can give to consultations each week: 10 (illustrative).
- Hours per consultation including prep and follow-up: 1.5 (illustrative), so about 6.7 consultations per attorney per week.
- Consultation capacity needed: 16.5 ÷ 6.7 = about 2.5 attorneys’ worth of consultation time.
If the firm has one attorney doing intake, the lead target is not the bottleneck. Options include a paralegal-run screening call, group information sessions, a higher price that lowers the client count needed, or improving the close rate so fewer consultations are required.
How many leads should a local business get per month?
A local business should get at least its annual lead requirement divided by 12, weighted by seasonality. For the illustrative examples above, that ranges from about 63 to 132 inquiries a month for a law firm and about 66 for an HVAC replacement company. Your figure depends entirely on your own deal value and conversion rates.
Local businesses have two advantages in this math. First, their inquiries tend to be high intent: someone calling a dentist or a plumber usually wants the service now, which may help explain why local service categories post some of the highest click-to-lead rates in the LocaliQ data. Second, their sales cycles are short, so a monthly target maps closely to monthly revenue.
The trap is counting the wrong thing. Track leads by source and by outcome, not just volume. Twenty inquiries from your Google Business Profile that book at 70% can be worth more than 60 directory leads that rarely answer the phone. If you need ideas for which channels to test first, our guide to small business lead generation covers the main options and what they suit.
What to do if you are short on leads
If your required lead count is higher than what you generate, fix conversion before buying volume. Raising close rate, booking rate or deal value lowers the target itself. Only then add channels, starting with the ones that convert best for your category and fit your budget and timeline.
- Audit the gap stage by stage. Compare your real rates with the benchmarks above. A stage far below the benchmark is usually cheaper to fix than buying more leads.
- Raise the close rate. Tighten your consultation or estimate process, qualify better before meetings, and follow up on every open proposal.
- Raise the booking rate. Respond faster and make booking easy. See the speed-to-lead section above.
- Raise average deal value. Packages, minimum engagements or a higher price point reduce the customers you need. A 25% increase in deal value cuts the customer count, and every number above it, by 20%.
- Add volume deliberately. Referral and partner programs, paid search, local SEO, content and outbound each have different costs and lead times. Paid search is fast but priced per lead; SEO and referrals are slower but compound.
- Re-run the formula quarterly. Your rates will move as you improve them, and so will the target.
For tactics behind step 5, see how to generate more leads.
Fill-in template: your lead target in 10 minutes
Copy this template, pull the last 12 months of data from your CRM or bookkeeping, and fill in each line. If you have no data for a stage yet, use the benchmark tables above as a placeholder and replace it once you have 90 days of your own tracking.
| Line | Input or formula | Your number |
|---|---|---|
| A. New-client revenue goal (12 months) | Input | $______ |
| B. Average deal value (first 12 months) | Input | $______ |
| C. Customers needed | A ÷ B, round up | ______ |
| D. Close rate (held meetings to customers) | Input, as a decimal | ______ |
| E. Qualified meetings needed | C ÷ D, round up | ______ |
| F. Lead-to-meeting rate | Input, as a decimal | ______ |
| G. Total leads needed | E ÷ F, round up | ______ |
| H. Visitor-to-lead (or click-to-lead) rate | Input, as a decimal | ______ |
| I. Traffic needed | G ÷ H, round up | ______ |
| J. Monthly lead target | G ÷ 12, then adjust for seasonality | ______ |
| K. Weekly meeting capacity check | E ÷ 48, compare with team capacity | ______ |
| L. Budget check (paid channels) | Paid share of G × your cost per lead | $______ |
Fill it in three times: with your worst-case, expected and best-case rates. The spread between worst and best case shows what a better sales process is worth in leads you no longer have to buy. For broader context on how other firms perform, our roundup of lead generation statistics is a good companion.
If you want a second pair of eyes on your inputs, or help building the plan to close the gap, you can book a consultation and we can work through your numbers together.
Frequently asked questions
How many leads does a small business need per month?
Divide your annual lead requirement by 12 and adjust for seasonality. Find the annual requirement by dividing your revenue goal by average deal value, then by close rate, then by the share of inquiries that become real sales meetings. In the illustrative examples on this page, that ranged from about 63 to 192 leads a month, depending on deal size and conversion rates.
What is the formula for how many leads I need?
Leads needed equals revenue goal divided by average deal value, divided by close rate, divided by lead-to-qualified rate. To find traffic needed, divide the lead count by your visitor-to-lead rate. Round up at every step, and build worst, expected and best cases so your marketing budget is planned against the conservative number.
What is a good lead-to-customer conversion rate?
It depends on how you define a lead. Multiplying First Page Sage's stage benchmarks gives roughly 0.3% to 0.7% for most professional-service and B2B industries and about 3% for HVAC, using a broad lead definition. Businesses that only count booked calls or quote requests as leads typically see much higher rates. Compare yourself against your own history first.
What is a typical close rate for service businesses?
First Page Sage's 2019 to 2025 client data shows SQL-to-customer close rates of 19% for legal services, 16% for financial services, 20% for IT and managed services and 29% for HVAC. These measure prospects who met a salesperson and were judged a good fit. Your own close rate on held consultations is the best input for the formula.
Does responding faster really reduce how many leads I need?
It can. A Harvard Business Review study of 2,241 US companies found that firms contacting web leads within an hour were nearly seven times as likely to qualify them as firms that waited longer. A higher qualification rate means fewer total leads for the same number of customers, without extra marketing spend.
What should I do if I cannot generate enough leads?
Work on conversion first: improve response speed, booking rate and close rate, and consider raising your average deal value. Each of those lowers the lead target itself. Then add channels deliberately, such as referrals, paid search or local SEO, based on cost per lead, speed and how well each converts for your category.
More Lead Generation guides
- Small Business Lead Generation: A Budget-First Playbook
- Average Cost Per Lead by Industry (2026 Benchmarks)
- 32 Lead Generation Statistics, Benchmarks, and Data Points for 2026
- How to Generate More Leads: 12 Tactics That Actually Work
- Lead Magnets for HVAC Companies: 6 Ideas That Capture Homeowners Early
- Lead Magnets for Financial Advisors That Pre-Qualify Prospects
- All Lead Generation guides →