

The U.S. Postal Service delivered 56.8 billion pieces of USPS Marketing Mail in fiscal year 2025, down 1.3% from 57.5 billion in FY2024 and 15% below the 67.1 billion of FY2022, according to the USPS FY2025 results release. For response rates, the most-quoted benchmark is the ANA Response Rate Report, whose 2024 edition put house lists at 5% to 9% and prospect lists at 4% to 5% (as summarized by Printing Impressions). The best free number for 2023 comes from USPS itself: households said they intended to respond to 8% of Marketing Mail ads, and to 16% of ads from companies they already buy from versus 2% from strangers.
Every figure below is linked to the document it came from, with the fiscal or survey year stated. Where a number only exists in a paywalled report, the page says so and tells you what you can cite instead.
The direct mail numbers people ask for most
| Question | Latest verified figure | Period | Source |
|---|---|---|---|
| How much advertising mail does USPS deliver? | 56.8 billion Marketing Mail pieces | FY2025 (Oct 2024 to Sep 2025) | USPS FY2025 results |
| Is direct mail volume still falling? | Yes: down 1.3% in FY2025, 3.2% in FY2024, 11.4% in FY2023 | FY2023 to FY2025 | USPS annual results releases |
| Long-run trend | 99 billion (FY2008) to 59 billion (FY2023), down 40% | FY2008 to FY2023 | USPS OIG, RISC-WP-24-008 |
| Average response rate, house list | 5% to 9% | ANA 2024 edition | Printing Impressions summary (secondary) |
| Average response rate, prospect list | 4% to 5% | ANA 2024 edition | Printing Impressions summary (secondary) |
| Share of households that read their ad mail | 39% read, 20% scan, 30% do not read | FY2023 | USPS Household Diary Study |
| Intended response to Marketing Mail ads | 8% yes, 12% maybe | FY2023 | USPS Household Diary Study |
| Marketers ranking mail as top channel | 79% of executives | 2025 survey | Lob and Comperemedia |
| Informed Delivery registered users | 83.7 million users in 56.4 million households | USPS file downloaded Nov 1, 2026 | USPS Informed Delivery data |
| Current Marketing Mail letter postage | $0.395 (automation 5-digit) | Effective since July 12, 2026 | USPS Notice 123 |
Which number to cite (and which to avoid)
Most direct mail statistics pages mix fiscal and calendar years, recycle 2018 benchmarks under a new year in the title, and quote vendor surveys as if they were industry censuses. Use this table to pick the right figure for the claim you are making.
| If you are claiming… | Cite this | Why | Do not cite |
|---|---|---|---|
| How big the channel is | USPS Marketing Mail volume by fiscal year (56.8 billion, FY2025) | Audited operating data, published every November | Market-size projections from report resellers |
| Whether mail is declining | USPS year-over-year change, or the OIG FY2008 to FY2023 series | Same counting method every year | Single-quarter changes, which are noisier than full-year totals |
| Typical response rate | ANA Response Rate Report, naming the edition (2024: house 5% to 9%, prospect 4% to 5%) | The only recurring cross-industry benchmark | “4.4%” with no edition or year attached |
| Whether people read mail | USPS Household Diary Study FY2023: 39% read, 20% scan | Diary of actual mail received by about 5,200 households | “90% open rate” claims with no study behind them |
| Customer vs prospect lift | HDS FY2023: 16% vs 2% intended response | Same survey, same year, same question | Mixing an ANA house figure with a vendor prospect figure |
| ROI | ANA 2021 edition press release: 112% ROI for letter-sized envelopes to prospect lists | Published by ANA itself, with method stated | A single ROI percentage with no edition, list type or format |
| Marketer sentiment | Lob and Comperemedia, stating sample size and year | Repeated annually with stated samples | Presenting survey agreement as measured ROI |
Direct mail volume trends: USPS Marketing Mail by fiscal year
USPS reports volume by fiscal year, which runs October 1 to September 30. So “FY2025” covers October 2024 through September 2025 and includes the run-up to the November 2024 election. The table uses the figure each year’s results release reports, taking the later release where USPS restated the prior year.
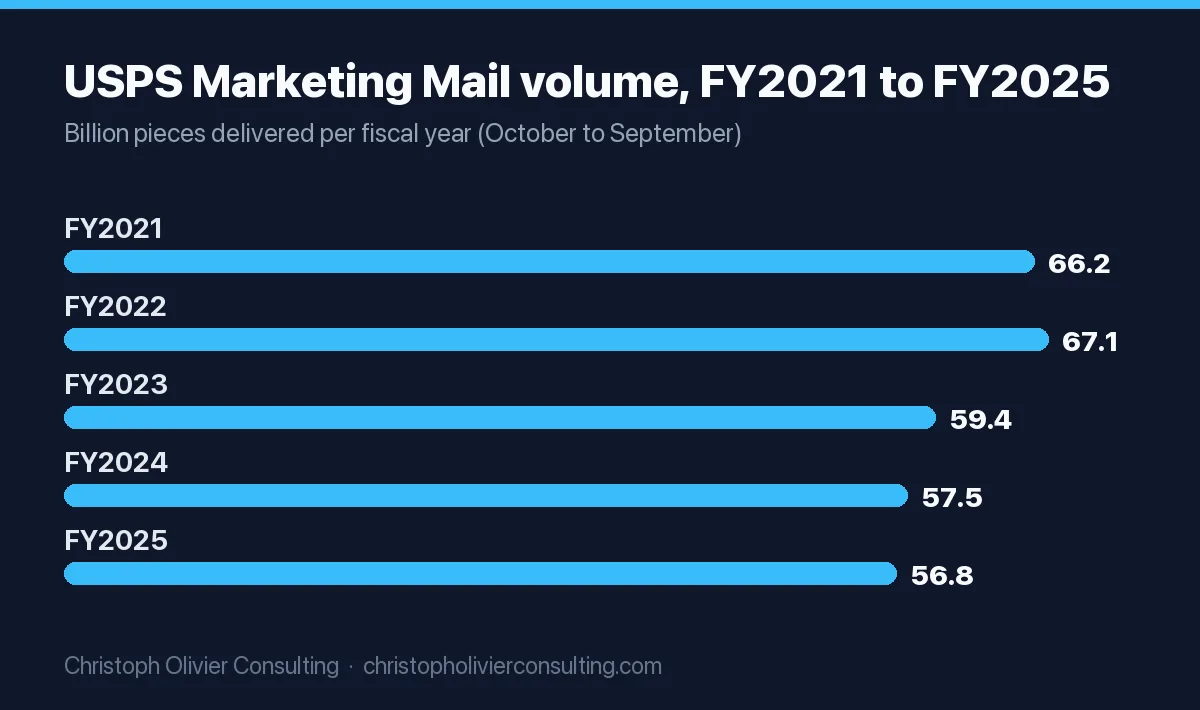
| Fiscal year | Marketing Mail (billion pieces) | Change | First-Class Mail (billion) | Total USPS volume (billion) | Marketing Mail revenue per piece |
|---|---|---|---|---|---|
| FY2021 | 66.2 | n/a | 50.7 | 128.8 | n/a |
| FY2022 | 67.1 | +1.4% | 49.0 | 127.4 | $0.238 |
| FY2023 | 59.4 | -11.4% | 46.0 | 116.1 | $0.254 |
| FY2024 | 57.5 | -3.2% | 44.3 | 112.5 | $0.267 |
| FY2025 | 56.8 | -1.3% | 42.0 | 108.7 | $0.277 |
Sources: USPS FY2022 results (FY2021 figures), USPS FY2023 results (FY2022 and FY2023), USPS FY2025 results (FY2024 and FY2025). Revenue per piece is our division of reported Marketing Mail revenue by reported volume: for FY2025, $15,734 million divided by 56,756 million pieces.
Three readings of this table matter for anyone planning a mail program:
- The big drop was FY2023. USPS said Marketing Mail fell 7.7 billion pieces, or 11.4%, and blamed mailers’ shift to digital and mobile advertising, lower ad spending and print inflation. The declines since have been 3.2% and 1.3%.
- Fewer pieces, more money per piece. Marketing Mail revenue rose 2.3% in FY2025 to $15.7 billion even as volume fell. Average revenue per piece climbed from $0.238 in FY2022 to $0.277 in FY2025, about 16%, so USPS is collecting more per piece while delivering fewer.
- Advertising mail is now most of the mail. Marketing Mail was 52% of all USPS volume in FY2025 (56.8 of 108.7 billion), and First-Class Mail is falling faster: down 5.0% in FY2025 versus 1.3% for Marketing Mail.
The longer view comes from the USPS Office of Inspector General’s Analysis of Historical Mail Volume Trends (RISC-WP-24-008, September 4, 2024): Marketing Mail fell 40% from 99 billion pieces in FY2008 to 59 billion in FY2023, while First-Class Mail fell 50%, from 92 billion to 46 billion. The OIG names “electronic diversion” as the main driver.
Where volume goes next: the OIG’s 2025 to 2035 projection
In Projecting Mail Volume (RISC-WP-25-003, June 2, 2025), the OIG and WIK Consult project that combined First-Class and Marketing Mail falls 29% in a baseline scenario, from 98.2 billion pieces in 2025 to 70.1 billion in 2035. The same report says Marketing Mail fell 20% over the prior ten years against 30% for First-Class. Its digital summary gives the Marketing Mail decline to 2035 under each scenario:
| OIG scenario | Marketing Mail decline, 2025 to 2035 |
|---|---|
| High economic growth, steady electronic diversion (best case) | 10% |
| Low economic growth, steady diversion | 25% |
| High economic growth, accelerated diversion | 28% |
| Low economic growth, accelerated diversion (worst case) | 42% |
For a mailer, that cuts both ways: less competition in the mailbox, and a postal network under financial pressure. The OIG’s historical paper notes that declining volume “reduces mail density,” making delivery to each address less profitable.
Direct mail response rates 2023: what actually exists for that year
If you searched for a 2023 response rate, here is the honest answer. ANA did publish an ANA Response Rate Report, 2023, dated February 22, 2024, and an ANA summary slide (March 4, 2024) says it “quantify[ies] the ROI of campaigns by their medium” across direct mail, email, social, paid search, SMS and display. The tables sit behind an ANA login, and the slide is reserved for members. Vendor sites quote format figures from it, for example directmail.io lists postcards at 5.7% and letter-sized envelopes at 4.3%, but we could not check those against ANA’s own document, so treat them as unverified.
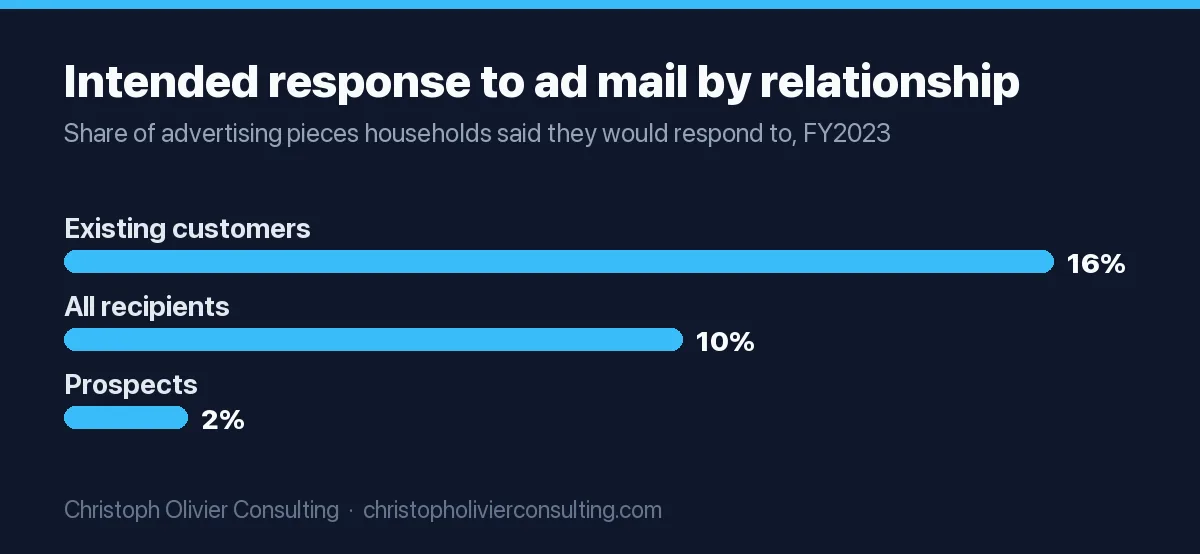
The year-specific data you can cite and link is the USPS Household Diary Study, Mail Use and Attitudes in FY2023 (May 2024, filed with the Postal Regulatory Commission on June 27, 2024). About 5,200 households logged every piece of mail they received for a week, and what they did with it.
| FY2023 measure (USPS Household Diary Study) | Result |
|---|---|
| Households that read their Marketing Mail ads | 39% (49% in 1987) |
| Households that scan them | 20% |
| Households that do not read them | 30% |
| Intended response, Marketing Mail ads | 8% yes, 12% maybe |
| Intended response, First-Class Mail ads | 11% yes, 10% maybe |
| Ads from a company with an existing relationship: read / intended response | 59% / 16% |
| Ads to prospects: read / intended response | 23% / 2% |
| All recipients: read / intended response | 42% / 10% |
| Catalogs: read / discarded | 39% / 22% |
| Credit card offers: read / discarded | 31% / 44% |
Two cautions. These are intended responses, and USPS notes they “are usually higher than actual response rates.” And the gap is the real finding: mail from a company the household already deals with was almost three times as likely to be read and eight times as likely to get a response as mail to a prospect. That matches the ANA pattern of house lists beating prospect lists in the editions with public figures.
ANA and DMA Response Rate Report editions, and what each one measures
Nearly every “average direct mail response rate” you see traces back to one of these editions, usually without saying which. The report carried the DMA name through the 2018 ANA/DMA edition, and ANA renamed it the Impact Pulse in 2025.
| Edition | Published | What it measures | What is publicly citable |
|---|---|---|---|
| ANA/DMA 2018 Response Rate Report | November 15, 2018 | Performance and cost metrics across direct media, by industry and channel | Nothing on ANA’s page without login; the widely repeated 9% house / 4.9% prospect split is relayed by third parties only |
| Response Rate Report 2021 | January 24, 2022 (press release) | Channel usage, ROI by medium and mail format, planned changes; online survey February to July 2021, 581 usable responses | Letter-sized envelopes 112% ROI (prospect lists), SMS 102%, email 93%; postcards best for house lists at 92% |
| 2022 edition (with Demand Metric) | November 30, 2022 | Benchmarks for the post-COVID year | Member exclusive; no public figures |
| 2023 edition | February 22, 2024 | ROI of campaigns by medium | Logged-in or member access only |
| 2024 edition | Not dated on a public ANA page | Not described on a public ANA page | House lists 5% to 9%, prospect lists 4% to 5%, per Printing Impressions (October 22, 2025), a secondary summary |
| 2025 Response Rate Report / Impact Pulse | July 23, 2025 | Benchmark data for media performance, segmented by business type; survey of senior marketers | Behind a free ANA login; public coverage on MediaVillage quotes email ROI (68%) and display CPA ($40.30) but no direct mail figures |
The ANA editions are self-reported surveys of marketers about their average campaign, not measured results from a fixed panel of mailings. Use them as directional ranges, and always name the edition year.
Direct mail ROI in 2025: what the surveys say
There is no audited, industry-wide direct mail ROI. What exists are marketer surveys, and they should be cited as such.
- Lob and Comperemedia, State of Direct Mail 2025: “79% of executives rank direct mail as the top-performing marketing channel,” down from 84% in 2024; 86% agree it performs best when integrated with other channels; 82% will increase direct mail investment in 2025; 83% of automotive and ecommerce companies say it delivers the best ROI. Sample: 405 professionals at North American companies with 500 or more employees (Lob 2025 report).
- Lob 2024 series: agreement that direct mail provides the highest ROI of any channel rose from 67% (2022) to 74% (2023) to 84% (2024); 82% planned to increase direct mail spend in 2024, up from 58% in 2023; 56% used a software platform to run campaigns, up from 40%. Sample: 250 marketers at North American companies with more than 1,000 employees (Lob release, January 17, 2024).
- Lob 2026: the only figure on the public page is that 87% of leaders call printing, shipping and delivery “major blind spots,” creating surprise costs for 82% of teams (Lob State of Direct Mail 2026).
- ANA: Printing Impressions reports that “the ANA reports that direct mail’s median ROI is 112%, compared to 93% for paid search and 89% for online display ads,” without naming the edition. The 112% figure matches the letter-to-prospect-list ROI in ANA’s own 2021 release, so cite that release if you need a primary source.
Note the sample changes: Lob’s 2024 survey covered companies with 1,000+ employees, its 2025 survey companies with 500+. The 84% to 79% move is partly a different group of respondents, not only a change in opinion.
Direct mail frequency statistics: how much mail households get
The Household Diary Study also answers how often people receive advertising mail, which is the context for any decision about how often to mail.
- In FY2023 households received almost 16 pieces of mail per week, and 8.4 of them were advertising (7.6 Marketing Mail, 0.8 First-Class ads).
- Households received 57.3 billion advertising pieces in FY2023, 59% of all household mail and 12.3% fewer than in FY2022.
- Advertising volume tracks income and age. Households earning over $100,000 got 10.6 ad pieces a week, against 4.9 for those under $35,000. Heads of household over 55 earning over $100,000 got 13.9 a week, the most of any group.
- Direct mail’s share of U.S. ad spending fell from 8.5% in 2015 to 3.9% in 2023, and direct mail spending fell 7% in 2023, per USPS calculations from GroupM data in the same report.
USPS has since replaced the diary with the Household Mail Survey; the 2025 report was filed with the Postal Regulatory Commission and the 2026 report is scheduled for March 2027. A Brookings analysis (July 9, 2026) of the survey series puts advertising at 62% of household mail in 2025, up from 59% in 2010, and mail per household at about 620 pieces a year in 2025, down from roughly 1,480 at the 2005 peak.
Direct mail response rates for financial institutions
No public source gives a verified response rate specific to banks, card issuers or advisors. What USPS does publish is who sends the mail and how it is treated:
- Financial companies were the largest senders of Marketing Mail advertising in FY2023: 12.8 billion pieces, 25% of the total. Credit card companies sent 34% of the financial industry’s volume.
- Financial firms also sent the most First-Class advertising: 2.0 billion pieces, 38% of that volume.
- Credit card offers are the least-read category: 31% of households read them and 44% discard them, against 39% read and 22% discarded for catalogs.
The practical takeaway for a financial practice is that the mailbox is crowded with offers from your own industry, and generic offers get thrown away. Mail to existing clients and warm referrals is where the 16% versus 2% gap works in your favor, and the wider channel numbers for advisors are in our financial advisor marketing statistics. If you are mailing seminar invitations to prospects, the response math is very different, and our guide to dinner seminar marketing for financial advisors works through how many invitations a 20-seat event needs.
Informed Delivery user counts
Informed Delivery emails subscribers a scan of their incoming letter mail, and mailers can add a clickable image and link. Summing the ZIP-level USPS Informed Delivery users and households file (downloaded November 1, 2026) gives:
| Measure | Value |
|---|---|
| Registered users | 83,651,369 |
| Registered households (delivery points with at least one user) | 56,406,791 |
| Users opted in to the Daily Digest email | 72,275,446 |
| Eligible delivery points | 149,846,739 |
| Household saturation (our calculation) | 37.6% |
| Average daily notification open rate | 63.4% |
| Campaign impressions, past year | 37.4 billion |
| Consumers satisfied or very satisfied | 92% |
The last three rows are USPS figures from its July 2025 to June 2026 Informed Delivery year in review. USPS says the eligible delivery point count in the file is “updated bi-annually,” so the saturation figure is approximate. Put simply, roughly a third of U.S. delivery points have someone signed up to preview incoming mail by email.
Postage price changes: July 2025, July 2026 and October 2026
| Effective | What changed | Key prices | Source |
|---|---|---|---|
| July 13, 2025 | Mailing services up about 7.4% on average | Forever stamp 73 to 78 cents; metered letter 69 to 74 cents; postcard 56 to 61 cents | USPS, April 9, 2025 |
| July 12, 2026 | First-Class Mail and USPS Marketing Mail each up 4.803% on average; Periodicals 6.803% (docket R2026-1) | Forever stamp 82 cents; metered letter 78 cents; postcard 65 cents | Federal Register notice; USPS Notice 123 |
| October 4, 2026 to January 17, 2027 | Time-limited holiday increase on Priority Mail Express, Priority Mail, Ground Advantage and Parcel Select only | No change to letters, postcards or Marketing Mail | USPS price change page; Digital Commerce 360 |
The current Notice 123, headed “Effective October 04, 2026,” lists Marketing Mail letter prices of $0.395 for automation 5-digit, $0.389 for carrier-route High Density and $0.255 for Saturation, with EDDM Retail at $0.260 per piece. Our direct mail marketing best practices guide has the full rate table and worked cost-per-piece examples for postcards, letters and catalogs.
Turn a response rate into a cost per response
A benchmark response rate is only useful once it is a dollar figure. Here is the arithmetic for a 5,000-piece letter mailing at the current automation 5-digit price.
- Postage: 5,000 x $0.395 = $1,975.
- Print, list and mail prep: use your own quote. For this illustration, assume $0.35 a piece, or $1,750.
- Total: $3,725, or $0.745 a piece.
- Cost per response at three rates:
| Response rate assumption | Where it comes from | Responses from 5,000 | Cost per response |
|---|---|---|---|
| 5% | Bottom of the ANA 2024 house-list range (secondary) | 250 | $14.90 |
| 2% | HDS FY2023 intended response for prospects (a ceiling, not a forecast) | 100 | $37.25 |
| 0.5% | A cautious planning floor for a cold list | 25 | $149.00 |
The 0.5% row is a planning assumption, not a published benchmark. The spread is the point: the same mailing costs ten times more per response to a cold list than to past clients. Mail your house list first, and test a prospect list with a holdout before you scale it. The direct mail playbook for accounting firms applies this to a targeted professional-services list, and if you want a second opinion on your own break-even rate, you can book a consultation.
Direct mail statistics to stop citing
| Claim | Where it circulates | The problem |
|---|---|---|
| “Direct mail averages a 4.4% response rate vs 0.12% for email” | Vendor stat roundups such as UPrinting’s list, which credits DMNews/DMA with no year | Traces to older DMA editions; current ANA editions report house and prospect ranges instead |
| “80% to 90% of direct mail gets opened” | Vendor blogs | No primary study; USPS’s own FY2023 diary shows 39% read and 20% scan |
| “95% engagement rate” | Stat roundups | Undefined metric and no traceable study |
| “2023 DMA Response Rate Report says 4.4%” | Aggregator sites | The 2023 edition was published by ANA, not DMA, and its tables are not public |
| A single “direct mail ROI” percentage | Most roundups | ROI varies by list and format; ANA’s 2021 release reports 112% for letters to prospects but 92% for postcards to house lists |
Frequently asked questions
What were direct mail response rates in 2023?
The ANA published a 2023 Response Rate Report in February 2024, but its tables are behind a login. The citable 2023 data is the USPS Household Diary Study for FY2023: households read 39% of Marketing Mail ads, intended to respond to 8%, and intended to respond to 16% of ads from companies they already knew versus 2% from prospects. Intended responses run higher than actual ones.
What is the average direct mail response rate?
The ANA 2024 Response Rate Report, as summarized by Printing Impressions, puts house lists at 5% to 9% and prospect lists at 4% to 5%. These are self-reported marketer averages, so treat them as directional. The often-quoted 4.4% figure traces to older DMA editions and should not be cited without an edition year.
How much direct mail does USPS deliver each year?
USPS delivered 56.8 billion pieces of Marketing Mail in fiscal year 2025, which ran from October 2024 to September 2025. That compares with 57.5 billion in FY2024, 59.4 billion in FY2023 and 67.1 billion in FY2022. Marketing Mail was about 52% of all USPS volume in FY2025.
Is direct mail volume declining?
Yes, but more slowly. Marketing Mail fell 11.4% in FY2023, 3.2% in FY2024 and 1.3% in FY2025. Over the longer run it fell 40% from FY2008 to FY2023, and the USPS Inspector General projects combined First-Class and Marketing Mail falling 29% from 2025 to 2035 in its baseline scenario.
What is the ROI of direct mail in 2025?
There is no audited industry figure. In Lob and Comperemedia's 2025 survey, 79% of executives ranked direct mail their top-performing channel. ANA's press release for its 2021 edition reported 112% ROI for letter-sized envelopes sent to prospect lists and 92% for postcards sent to house lists.
How many people use USPS Informed Delivery?
The USPS ZIP-level data file downloaded November 1, 2026 sums to 83.7 million registered users in 56.4 million households, with 72.3 million opted in to the daily email. That is about 37.6% of eligible delivery points. USPS reports a 63.4% average daily open rate for the notification emails.
Which industries send the most direct mail?
Financial companies sent the most Marketing Mail advertising in FY2023, 12.8 billion pieces or 25% of the total, according to the USPS Household Diary Study. Credit card companies sent 34% of the financial volume. The social sector, mostly nonprofit and political mail, was second with 11.3 billion pieces.
Channel benchmarks