

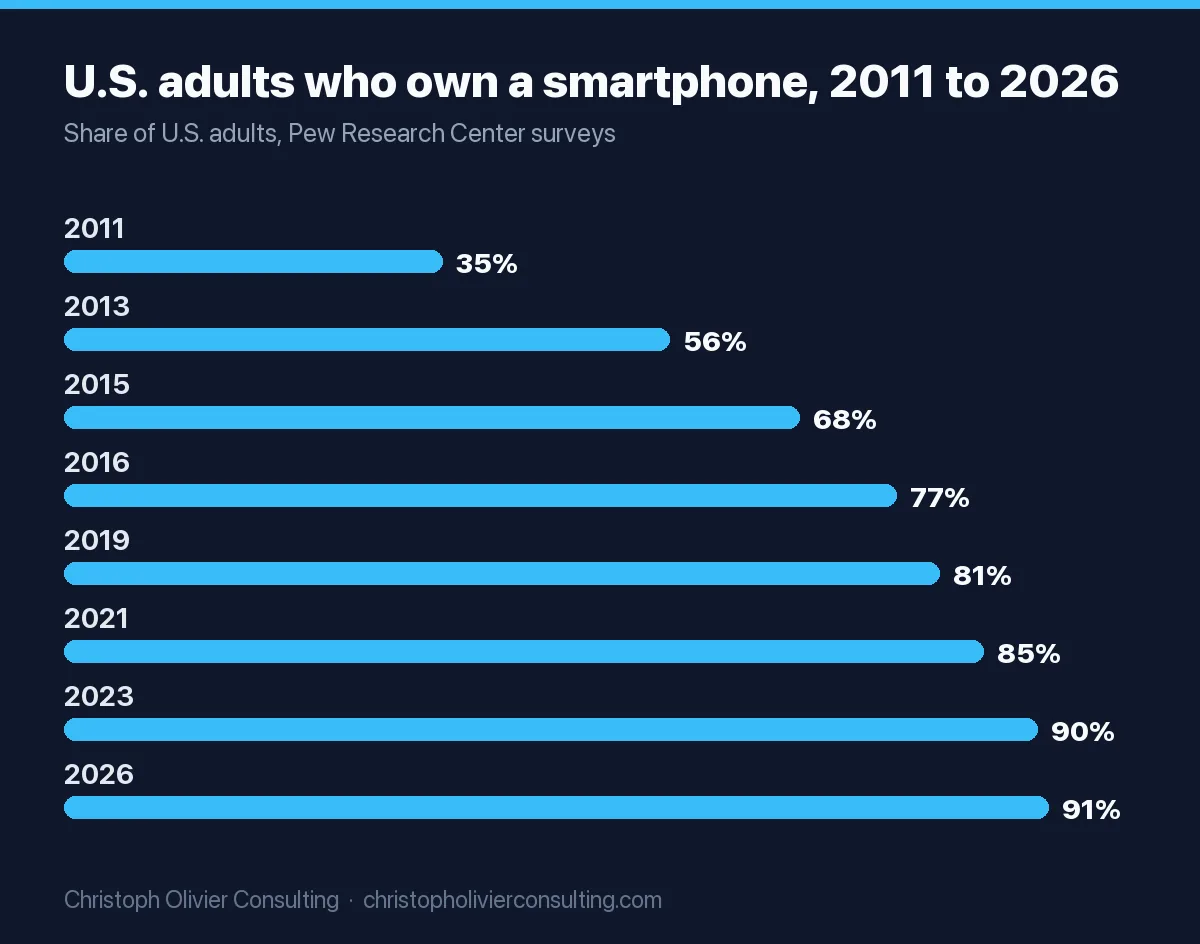
The mobile phone marketing statistics that hold up in November 2026: 91% of U.S. adults own a smartphone (Pew Research Center, 5,511 adults surveyed Jan. 30 to June 18, 2026), 5.78 billion people worldwide use a mobile phone (GSMA Intelligence via DataReportal, October 2025), and smartphones carried 56.4% of U.S. online holiday spending in 2025 (Adobe). Mobile’s share of web page views is 60.03% worldwide but only 45.56% in the United States in October 2026 (Statcounter), because page view counters cannot see time inside apps, where people spent 5.3 trillion hours in 2025 (Sensor Tower).
For mobile phone advertising statistics, one caveat up front: no free primary source publishes a current mobile share of U.S. ad spend. The IAB’s last public device split put mobile at 70% of U.S. internet ad revenue in 2020. Every figure below carries its source, sample, date and method. Anything measured before 2023 is labeled historical.
Mobile marketing statistics in one table: source, sample, date, method
| Statistic | Figure | Source | Sample | Date | Method |
|---|---|---|---|---|---|
| U.S. adults who own a smartphone | 91% (98% own any cellphone) | Pew Research Center, Mobile Fact Sheet | 5,511 U.S. adults | Jan. 30 to June 18, 2026; published Oct. 19, 2026 | Probability survey by web, mail or phone; margin of error 1.8 points |
| U.S. adults who are smartphone-only internet users | 16% | Pew Research Center | Pooled 2026 surveys | 2026 | Own a smartphone, no home broadband |
| Unique mobile users worldwide | 5.78 billion, 70.1% of the population, up 108 million in 12 months | GSMA Intelligence via DataReportal Digital 2026 | Global | October 2025; report published Oct. 15, 2025 | Operator data modeled by GSMA Intelligence |
| Smartphones as a share of handsets in use | 86.9% | Ericsson via DataReportal | Global | October 2025 | Vendor estimate |
| U.S. wireless connections | Nearly 603 million, about 1.8 per person; 46% of devices are not phones | CTIA 2026 Annual Survey Highlights | U.S. wireless industry totals | 2025; published September 2026 | Trade association annual industry survey |
| U.S. SMS and MMS messages | Nearly 2.2 trillion, 42 billion more than 2023 | CTIA 2025 Annual Survey Highlights | U.S. wireless industry totals | 2024; published September 2025 | Trade association annual industry survey |
| Mobile share of web page views, worldwide | 60.03% (desktop 38.34%, tablet 1.6%) | Statcounter Global Stats | 3 billion+ page views a month on 1 million+ sites | October 2026 | Page view tracking; revisable for 45 days |
| Mobile share of web page views, U.S. | 45.56% (desktop 52.2%) | Statcounter Global Stats | Same | October 2026 | Same |
| Mobile share of website sessions | 69.9% | Contentsquare 2026 Digital Experience Benchmark | 99 billion sessions, 6,500+ websites, 9 industries | Q4 2025 vs Q4 2024; published Feb. 25, 2026 | Analytics data from Contentsquare client sites |
| Desktop vs mobile conversion rate | Desktop 3.4%, 74% higher than mobile web (mobile about 2%) | Contentsquare | Same | Q4 2025 | Same |
| Smartphone share of U.S. holiday online spend | 56.4% (54.5% in 2024) | Adobe Analytics | 1 trillion+ visits to U.S. retail sites, 100 million SKUs | Nov. 1 to Dec. 31, 2025; released January 2026 | Transaction data from Adobe Analytics retail clients |
| U.S. e-commerce share of total retail | 17.1% ($340.2 billion, seasonally adjusted) | U.S. Census Bureau, Quarterly Retail E-Commerce | Monthly Retail Trade Survey plus administrative records | Q2 2026; released Aug. 18, 2026 | Government survey; includes m-commerce, no device split |
| App downloads, iOS and Google Play | Nearly 150 billion, up 0.8% | Sensor Tower State of Mobile 2026 | iOS App Store and Google Play | 2025; published Jan. 21, 2026 | Modeled app store estimates |
| Consumer spend in apps | $167 billion, up 10.6% | Sensor Tower | Same | 2025 | Same |
| Time spent in apps | 5.3 trillion hours, about 3.6 hours a day per mobile user | Sensor Tower | Same | 2025 | Same |
| U.S. internet ad revenue | $294.6 billion, up 13.9% | IAB/PwC Internet Advertising Revenue Report | Revenue reported by companies selling internet ads, plus public filings | 2025; released April 16, 2026 | Seller-reported, not audited; public release has no device split |
| Mobile share of U.S. internet ad revenue (historical) | 70%, unchanged from 2019 | IAB/PwC FY 2020 webinar deck | Same survey | 2020; published April 7, 2021 | Historical: last public IAB device split we found |
| U.S. digital ad spend tracked by Sensor Tower | $201 billion, up 15%; 19 trillion+ impressions | Sensor Tower State of Digital Advertising 2026 | Channels Sensor Tower tracks | Aug. 2025 to July 2026; published Sept. 15, 2026 | Modeled ad intelligence estimates |
| Weekly App Store visitors | 850 million+ | Apple Ads | App Store, worldwide | 2026 | Apple first-party data |
| Mobile sites passing all three Core Web Vitals | 48% (desktop 56%) | HTTP Archive Web Almanac 2025 | Chrome UX Report origins | July 2025 | Real-user Chrome field data |
All figures checked on the publishers’ own pages on 1 November 2026. Statcounter figures come from its CSV export that day.
Sensor Tower State of Mobile 2026: the headline figures, exactly as published
Sensor Tower published State of Mobile 2026 on January 21, 2026, with a free summary post by Jonathan Briskman, Director, Market Insights. The figures below are worded as Sensor Tower words them in that post. They cover iOS and Google Play for calendar 2025 and are modeled estimates, not numbers reported by Apple or Google.
| Metric | Sensor Tower’s figure for 2025 | Change |
|---|---|---|
| Total downloads | Nearly 150 billion, “surpassing the previous high from 2023” | Up 0.8% year over year |
| Revenue from in-app purchases and paid apps and games | $167 billion | Up 10.6% |
| Time spent in apps | 5.3 trillion hours, “roughly 3.6 hours per day per mobile user” | Up 3.8% |
| Non-game vs game revenue | Non-game in-app revenue passed games for the first time | Non-game up 21%; games up 1.3% to nearly $82 billion |
| U.S. consumer spend | Nearly $60 billion, the largest market by revenue | U.S. time spent up 4% |
| Generative AI app downloads | 3.8 billion | Doubled |
| Generative AI in-app revenue | More than $5 billion | Nearly tripled |
| Time in generative AI apps | 48 billion hours; sessions passed one trillion | About 3.6 times 2024, nearly 10 times 2023 |
| Category highlights | Credit and Lending downloads up 18%; sports betting downloads up 24% globally; Restaurant and Food Delivery apps up 14% | Year over year |
What is free and what is gated
- Free: the blog summary above, with no sign-up.
- Gated: the full report at sensortower.com/report/state-of-mobile-2026. The form asks for first name, last name, company and email. Sensor Tower describes it as an interactive report covering 10 industries and more than 20 markets.
- Only in the gated report: the landing page says the report covers “the gender distribution of Gen AI users” and “the ad networks that won gaming apps the most impressions.” Neither appears in the free post.
- Not in the free post at all: a mobile ad spend total, and any split of app time versus mobile web time. Sensor Tower’s ad figures sit in a separate report, covered in the advertising section below.
If you are using these download and revenue numbers to plan an app launch, the store-side levers (title, subtitle, keyword field, conversion rate) are laid out in our guide to app store optimization.
Mobile phone ownership and mobile user growth
In the U.S., ownership growth has stopped. Pew’s smartphone line rose from 35% in 2011 to 85% in 2021 and has read 91% in each of the 2024, 2025 and 2026 surveys. Pew notes a change in survey mode in 2023 (phone to web and mail), so compare pre-2023 and post-2023 points with care. The gaps that remain are by age, income and education, all from Pew’s 2026 survey:
| U.S. adult group (2026) | Own a smartphone | Own a cellphone but not a smartphone |
|---|---|---|
| Ages 18 to 29 | 97% | 1% |
| Ages 30 to 49 | 97% | 2% |
| Ages 50 to 64 | 91% | 6% |
| Ages 65 and older | 79% | 14% |
| Household income under $30,000 | 80% | 12% |
| Household income $100,000 or more | 98% | 1% |
| High school or less | 84% | 11% |
| Rural | 88% | 8% |
Source: Pew Research Center, survey of U.S. adults conducted Jan. 30 to June 18, 2026.
The marketing read: one in seven adults 65 and older carries a phone that is not a smartphone. They can receive a text but not your mobile landing page. Basic SMS reaches the 98% who own any cellphone, and the texting volumes, opt-in rates and click benchmarks are in our SMS marketing statistics.
Globally, mobile user growth is slow and steady. GSMA Intelligence counted 5.78 billion unique mobile users in October 2025, 70.1% of the world’s population, an increase of 108 million (1.9%) in 12 months, per DataReportal’s Digital 2026 report. Device counts are growing faster than people: CTIA’s 2026 survey puts U.S. wireless connections at nearly 603 million, and Americans used 159.3 trillion megabytes of wireless data in 2025, 20% more than in 2024.
Mobile vs desktop traffic: why the share is 45% or 70% depending on who counts
Two credible sources give very different answers. Statcounter counts page views on more than 1 million sites that run its tracking code, per its FAQ. Contentsquare counts sessions on more than 6,500 client websites across 9 industries. Neither sees time inside apps. Here is Statcounter’s device split from its CSV export:
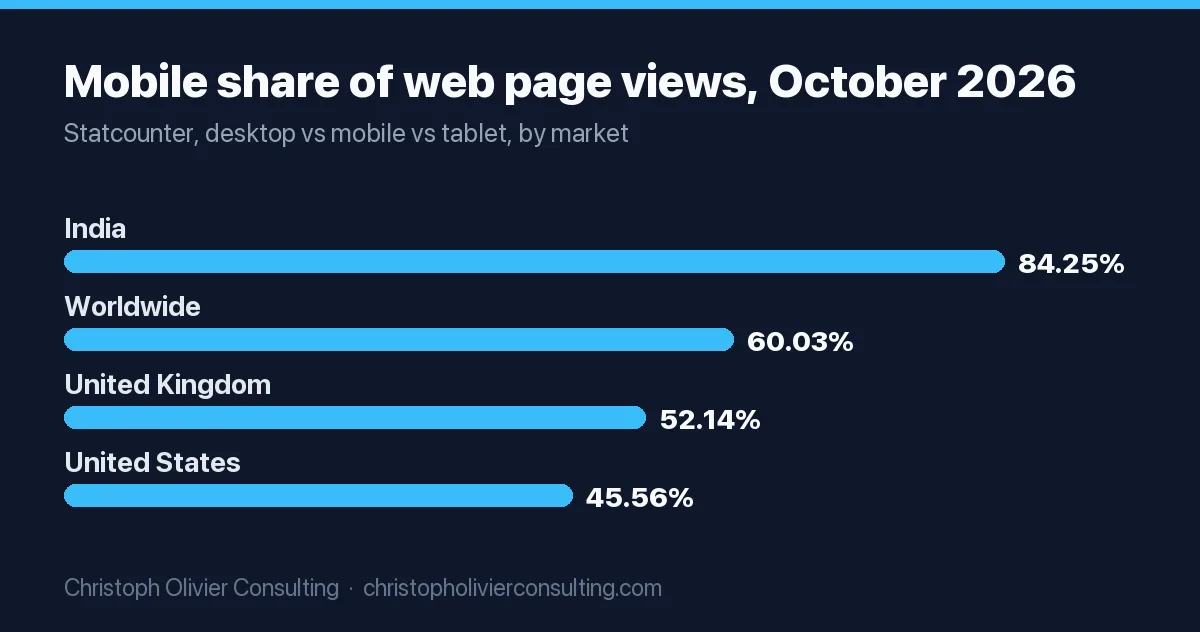
| Market | Mobile, Oct 2026 | Desktop, Oct 2026 | Mobile, Jan to Oct 2026 average | Mobile range, Oct 2024 to Oct 2026 |
|---|---|---|---|---|
| Worldwide | 60.03% | 38.34% | 53.28% | 48.98% (Oct 2025) to 63.11% (Jun 2025) |
| United States | 45.56% | 52.20% | 43.83% | 39.04% (Oct 2025) to 56.45% (Oct 2024) |
| United Kingdom | 52.14% | 43.29% | 48.55% | 44.84% (Jun 2026) to 57.65% (Aug 2025) |
| India | 84.25% | 15.13% | 70.39% | 64.31% (Aug 2026) to 84.25% (Oct 2026) |
Source: Statcounter Global Stats, desktop vs mobile vs tablet, monthly CSV export pulled 1 November 2026. Averages are our calculation from the monthly figures. Tablet and console make up the remainder.
Three things to know before you quote any of these:
- The monthly number is noisy. Worldwide mobile share moved from 49.33% in August 2026 to 59.03% in September 2026, a 9.7 point jump in one month. Our search engine market share page flagged an abrupt desktop shift in Statcounter’s search data in the same month. Use a multi-month average for planning.
- Figures get revised. Statcounter says its stats are “subject to quality assurance testing and revision for 45 days from first publication.” On 1 November 2026 its chart page headline read 59.9% mobile worldwide while the CSV export read 60.03%.
- U.S. websites still see more desktop page views than mobile. Statcounter’s U.S. desktop share was higher than mobile in 14 of the 15 months from August 2025 to October 2026; September 2026 was the exception. “Most web traffic is mobile” is true worldwide and on Contentsquare’s client panel (69.9% of sessions), not on Statcounter’s U.S. page view count.
Search is the clearest mobile channel. Google held 96.31% of mobile search worldwide and 94.10% of U.S. mobile search in October 2026, per Statcounter. Google also finished moving every site that works on phones to mobile-first indexing, announced on October 31, 2023. Sites that work on phones are now primarily crawled with Google’s smartphone crawler, so the mobile version of your page is the one that gets indexed.
Mobile phone advertising statistics: what is public and what is paywalled
The most quoted mobile ad numbers come from paid forecasts. EMARKETER’s mobile ad spending forecasts sit behind its PRO+ subscription, and we could not check them on a free page, so none appear here. These are the mobile advertising industry statistics you can verify and link:
| Mobile ad statistic | Figure | Source and date | Use it for |
|---|---|---|---|
| Total U.S. internet ad revenue | $294.6 billion in 2025, up 13.9%; social $117.7 billion, search $114.2 billion, digital video $78 billion | IAB/PwC, April 16, 2026 | Market size. No device split in the public release |
| Mobile share of U.S. internet ad revenue (historical) | 69.6% in 2019 ($86.7 billion); 70% in 2020, “unchanged since 2019” | IAB/PwC FY 2019 (May 2020); IAB/PwC FY 2020 deck (April 2021) | History only. Quote with the year |
| U.S. digital ad spend in tracked channels | $201 billion, Aug. 2025 to July 2026, up 15%; 19 trillion+ impressions, up 7% | Sensor Tower, Sept. 15, 2026 | Trend direction. Not comparable with IAB totals |
| Largest U.S. ad channel | Facebook, $42.9 billion over the same 12 months | Sensor Tower, Sept. 15, 2026 | Channel ranking |
| U.S. OTT streaming ad spend | $12 billion in the first seven months of 2026, up 17% | Sensor Tower, Sept. 15, 2026 | Video budget context |
| Apple search ads install rate | Over 60% tap-through install rate for ads at the top of search results | Apple Ads, Nov. 2024 to Oct. 2025, all Apple Ads countries | App install campaigns |
| Speed of App Store ad conversion | 95% of downloads after an ad tap happen within a minute | Apple Ads, August 2024 | App install campaigns |
| App Store downloads that follow a search (historical) | Almost 65%; 70% of visitors use search to discover apps | Apple Ads, App Store worldwide, 2022 | History only. Quote with the year |
The IAB and Sensor Tower totals measure different things. The IAB counts revenue that companies selling internet ads report to PwC; Sensor Tower models what advertisers spent in the channels it monitors. Sensor Tower’s own post gives both $200 billion (summary line) and $201 billion (body) for the same period. Quote $201 billion with the date range. Our US advertising industry statistics lay out the full IAB format tables and why ad spend and agency revenue cannot be compared.
Mobile commerce: Census totals and Adobe’s device split
The government figure has no device breakdown. The Census Bureau’s Q2 2026 release put U.S. retail e-commerce at $340.2 billion seasonally adjusted, 17.1% of total retail sales and up 12.2% from Q2 2025. Its definition includes orders placed on a “mobile device (M-commerce),” but it does not separate them. The Q3 2026 estimate is scheduled for November 19, 2026.
For the device split, Adobe’s holiday data is the most detailed public source. From Adobe’s release on the Nov. 1 to Dec. 31, 2025 season:
- U.S. consumers spent $257.8 billion online, up 6.8%.
- Smartphones drove 56.4% of online spend, up from 54.5% in 2024. That is about $145.4 billion (56.4% of $257.8 billion, our calculation).
- The most mobile days were Christmas Day at 66.5% and Thanksgiving Day at 61.6%.
- Smartphones drove 82.2% of the $20 billion spent through buy now, pay later.
- Returns ran the other way: 38.8% of returns happened on a mobile device.
People buy on the phone and return on the desktop. If your checkout or quote form only works well on a laptop, your peak days are the ones you lose. Cart, channel and conversion benchmarks for online stores sit in our ecommerce marketing statistics.
Mobile conversion rates and page speed
Contentsquare’s 2026 benchmark says desktop converts at 3.4%, which is 74% higher than mobile web; its own FAQ puts mobile at “around 2%.” Desktop accounted for 30% of visits but 47% of time spent. Mobile 30-day retention rose 10% year over year while desktop retention fell 7%.
Worked example, per 10,000 sessions on the benchmark mix. Mobile is 69.9% of sessions, so 6,990 mobile and 3,010 desktop. Mobile conversion is 3.4% divided by 1.74, or 1.95%.
- Mobile: 6,990 × 1.95% = 137 conversions
- Desktop: 3,010 × 3.4% = 102 conversions
- Mobile share of conversions: 137 ÷ 239 = 57%, from 70% of traffic
Mobile still delivers most conversions, just at a lower rate. Cutting mobile budget because the conversion rate is lower would cut the majority of your sales.
Speed is part of that gap. Only 48% of mobile websites passed all three Core Web Vitals in July 2025, against 56% on desktop, and 62% of mobile sites had a good Largest Contentful Paint against 74% of desktop sites, per the Web Almanac 2025. Google’s targets, judged at the 75th percentile of real visits, are LCP within 2.5 seconds, INP of 200 milliseconds or less and CLS of 0.1 or less (web.dev). Contentsquare found slow loads (over 3 seconds) dropped 20% year over year and now affect just under 11% of sessions. The full pass-rate history and fix checklist are on our page speed statistics page.
Worksheet: measure your own mobile gap against these benchmarks
Benchmarks matter only next to your own numbers. This takes about 15 minutes with your analytics.
- Pull 90 days by device. In GA4, build a report with the Device category dimension and the Sessions and Key events metrics. Use your main conversion (form fill, booked call, purchase).
- Mobile share, M. Mobile sessions divided by all sessions. Compare with your country’s Statcounter average (U.S. 43.83% for Jan to Oct 2026) and Contentsquare’s 69.9%.
- Conversion ratio, R. Mobile conversion rate divided by desktop conversion rate. The Contentsquare benchmark ratio is 1 ÷ 1.74 = 0.57.
- Conversions lost to the gap. If R is below 0.57: mobile sessions × desktop conversion rate × (0.57 minus R).
- Check field speed. Run your two most visited pages through PageSpeed Insights and read the mobile field data at the 75th percentile.
Hypothetical example for a professional-service firm: 12,000 sessions in 90 days, 7,200 on mobile (M = 60%). Mobile converts at 0.5% (36 form fills), desktop at 1.5% (72). R = 0.5 ÷ 1.5 = 0.33, well below 0.57. Closing the gap to the benchmark would add 7,200 × 1.5% × (0.57 minus 0.33) = about 26 form fills per quarter, a 24% lift on 108.
| Your result | What it means | What to do first | Threshold source |
|---|---|---|---|
| R below 0.57 | Your mobile funnel is weaker than the cross-industry gap | Fill in your own form on a phone; check field LCP of 2.5 seconds or less and INP of 200 ms or less | Contentsquare 2026; web.dev |
| R at or above 0.57 | Your device gap is normal | Put effort into traffic and offer, not mobile UX | Contentsquare 2026 |
| M above 69.9% | Your audience is more mobile than Contentsquare’s benchmark | Design for one thumb: tap-to-call, short forms, text follow-up | Contentsquare 2026 |
| M below your country’s Statcounter average | Desktop-heavy audience, common in B2B | Keep desktop layouts and search ads strong; do not move budget to mobile because of global stats | Statcounter 2026 |
| Many buyers aged 65+ | One in five does not own a smartphone | Keep a phone number and plain text messages in the journey | Pew 2026 (79% smartphone ownership) |
| Mobile pages fail Core Web Vitals | You are with the 52% of mobile sites that fail | Fix LCP first, the metric fewest mobile sites pass | Web Almanac 2025 |
My view: for most professional-service firms, R is the one number on this page worth calculating this week. If yours is well under 0.57 and you want a second pair of eyes on why, you can book a consultation.
Mobile stats to stop quoting, or quote with the year
| Popular claim | Where it comes from | Status | Quote this instead |
|---|---|---|---|
| “98% of text messages are read” | mobileSQUARED’s 2010 white paper “Conversational Advertising” | Its author wrote in 2022 that the figure no longer reflects reality; its newer estimate is 55% read | CTIA’s nearly 2.2 trillion U.S. messages (2024) plus your own click rates |
| “53% of mobile visits are abandoned after 3 seconds” | Google, “The need for mobile speed,” Sept. 8, 2016; Google Analytics data from 3.7K mobile sites, March 2016 | Historical | Web Almanac 2025: 48% of mobile sites pass Core Web Vitals |
| “Mobile is 70% of digital ad revenue” | IAB/PwC FY 2020 | Historical; no public device split since | IAB/PwC 2025 total of $294.6 billion, device split not public |
| “Almost 65% of App Store downloads follow a search” | Apple, App Store worldwide, 2022 | Historical, still on Apple’s page | Apple’s own 2024 to 2025 figures: over 60% install rate on top-of-search ads |
| “Desktop converts at 3.81%, mobile at 2.03%” | Repeated by older roundups, including the earlier version of this page, as Contentsquare 2025 | Not in Contentsquare’s 2025 press release, which gives no device figures | Contentsquare 2026: desktop 3.4%, 74% higher than mobile |
| “Two-thirds of U.S. digital ad spend is mobile” | Paid forecast data | Cannot be checked on a free page | Say “forecasts behind a paywall” or use the IAB history with its year |
Frequently asked questions
What are the key mobile phone marketing statistics for 2026?
91% of U.S. adults own a smartphone and 98% own a cellphone (Pew, 2026). 5.78 billion people use a mobile phone worldwide (GSMA Intelligence, October 2025). Smartphones drove 56.4% of U.S. holiday online spend in 2025 (Adobe). Mobile was 60.03% of worldwide web page views in October 2026 but 45.56% in the U.S. (Statcounter). People spent 5.3 trillion hours in apps in 2025 (Sensor Tower).
What are the latest mobile phone advertising statistics?
U.S. internet ad revenue reached $294.6 billion in 2025, up 13.9% (IAB/PwC, April 2026), but the public release gives no mobile split. The last public IAB split put mobile at 70% of revenue in 2020. Sensor Tower tracked $201 billion of U.S. digital ad spend from August 2025 to July 2026, up 15%, with Facebook the largest channel at $42.9 billion.
What does Sensor Tower's State of Mobile 2026 report say?
Published January 21, 2026, it reports nearly 150 billion iOS and Google Play downloads in 2025 (up 0.8%), $167 billion in consumer spend (up 10.6%) and 5.3 trillion hours in apps, roughly 3.6 hours a day per user. Non-game apps out-earned games for the first time. Generative AI downloads doubled to 3.8 billion. The summary is free; the full report needs a name, company and email form.
What percentage of web traffic comes from mobile phones?
It depends on the counter. Statcounter's page view data put mobile at 60.03% worldwide and 45.56% in the U.S. in October 2026, with large month-to-month swings. Contentsquare's 2026 benchmark, built on 99 billion sessions across 6,500+ client websites, put mobile at 69.9% of sessions. Neither counts time spent inside apps.
How fast is mobile user growth?
Slow. GSMA Intelligence counted 5.78 billion unique mobile users in October 2025, up 108 million or 1.9% in a year, about 70.1% of the world's population. In the U.S., Pew's smartphone ownership figure has held at 91% in 2024, 2025 and 2026. Growth now comes from connected devices: CTIA counts nearly 603 million U.S. wireless connections.
Do mobile users convert worse than desktop users?
Yes, per session. Contentsquare's 2026 benchmark puts desktop conversion at 3.4%, 74% higher than mobile web at around 2%. But mobile carries 69.9% of sessions, so on that mix it still produces about 57% of conversions. Compare your own mobile to desktop conversion ratio with the benchmark ratio of 0.57 before cutting mobile spend.
Where do these mobile statistics come from?
Each figure links to its publisher: Pew Research Center and the Census Bureau for U.S. surveys, CTIA for wireless industry totals, Statcounter and Contentsquare for traffic, Adobe Analytics for holiday spending, Sensor Tower for apps and ad spend, IAB/PwC for ad revenue and the HTTP Archive for page speed. Each row lists the sample, date and method.
Channel benchmarks