

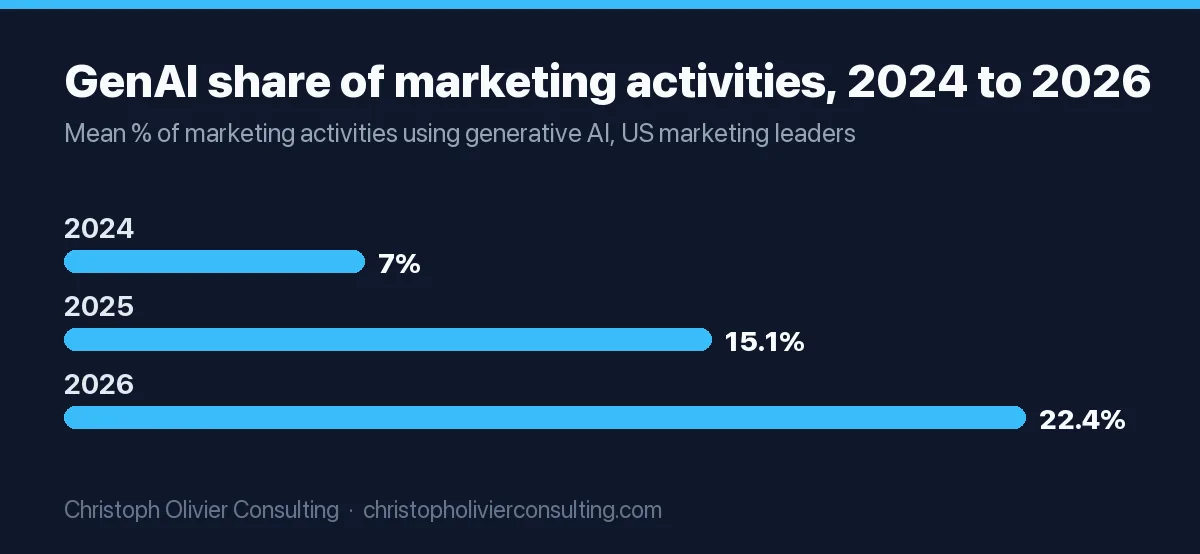
How many marketers are using generative AI? Most of them, for a minority of the work. In the January 2026 CMO Survey of 308 US marketing leaders, 88.2% of responding companies used generative AI in at least some marketing activity, yet it handled a mean of only 22.4% of those activities. Salesforce’s 10th State of Marketing (4,450 marketers) puts AI use at 75%, and HubSpot’s 2026 vendor survey reports 98% of marketing teams using AI in some form.
Measured ROI is much thinner than adoption. Only 37% of respondents in McKinsey’s State of AI 2026 attribute any EBIT impact to AI. The strongest controlled evidence covers writing speed (40% less time in a randomized study published in Science), customer support (15% more issues resolved per hour) and fully AI-generated display ads (up to 19% higher click-through in a field test). For AI-automated ad buying, independent holdout tests are mixed.
Every figure below carries its evidence type: Survey (self-reported), Measured (randomized or holdout-controlled), Platform-stated (an ad platform’s internal data) or Company-stated (no published method).
How many marketers are using generative AI in 2026
The answer ranges from 19.8% to 98% because each source counts something different: all US businesses, marketing teams, individual marketers, or the share of marketing work. Read the “what it counts” column before you quote a number.
| Source | Who was asked | Fieldwork | Headline figure | What it counts |
|---|---|---|---|---|
| The CMO Survey, 35th edition (Duke Fuqua, Deloitte, AMA) | 308 US marketing leaders, 97% VP-level or above | Jan 7 to 29, 2026 | 88.2% use generative AI at least some of the time; mean share of activities 22.4% | Companies, and how much of the work (Survey) |
| Salesforce State of Marketing, 10th edition | 4,450 marketing decision makers, 26 countries | Oct 8 to Nov 17, 2025 | 75% “using AI”; 13% using agentic AI | Marketers, any AI (Survey, vendor) |
| HubSpot 2026 State of Marketing | 1,500+ marketers | Not stated | 86.4% of teams use AI in at least a few marketing areas; 1.7% neither use nor plan to | Teams (Survey, vendor) |
| HubSpot 2026 State of AI in Marketing | 1,754 marketers in five regions | Not stated | 98% use AI in some form; only 10% at “transformational” maturity | Teams (Survey, vendor) |
| McKinsey, The state of AI in 2026 | 1,719 participants, 97 nations, all functions | May 4 to June 8, 2026 | Nearly nine in ten report regular AI use in at least one business function | Organizations, any function (Survey) |
| Gartner CMO survey | 402 CMOs | Aug to Oct 2025 | AI-driven automation covers 16% of marketing work in 2026, expected 36% by 2028 | Share of marketing work (Survey) |
| US Census Bureau, Business Trends and Outlook Survey | US businesses of all sizes | Dec 14, 2025 to May 3, 2026 | 19.8% use AI in any business function | All firms, not marketing only (Survey, official) |
The 88.2% is our calculation from the CMO Survey Topline distribution: 22 of 187 companies (11.8%) answered that they use generative AI 0% of the time in marketing. The same distribution shows how shallow use still is. 47.1% of companies use generative AI in 15% or less of their marketing activities, and only 6.4% use it in more than half.
The Census figure looks low next to the marketing surveys because it covers every US employer, including very small firms. Among firms with 250 or more employees, Census found 37% using AI, against under 20% for firms with four or fewer employees. Marketing surveys sample larger, more digital companies, so they run higher.
How fast AI use in marketing is growing
The CMO Survey asks the same two questions every year, which makes it the cleanest trend line for US marketing. According to its 2026 Highlights and Insights Report:
- AI and machine learning were used in 13.1% of marketing activities in 2024, 17.2% in 2025 and 24.2% in 2026. Leaders project 55.9% within three years.
- Generative AI rose from 7.0% of marketing activities in 2024 to 15.1% in 2025 and 22.4% in 2026, a 220% increase over two years.
- Gartner’s separate CMO sample expects AI-driven automation of marketing work to more than double, from 16% in 2026 to 36% by 2028.
Projections are expectations, not outcomes. In McKinsey’s 2026 survey, just 14% of respondents from AI-using organizations reported an AI-driven decline in workforce over the past year, less than half the 32% who had expected reductions a year earlier. Treat any “AI will do half of marketing by 2029” headline the same way.
Which AI solutions have the highest measurable impact on marketing workflows
Ranked by the strength of the evidence, not by how often a vendor repeats the claim. Only studies with a control group or a holdout make the list. Note that every controlled result measures productivity or a media metric. None measures marketing ROI end to end.
- AI drafting for writing tasks: 40% less time, 18% higher quality. In a preregistered experiment published in Science (Noy and Zhang, July 2023), 453 college-educated professionals, including marketers, grant writers, consultants, data analysts, HR professionals and managers, were given occupation-specific writing tasks, and half were randomly given ChatGPT. Average time fell 40% and evaluator-scored quality rose 18%, per MIT’s summary. Measured, lab setting.
- AI assistants for customer conversations: 15% more issues resolved per hour. Brynjolfsson, Li and Raymond (Quarterly Journal of Economics, 2025) studied a staggered rollout of a generative AI assistant across 5,172 customer-support agents. Productivity rose 15% on average, with the largest gains for less experienced agents and small quality declines for the most skilled. Measured, real workplace.
- AI for analysis and ideation tasks: 25.1% faster, 12.2% more tasks done. In the “jagged frontier” experiment with Boston Consulting Group, 758 consultants were randomly assigned GPT-4 access across 18 realistic tasks from creative to analytical. AI users finished 12.2% more tasks, 25.1% faster, with higher quality. On one task chosen to sit outside AI’s abilities, AI users were 19% less likely to reach a correct answer. Measured.
- Fully AI-generated display ads: up to 19% higher click-through. A working paper by Lee, Todri, Adamopoulos and Ghose, summarized by Compass Lexecon in November 2025, combined a lab experiment with a field study on the Google Display Network (per The Decoder). Ads created end to end by AI raised click-through by up to 19%. Ads where AI only edited a human design showed no significant improvement, and disclosing AI involvement cut effectiveness by up to 31.5%. Measured, not yet peer reviewed.
- AI-automated campaign buying: mixed once you measure incrementality. Across 640 Meta incrementality tests run on the Haus platform since early 2024, Advantage+ campaigns showed 2.4% higher ROAS than manual campaigns in Meta’s own reporting, but 12% lower incremental ROAS for direct-to-consumer brands. Manual won for 58% of brands in head-to-head tests. Measured, by a measurement vendor.
Google’s claim for AI Max for Search shows why the evidence type matters. Google says advertisers who turn it on “typically see 14% more conversions or conversion value at a similar CPA/ROAS,” based on Google internal data from 2025 that excludes retail advertisers (Platform-stated). An independent analysis of 250+ campaigns by Smarter Ecommerce, reported by Search Engine Land in March 2026, found median revenue up 13% but median CPA up 16%, with ROAS ranging from 42% better to 35% worse. If you run Google’s automated campaign types, our Performance Max guide covers how to keep them accountable.
Where ROI evidence is weak: personalization, GEO, marketing automation platforms, AI agents and predictive analytics. For these, the public evidence is self-reported surveys and vendor case studies without control groups. That does not mean they fail. It means nobody has published a controlled test you can cite.
AI use cases by adoption and measured impact
Adoption comes from the CMO Survey (188 US companies answering, January 2026, 95% confidence intervals up to about plus or minus 7 points). Measured impact is the best controlled evidence found for that use case. Grades follow the rubric in the next section.
| Use case | Companies using it (2026) | Change since fall 2023 | Best measured evidence | Grade |
|---|---|---|---|---|
| Content creation | 73.9% | +24.7 pts | Writing tasks: 40% less time, 18% higher quality (Noy and Zhang, Science) | A, productivity only |
| Content personalization | 65.4% | +12.6 pts | McKinsey says personalization “most often drives 10 to 15 percent revenue lift” (2021). Not AI-specific, no published method | C |
| Optimizing content and timing for ROI | 49.5% | +12.9 pts | No controlled public study found | D |
| Marketing automation | 48.9% | +20.9 pts | Gartner CMOs expect automation of 16% of work now, 36% by 2028 (expectation, not result) | C |
| Data analysis and reporting | 46.3% | +21.5 pts | Knowledge tasks: 25.1% faster, 12.2% more completed; 19% less accurate outside AI’s abilities (BCG experiment) | A, productivity only |
| Targeting decisions | 45.2% | +13.5 pts | Meta Advantage+: 12% lower incremental ROAS than manual on average, 640 tests (Haus) | A |
| Predictive analytics for customer insights | 41.5% | +8.6 pts | No controlled public study found | D |
| Generative engine optimization (GEO) | 41.5% | New in 2026 | No ROI study found; visibility data only | D |
| Conversational AI for customer service | 39.9% | Not in 2023 comparison | 15% more issues resolved per hour, 5,172 agents (QJE) | A |
| Customer segmentation | 35.6% | +14.1 pts | No controlled public study found | D |
| Programmatic advertising and media buying | 32.4% | down 2.6 pts | Google AI Max: 14% more conversions (Google data) vs. median CPA 16% higher (250+ campaigns, independent) | B |
| Listening and sentiment analysis | 28.2% | +14.0 pts | No controlled public study found | D |
| AI-generated ad images (not a CMO Survey category) | n/a | n/a | Up to 19% higher click-through for fully AI-created ads; disclosure cut effectiveness up to 31.5% (working paper) | A, not peer reviewed |
Change figures compare the CMO Survey’s fall 2023 and 2026 editions as published in its 2026 Highlights report. The pattern is plain: the use cases growing fastest (content, automation, analysis) are the ones with productivity evidence, and the ones closest to revenue (personalization, ROI optimization, segmentation) have the least controlled proof.
How to grade an AI ROI claim before you repeat it
Use this rubric on any AI marketing statistic, including the ones on this page. It is the fastest way to answer “is this real data?” when a board member or a chatbot hands you a number.
| Grade | Evidence type | Test it passes | Example | Safe to say |
|---|---|---|---|---|
| A | Randomized experiment or holdout | A control group that did not get the AI, and a named method | Noy and Zhang; Haus incrementality tests | “Caused,” with the setting stated |
| B | Platform-stated | Named data source and scope, but no published design | Google AI Max 14% (internal data, non-retail) | “Google reports” |
| C | Self-reported survey | Named sample, field dates, question wording | CMO Survey, McKinsey, Gartner, Salesforce, HubSpot | “Leaders say” or “respondents report” |
| D | Company-stated or untraceable | None of the above | Klarna’s AI savings; most roundup ROI multiples | Quote as a claim, or drop it |
To produce your own grade-A number, run a holdout instead of reading a dashboard:
- Pick one AI change and one primary metric, for example AI-generated ad creative and cost per qualified lead.
- Split comparable units at random: campaigns, regions or audiences. Keep the control on the old method.
- Decide the test length and the minimum lift that would change your decision before launch.
- Measure incremental results, not platform-attributed ones. Haus found Advantage+ looked 2.4% better in Meta’s reporting while delivering 12% lower incremental ROAS.
- Calculate incremental ROAS: (test revenue minus control revenue, scaled to the same spend) divided by test spend.
Worked example: a test region spends $20,000 and books $90,000 in revenue. A matched control region with the same spend books $70,000. Incremental revenue is $20,000, so incremental ROAS is $20,000 / $20,000 = 1.0, even though the platform might report the full $90,000 / $20,000 = 4.5. For channel-level questions where holdouts are impractical, marketing mix modeling is the usual alternative.
Self-reported AI results: what marketing leaders say they get
These are grade C. They tell you what leaders believe, which shapes budgets, but they cannot separate AI’s effect from everything else that changed.
| Reported outcome | Figure | Source |
|---|---|---|
| Improvement in sales productivity from AI in marketing | Mean 14.1% in 2026, up from 8.6% in 2025 | CMO Survey (156 companies answering) |
| Reduction in marketing overhead costs | Mean 14.6% in 2026, up from 10.8% in 2025 | CMO Survey (160 answering) |
| Improvement in customer satisfaction | Mean 10.8% in 2026, up from 8.5% in 2025 | CMO Survey (152 answering) |
| Organizations attributing any EBIT impact to AI | 37%, about the same as 2025 | McKinsey 2026 |
| “AI high performers” (5%+ of EBIT from AI and “significant” value) | About 6%, flat since 2025 | McKinsey 2026 |
| Respondents saying AI improved their own productivity | 80% | McKinsey 2026 |
| Average ROI bump for agentic AI adopters | 20% (no method published) | Salesforce, Feb 17, 2026 |
| Marketers saying AI makes revenue and MQL targets easier to hit | 72% | HubSpot 2026 State of AI in Marketing |
| Marketers who know how to measure AI’s impact | 67.5%, up from 48% in 2025 | HubSpot 2026 State of Marketing |
The medians in the CMO Survey are lower than the means: 10% for sales productivity and overhead, 5% for customer satisfaction. A few large self-reported gains pull the averages up. McKinsey adds one useful pointer for anyone asked “how are marketing leaders measuring ROI on AI”: revenue gains are most often attributed to AI use in marketing and sales, and AI high performers are twice as likely to have defined processes to measure the impact of their AI initiatives. HubSpot, a vendor with tools to sell, still reports that at least a third of marketers cannot confidently say their AI investment pays off.
What comparable enterprises spend on AI in marketing
If you need a public benchmark for planned AI investment, the Gartner 2026 CMO Spend Survey is the one to cite. It surveyed 401 CMOs and marketing leaders in North America, the UK and Europe from January to March 2026, most at companies with more than $1 billion in revenue.
- CMOs allocate an average 15.3% of marketing budget to AI initiatives.
- Organizations with mature AI readiness allocate 21.3%, and spend 8.9% of revenue on marketing against the 7.8% average.
- 70% call becoming an AI leader a critical 2026 goal, but only 30% report mature or fully developed AI readiness.
- 56% say they lack the budget to deliver their 2026 strategy.
McKinsey’s 2026 survey gives the enterprise-wide view: 28% of respondents say their organizations spend more than 10% of their information and communication technology budget on AI, and 60% expect AI investment to increase next year.
Worked example using Gartner’s averages for a company with $500 million in revenue: $500M × 7.8% = $39M marketing budget, and $39M × 15.3% = about $5.97M on AI. At the AI-ready profile, $500M × 8.9% = $44.5M, and $44.5M × 21.3% = about $9.48M. Gartner’s sample skews above $1 billion in revenue, so for smaller firms treat these as a ceiling, not a target. No public survey breaks out AI spend for a single purpose such as brand consistency, and none benchmarks how much to budget for measuring AI’s impact. Our CMO budget statistics page compares the wider Gartner and CMO Survey budget numbers.
AI adoption in marketing by industry and company size
The CMO Survey’s 2026 Highlights report breaks AI use out by sector. Census adds the economy-wide rate by industry.
| Segment | Figure | Measure | Source |
|---|---|---|---|
| Tech, software and platform companies | 36.1% now, 68.4% projected in 3 years | Share of marketing activities using AI | CMO Survey 2026 |
| Consumer services | 32.5% now, 65% projected | Share of marketing activities using AI | CMO Survey 2026 |
| Retail and wholesale | 26.4% now, 60% projected | Share of marketing activities using AI | CMO Survey 2026 |
| Fully online companies vs. limited online sales | 31.4% vs. 17.5% | Share of marketing activities using AI | CMO Survey 2026 |
| Consumer services / tech, software, platform | 38.3% / 33.9% | Share of marketing activities using generative AI (highest) | CMO Survey 2026 |
| Mining and construction / manufacturing | 8.7% / 11.3% | Share of marketing activities using generative AI (lowest) | CMO Survey 2026 |
| B2B services vs. B2C product | 27.4% vs. 18.9% | Share of marketing activities using generative AI | CMO Survey 2026 |
| Information sector / finance and insurance / all US businesses | 39.7% / 33.9% / 19.8% | Firms using AI in any business function | Census, May 2026 |
Which report is best for a CMO tracking AI adoption in their industry
- The CMO Survey, if you are a US company and want your sector: its Firm and Industry Breakout Report splits every question by industry, revenue and headcount. Annual, fielded each January; next edition January 2027.
- Gartner CMO Spend Survey, if you need a budget benchmark for a large enterprise. Headline figures are free in press releases; the full report is for clients.
- McKinsey State of AI, if you need cross-function context for a board deck. The 2026 edition is 31 pages; earlier editions, including the early-2024 gen AI edition, are linked from the same page.
- Census BTOS, if you want an official, all-business adoption rate by sector and firm size, updated every two weeks.
- Salesforce and HubSpot, if you want large global samples and channel detail, read as vendor research with products to sell.
Where AI falls short: brand fit, trust and judgment
The same surveys that show high adoption show where AI output disappoints. These are the numbers to bring when someone asks whether AI misses emotional or contextual understanding.
- CMO Survey leaders rate how well they manage generative AI’s fit with their brand at 4.5 out of 7, and fit with target markets at 4.4. Minimizing bias scores 3.8, and hiring generative AI talent 3.7.
- In HubSpot’s 2026 AI report, 28% of marketers say AI output quality still trails human work, and 53% struggle to differentiate their content.
- A Gartner survey of 1,539 US consumers (October 2025) found 50% would prefer to give their business to brands that do not use generative AI in consumer-facing content, and 68% frequently wonder whether the content they see is real.
- 80% of CMOs in Gartner’s 402-CMO survey say staff fear and anxiety is a barrier to AI experimentation.
- The CMO Survey’s top barriers to getting value from marketing technology are lack of budget (20.1%), integration and data architecture (19.1%), bandwidth (14.1%) and talent (13.1%), and no marketing technology activity scores above 5 on its 7-point performance scale. Our martech statistics page covers stack utilization in depth.
The controlled studies point the same way. AI users in the BCG experiment were 19% less likely to get the right answer on a task outside AI’s abilities, and disclosure of AI involvement cut ad effectiveness by up to 31.5%. In my view, this is the strongest argument for keeping humans on positioning, claims and final edits; our guide to generative AI for marketing lays out that workflow. GEO is the one use case growing without either ROI or failure data: 41.5% of companies already use it, and our AI search statistics page tracks the user and click data behind it.
Where the most repeated AI marketing numbers come from
Many 2026 roundups repeat figures that trace back to older, narrower or unpublished sources. Here is where each one actually leads.
| Repeated claim | Where it actually comes from | Verdict |
|---|---|---|
| “87% of marketers use generative AI, up from 51% in 2024” | The 51% is a Salesforce and YouGov survey of 1,029 marketers in the US, UK and Australia, fielded May 18 to 25, 2023, published June 5, 2023, where “using” included experimenting. The 87% does not appear in Salesforce’s own 10th-edition summary, which says 75%. | Do not cite the pair. Use 75% (Salesforce, late 2025) |
| “88% of organizations use AI” (McKinsey) | McKinsey’s 2025 edition, all business functions. The 2026 edition says “nearly nine in ten.” | Organizations, not marketers. Cite the 2026 wording |
| “35% of Amazon purchases come from AI recommendations” | A one-line statement in a McKinsey retail article dated October 1, 2013, with no method given | 13 years old, not about generative AI |
| “Personalization lifts revenue 10 to 15%” | McKinsey, November 12, 2021: “most often drives 10 to 15 percent revenue lift,” company-specific range 5 to 25% | Consulting estimate, not AI-specific |
| Generative AI’s marketing productivity value in the hundreds of billions | McKinsey, June 14, 2023 estimated value “between 5 and 15 percent of total marketing spending” | A modeled potential, not a measured result |
| “AI Max delivers 14% more conversions at similar CPA” | Google internal data, 2025, non-retail advertisers | Platform-stated; independent median CPA was 16% higher |
| “AI-driven marketing returns 300%” and similar multiples | Roundups such as ClickMinded’s trace these to blogs with no methodology or sample | No primary source found. Drop |
| “AI in marketing market worth $47.32 billion in 2025” | Roundups like Shno cite an ad-tech vendor blog, not the underlying market model | Market sizing varies by vendor definition. Treat as a forecast, not data |
| Klarna’s “$10 million saved with AI marketing” | Klarna’s own Q1 2024 release, reported by Marketing Dive: AI accounted for 37% of marketing savings, about $10M annualized, and image development fell from six weeks to seven days | Company-stated, no control group |
Method notes: survey figures were read from each publisher’s own report, release or blog. The McKinsey 2026 report and the Gartner and BusinessWire releases were read from web.archive.org copies of the publishers’ pages because the live pages block automated access. Figures marked as our calculation are arithmetic on published tables. If you want help turning these benchmarks into an AI budget and a test plan for your firm, you can book a consultation.
Frequently asked questions
How many marketers are using generative AI?
Most marketers use it, but for a minority of their work. In The CMO Survey (January 2026, 308 US marketing leaders), 88.2% of companies used generative AI in at least some marketing activity, yet it covered a mean 22.4% of activities. Salesforce's 10th State of Marketing (4,450 marketers, late 2025) reports 75% using AI, and HubSpot's 2026 vendor survey reports 98% of teams using AI in some form.
Which AI solutions have the highest measurable impact on marketing workflows?
In controlled studies: AI drafting for writing tasks (40% less time, 18% higher quality in a randomized Science study), AI assistants for customer support (15% more issues resolved per hour across 5,172 agents), and fully AI-generated display ads (up to 19% higher click-through in a field test). Automated ad buying is mixed: in 640 Haus tests, Meta Advantage+ averaged 12% lower incremental ROAS than manual campaigns.
Is there ROI data on AI adoption in marketing departments?
Mostly self-reported. CMO Survey leaders report a mean 14.1% sales productivity gain and 14.6% lower marketing overhead from AI in 2026. McKinsey's 2026 survey found only 37% of organizations attribute any EBIT impact to AI, and about 6% are high performers. Controlled studies measure productivity or click-through, not end-to-end marketing ROI, so run your own holdout test before committing budget.
How much do comparable enterprises spend on AI in marketing?
CMOs allocate an average 15.3% of marketing budget to AI, per Gartner's 2026 CMO Spend Survey of 401 leaders, mostly at companies above $1 billion in revenue. AI-ready organizations allocate 21.3%. Marketing budgets average 7.8% of revenue, so a $500 million company at the average would spend about $5.97 million on AI in marketing. No public survey isolates AI spend for brand consistency.
How much productivity gain can marketing teams expect from AI?
Controlled studies show 25% to 40% time savings on suitable tasks: 40% less time on professional writing (Noy and Zhang, Science, 2023) and 25.1% faster completion of consulting tasks in the BCG experiment. Gains reverse on tasks outside AI's abilities, where AI users were 19% less likely to be correct. Self-reported gains are smaller: a median 10% sales productivity improvement in The CMO Survey 2026.
Which report is best for a CMO tracking AI adoption trends in their industry?
For US companies, The CMO Survey: its Firm and Industry Breakout Report splits AI use by sector, revenue and headcount, and the same questions repeat every January. Use Gartner's CMO Spend Survey for large-enterprise budget benchmarks, McKinsey's State of AI for cross-function context, and the Census Business Trends and Outlook Survey for an official all-business rate by sector.
Is the 87% of marketers use generative AI statistic real?
It could not be traced to a primary source. The 51% baseline usually paired with it comes from a Salesforce and YouGov survey of 1,029 marketers fielded in May 2023, where using included experimenting. Salesforce's own summary of its 10th State of Marketing report says 75% of marketers are using AI. Cite the 75% with its late-2025 field dates instead.
More CO Consulting marketing research
- E-commerce Statistics 2026: 32 Verified Data Points on US Online Retail
- 42 Small Business Marketing Statistics and Data Points for 2026
- AI Search and GEO Statistics for 2026: How People Use AI Search and How Engines Cite Sources
- 37 Page Speed and Core Web Vitals Statistics for 2026
- FTC Advertising and Endorsement Enforcement: 12 Compliance Statistics for 2026
- Marketing Cost & CAC Benchmark by Industry 2026: The True Cost Per Acquired Client
- The AI Search Readiness Study 2026: 15 Data Points on How Small-Business Websites Score for AI Citation
B2B & marketing-strategy research
More Marketing Research guides
- 31 Online Reviews and Reputation Statistics for 2026
- 37 Page Speed and Core Web Vitals Statistics for 2026
- Podcast and Audio Advertising Statistics for 2026: 27 Verified Data Points
- 52 SEO Statistics and Data Points for 2026: Search Share, Zero-Click, and the AI Overviews Shift
- 42 Small Business Marketing Statistics and Data Points for 2026
- 27 Video Marketing Statistics and Data Points for 2026
- All Marketing Research guides →