

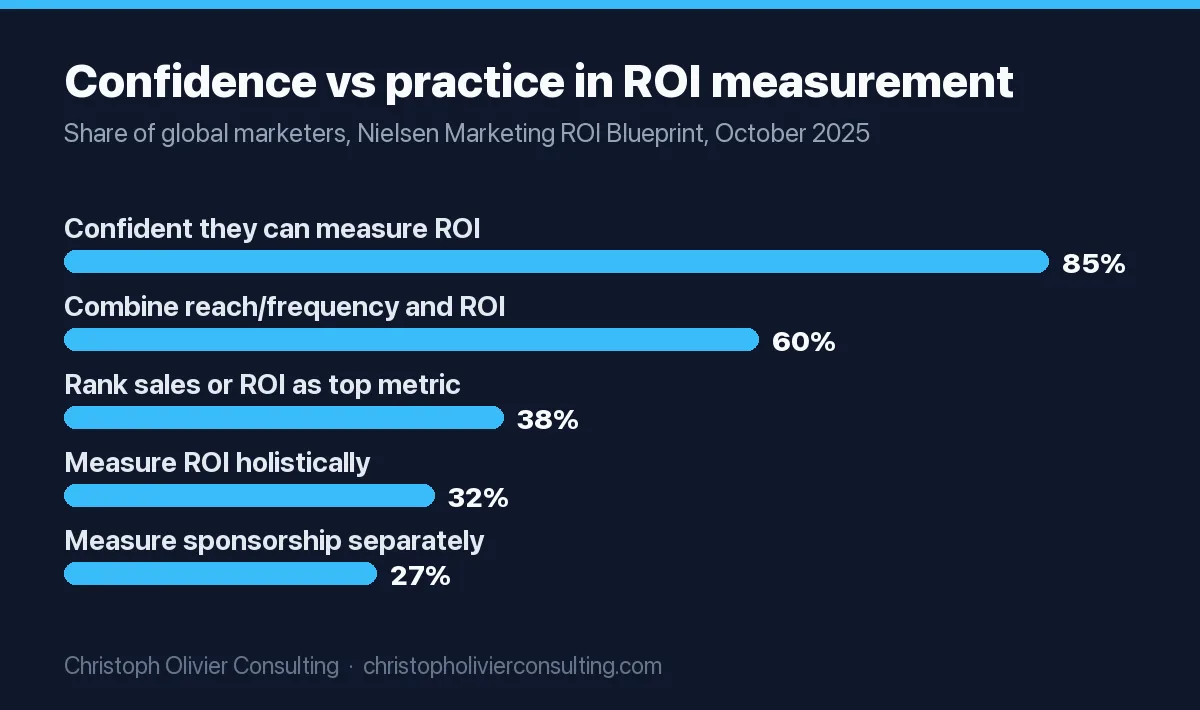
The headline marketing attribution statistic for 2026 comes from Nielsen: 85% of marketers say they are confident they can measure ROI, but only 32% measure it holistically across traditional and digital media (Nielsen Marketing ROI Blueprint, October 9, 2025). If you are evaluating Nielsen itself for attribution, start with one fact most review sites miss: Nielsen sold its marketing mix modeling business to Circana, which completed the deal in August 2025. Today Nielsen’s measurement offer is Nielsen ONE plus lift and analytics products, covered below.
Every number on this page was re-checked against the primary source on November 1, 2026. Figures from the old version that could not be traced to a primary source were removed.
Marketing attribution statistics at a glance
| Statistic | Figure | Source and date |
|---|---|---|
| Marketers confident they can measure ROI | 85% | Nielsen ROI Blueprint, Oct 2025 |
| Marketers who measure ROI holistically across traditional and digital | 32% | Nielsen 2025 Annual Marketing Report, May 2025 |
| Same holistic measure, Europe only | 23% | Nielsen 2025 Annual Marketing Report |
| Marketers using “hybrid” or full-funnel metrics to measure combined impact | 49% | Nielsen 2026 Annual Marketing Report |
| US buy-side decision makers running incrementality tests / attribution analysis / MMM | 76% / 73% / 67% | IAB State of Data 2026, Feb 2026, n=430 |
| Use all three methods together | 39% | IAB State of Data 2026 |
| Attribution users running multi-touch attribution today | 39% | IAB State of Data 2026, n=315 attribution users |
| US brand and agency marketers who call MMM the most reliable method | 27.6% | EMARKETER and TransUnion, 2025 |
| Plan to increase MMM investment over the next year | 46.9% | EMARKETER and TransUnion, 2025 |
| B2B marketers engaged in attribution analysis | 54% | Demand Gen Report 2024 Measurement and Attribution Benchmark |
| Google Ads web conversions credited by first click, linear, time decay or position-based models when Google retired them | Less than 3% | Google Ads Help, April 2023 |
| Marketing budget as a share of company revenue | 7.8% in 2026 (7.7% in 2025) | Gartner 2026 CMO Spend Survey, 401 CMOs |
The Gartner ratio comes from CMOs at mostly $1 billion-plus companies, so read it as a large-company benchmark. Our martech statistics break down how that budget splits between technology, AI and media.
Evaluating Nielsen on marketing attribution
“Nielsen attribution” now refers to three different things, and only one of them is still a Nielsen product. Sort them out before you book a demo.
What Nielsen sells for measurement in November 2026
| Product | What Nielsen says it does | Published price |
|---|---|---|
| Nielsen ONE | Cross-media measurement and planning with “comprehensive, deduplicated metrics” across linear, streaming and digital, calibrated with Nielsen panels. The page does not use the word attribution. | None. “Contact us” and “Get a demo” only. |
| Sales Lift | “Measure incremental sales and optimize media for outcomes that drive revenue,” per Nielsen’s marketing optimization page. | None listed |
| Brand Lift | Brand lift measurement across platforms for top-funnel performance. | None listed |
| Media Analytics | Custom research to justify media budgets and optimize performance. | None listed |
| Brand Resonance | Campaign memorability, brand communication and message recognition. | None listed |
What happened to Nielsen Attribution (Visual IQ) and Nielsen Marketing Mix
- September 27, 2017: Nielsen agreed to acquire Visual IQ, a multi-touch attribution (MTA) software provider, with closing expected in October 2017. Software directories still use the name “Nielsen Attribution (formerly Visual IQ).” Nielsen’s current marketing optimization page does not list an attribution product.
- August 26, 2024: Circana announced agreements to buy NCSolutions and Nielsen’s Marketing Mix Modeling business. Nielsen CEO Karthik Rao framed it as Nielsen focusing “on expanding its leadership position in audience measurement and content data.”
- August 2025: Circana completed the MMM acquisition and folded the team into Circana Media alongside NCS, according to Marketing Dive and Research Live. Financial terms were not disclosed.
- Today: Nielsen’s old marketing mix modeling URL redirects to Circana’s MMM page (checked November 1, 2026). If you want the former Nielsen MMM, you are now buying from Circana.
A fair way to evaluate Nielsen for your attribution question
Match the question you need answered to the product that answers it:
| Your question | Method that answers it | Nielsen option today | What to ask on the demo |
|---|---|---|---|
| How many unique people did my TV, streaming and digital buys reach? | Deduplicated cross-media audience measurement | Nielsen ONE | Which of my channels and publishers are covered, and how is the panel calibration applied? |
| Did this campaign cause extra sales? | Incrementality (lift) study | Sales Lift | What is the control group, what outcome data is matched, and what minimum spend makes the result readable? |
| How should I split next year’s budget across channels? | Marketing mix modeling | Not Nielsen since the Circana sale | Ask Circana or an MMM vendor (table below) how many years of weekly data they need. |
| Which touchpoints led to a specific lead or deal? | User-level or rules-based attribution | No listed Nielsen product | Use GA4, ad platform reports or CRM attribution (see the budget table). |
One scope note: Nielsen’s survey samples are brand marketers at manager level or above with at least $1 million in annual marketing budget, and two in three in the 2025 survey managed more than $10 million (Nielsen, 2025). Its products are sold through sales conversations, with no public pricing. If your total marketing budget is a fraction of that, the budget table further down is the better starting point.
What Nielsen’s Annual Marketing Reports say about measurement confidence
| Report | Sample and fieldwork | Measurement findings |
|---|---|---|
| 2024 Annual Marketing Report (April 25, 2024) | Nearly 2,000 global marketers with $1M+ budgets, December 2023 | 84% extremely or very confident in ROI measurement, up from 69% in 2023. 38% measure traditional and digital together. |
| 2025 Annual Marketing Report (May 20, 2025) | 1,400 global marketers, February 25 to March 6, 2025 | 32% measure media spend holistically (Latin America 29%, Europe 23%). 54% planned to cut ad spend in 2025 (Europe 60%). |
| Marketing ROI Blueprint (October 9, 2025) | Built on the 2025 survey | 85% confident they can measure ROI. 32% measure holistically. 38% now rank sales or ROI as their top success metrics. 27% still measure sponsorship separately. 60% combine reach/frequency and ROI in cross-media measurement. |
| 2026 Annual Marketing Report | Sample and dates not stated on the summary page | 2x year-over-year increase in marketers prioritizing accuracy in measurement. 49% use hybrid or full-funnel metrics. Incongruent datasets up 10 points as a challenge. 29% prioritizing brand lift metrics. |
The pattern across three years: stated confidence sits in the mid-80s while holistic measurement fell from 38% to 32%. The question wording and samples changed between waves, so treat the drop as a direction, not a precise trend. The practical reading is the same either way. Most teams measure each channel in its own tool and never reconcile the totals.
How marketers actually measure: IAB State of Data 2026
The IAB State of Data 2026 report, run with BWG Global, surveyed 400+ senior planning and analytics decision makers at US brands and agencies (n=430). It is the most detailed recent split of attribution, incrementality and MMM usage.
- Usage: 76% run incrementality tests, 73% run attribution analysis, 67% use MMM. Only 39% use all three.
- Shortfalls: 60% to 75% say these methods underperform on rigor, coverage, timeliness, trust and efficiency.
- Attribution coverage: 72% of attribution users say their approach does not perform very well at capturing performance across all channels. For MMM users the figure is 61%.
- MMM blind spots: among MMM users who can see each channel, 77% say gaming is underrepresented in their models, 50% commerce media, 48% creator and influencer, 41% CTV, 35% paid search.
- Cadence: respondents expect AI to move incrementality testing from 3 to 5 tests a year to 11+, and attribution and MMM from annual or twice-yearly runs to monthly.
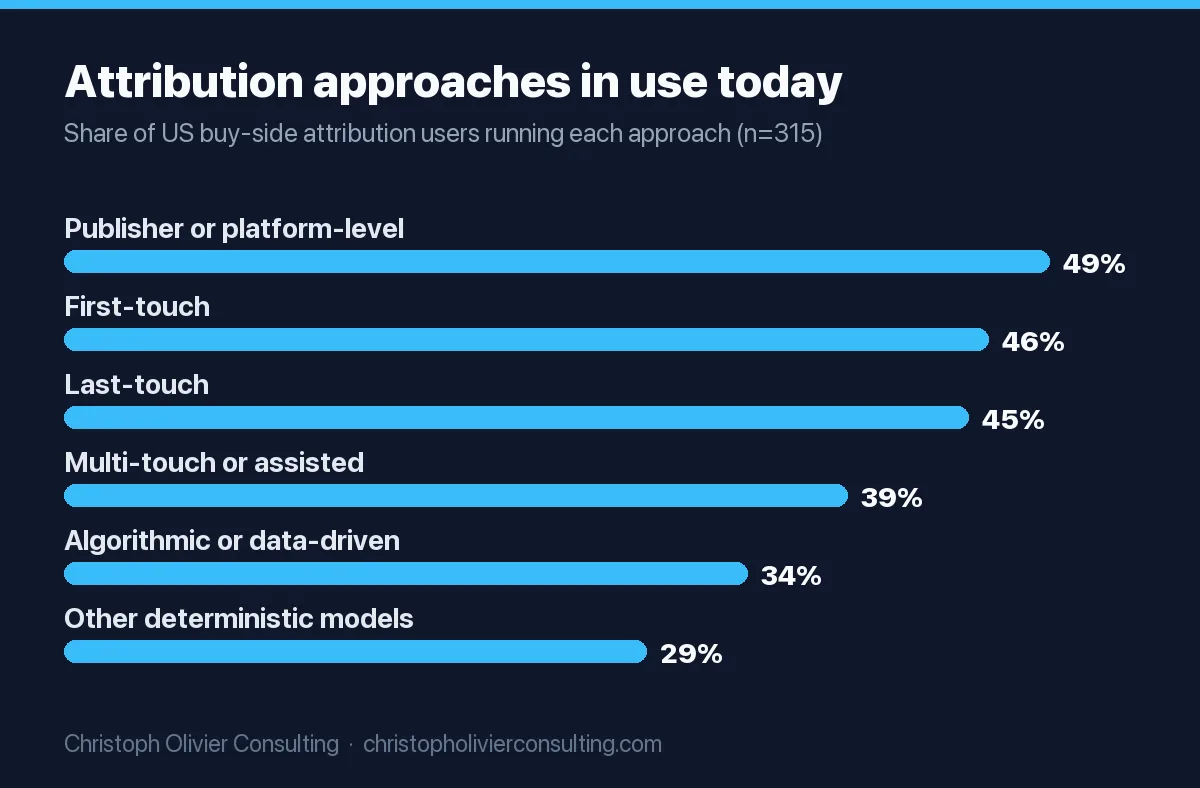
Which attribution approaches attribution users run today (n=315):
| Attribution approach | Used today | Expect to add in 1 to 2 years |
|---|---|---|
| Publisher or platform-level (Meta, Google, Amazon) | 49% | 37% |
| First-touch | 46% | 36% |
| Last-touch | 45% | 38% |
| Multi-touch (MTA) or assisted | 39% | 44% |
| Algorithmic or data-driven | 34% | 50% |
| Other deterministic (W-curve, U-curve, time series) | 29% | 42% |
Single-touch and platform-reported models still lead. For how each model splits credit between touchpoints, read our comparison of first-touch, last-touch and multi-touch models.
B2B attribution: Demand Gen Report’s 2024 benchmark
The 2024 Marketing Measurement and Attribution Benchmark Survey from Demand Gen Report and The MX Group (May 2024; the report does not state its sample size) found:
- 86% of B2B practitioners say measurement and attribution is a growing priority.
- 54% of B2B marketers are engaged in attribution analysis. Among them, top priorities are multi-touch attribution (51%), last-touch (47%), first-touch (35%) and pipeline velocity (22%).
- 70% use CRM-generated reports as their primary source of truth, up from 49% in 2023.
- At the bottom of the funnel, 39% use last-touch attribution to identify the final interaction before conversion. In the mid-funnel, 20% use multi-touch attribution.
- 58% cite lack of direct attribution as the main challenge in linking brand marketing to sales.
The platform changes that rewrote attribution reports
| Date | Change | What it does to your reports |
|---|---|---|
| iOS 14.5 | Apple’s App Tracking Transparency requires user permission to track across other companies’ apps and websites or to access the advertising identifier. | Less user-level data from iPhone apps. Apple publishes the rule but no opt-in rate, so treat any opt-in percentage you see as a third-party estimate. |
| June and September 2023 | Google Ads stopped letting advertisers select first click, linear, time decay and position-based models, then switched remaining conversion actions to data-driven attribution (Google Ads Help). | Remaining Google Ads options: data-driven, last click, external attribution. |
| November 2023 | Those four models became unavailable in Google Analytics (GA4 attribution models). | GA4 offers three: data-driven, paid and organic last click, Google paid channels last click. Older guides comparing six GA4 models are out of date. |
| October 17, 2025 | Google retired the Attribution Reporting API, Topics, Protected Audience and other Privacy Sandbox technologies, citing “low levels of adoption,” and kept third-party cookie choice in Chrome. | No browser-level replacement for cookie-based attribution is coming from Chrome. |
| January 12, 2026 | Meta stopped returning 7-day view and 28-day view windows in the Ads Insights API, as announced on its developer blog and reported by PPC Land. | Remaining windows: 1-day click, 7-day click, 28-day click, 1-day engaged view, 1-day view. Reports that pulled 7-day view numbers stopped getting data for them. |
| March to June 2026 | Meta renamed engaged-view to engage-through attribution (March 3, 2026). As of June 2026 the default is 7-day click, 1-day engage-through and 1-day view, per PPC Land citing Jon Loomer. | The long-standing default was 7-day click plus 1-day view, so Meta-reported results are not directly comparable across the change. |
Two GA4 settings that change your numbers, from Google’s attribution settings page: the lookback window for acquisition key events (first_visit, first_open) defaults to 30 days, with 7 as the alternative. All other key events default to 90 days, with 30 or 60 as options. Changing the reporting model applies to historical and future data, so log the date you switch. Our digital marketing analytics guide shows where these settings sit in a monthly report, and the GA4 setup for tracking ChatGPT and AI search referrals covers a channel the default groupings miss.
Comparable MMM and attribution tools, from their own docs
| Tool | Owner and license | Facts from the vendor or repository |
|---|---|---|
| Circana Marketing Mix | Circana, commercial | Owner of the former Nielsen MMM business since August 2025. No public price list. |
| Google Meridian | Google, Apache-2.0 | Open-source MMM, available to everyone since January 29, 2025 after testing with “hundreds of brands.” Over 20 certified measurement partners. Requires Python 3.11 to 3.13. Google recommends at least two years of weekly data for geo-level models and three years for national models, with no missing values. |
| Meta Robyn | Meta Marketing Science, MIT | “Experimental, semi-automated” open-source MMM using ridge regression and evolutionary hyperparameter search. Built in R; the Python version is a beta that Meta says was LLM-translated and “might encounter bugs.” Latest tagged release v3.12.0 (December 19, 2024). |
| PyMC-Marketing | PyMC Labs, Apache-2.0 | Bayesian toolbox for MMM and customer lifetime value. Release 1.3.0 on October 22, 2026. |
| Meta GeoLift | Meta, MIT | Geo-experiment method based on synthetic control to measure the incremental lift of a campaign. A test, not a model, so it pairs with MMM rather than replacing it. |
For how an MMM turns spend history into budget recommendations, see marketing mix modeling explained.
Which attribution method fits your budget
The spend bands are my rule of thumb, not a published standard. The data requirements and prices are from each vendor’s own page, checked November 1, 2026. Prices are list prices in USD.
| Your situation | Method | Data you need | Tool | Cost |
|---|---|---|---|---|
| Under about $5,000 a month in ads, one or two paid channels, leads arrive by form | GA4 data-driven plus platform reports | Key events set up, UTM tags on every non-Google link, lead source field in your CRM | Google Analytics and the attribution built into Google Ads | Free (“free of charge,” per Google) |
| Same spend, but most leads phone in | Call tracking with dynamic number insertion | A tracking number pool sized to peak traffic, booked-call outcomes imported back to Google Ads | CallRail Lead Tracking | $50/mo with 5 numbers and 250 minutes; extra local numbers $3, local minutes $0.05 |
| B2B, three or more channels, deals close in a CRM | CRM multi-touch attribution | Contacts and deals tied to campaigns; clean lifecycle stages | HubSpot Marketing Hub | Professional from $800/mo plus $3,000 onboarding gives contact create attribution. Deal and revenue attribution need Enterprise, from $3,600/mo plus $7,000 onboarding (HubSpot KB) |
| B2B with an existing CRM, wants account-level journeys | B2B revenue attribution platform | CRM, ad platform and web tracking connected | Dreamdata | Free plan $0 (no attribution models listed); attribution models on Advanced, custom pricing |
| You need to prove one channel or campaign causes sales | Geo or holdout lift test | Sales or leads by region and week; regions you can switch off | Meta GeoLift | Free, open source (MIT); you pay for analyst time |
| Spend across five or more channels including offline, two to three years of weekly history | Marketing mix modeling, in house | Weekly KPI, spend and impressions by channel, control variables, no gaps | Google Meridian, Meta Robyn or PyMC-Marketing | Free, open source (Apache-2.0 or MIT); needs a Python or R analyst |
| Large national or multi-market budget, wants a managed model | Vendor MMM plus lift studies | As above, plus retail or panel data the vendor supplies | Circana, a Meridian certified partner, or Nielsen Sales Lift for incrementality | Quote only; none publish list prices |
How to use the table:
- Pick the row for your current spend and how leads reach you, not the row you hope to grow into.
- Fix the data column first. A model built on missing UTM tags or unreconciled CRM stages gives confident wrong answers.
- Run one lift test before you trust any model’s credit for your largest channel.
- Move up a row only when the current method cannot answer the budget question you actually face.
For phone-heavy service businesses, our call tracking and attribution guide for HVAC companies sizes the number pool and compares four call tracking vendors with current prices. If you want a second opinion on which row you sit in, you can book a consultation.
How these numbers were checked
Each figure was traced to the publisher’s own page, PDF or repository on November 1, 2026: Nielsen’s news center and insights pages, the IAB report PDF, the Demand Gen Report PDF, Google and Apple help pages, and GitHub for open-source tools. Meta documentation was read through PPC Land’s reporting of Meta’s announcements. Gartner and EMARKETER figures were read from their own articles. Removed from the previous version because the primary source could not be confirmed or was out of date: a vendor-blog figure that 75% of companies use multi-touch attribution, 2020 Demand Gen Report figures quoted through a third-party blog, a UK CMA publisher-revenue figure quoted through trade press, Nielsen’s 2023 per-channel confidence figures, and a Google-sponsored MMM study. Survey percentages from different publishers use different samples and should not be added together.
Frequently asked questions
How do you evaluate the marketing technology company Nielsen on marketing attribution?
Match your question to its products. Nielsen ONE gives deduplicated cross-media audience measurement, and Sales Lift measures incremental sales from a campaign. Nielsen no longer sells marketing mix modeling: Circana bought that business, closing in August 2025. Nielsen lists no attribution product on its marketing optimization page and publishes no prices, and its research samples marketers with budgets of $1 million or more.
Does Nielsen still offer marketing mix modeling?
No. Circana announced agreements to buy Nielsen's Marketing Mix Modeling business and NCSolutions on August 26, 2024, and completed the MMM acquisition in August 2025. The team now sits inside Circana Media. Nielsen's old MMM web address redirects to Circana's marketing mix modeling page, so buyers who want the former Nielsen model now contract with Circana.
What happened to Nielsen Attribution, formerly Visual IQ?
Nielsen agreed to acquire Visual IQ, a multi-touch attribution software provider, on September 27, 2017. Software directories still list the product under the name Nielsen Attribution. As of November 2026, Nielsen's marketing optimization page lists Brand Lift, Sales Lift, Media Analytics and Brand Resonance, but no attribution product, so confirm availability with Nielsen sales before you plan around it.
How confident are marketers in measuring marketing ROI?
Nielsen's Marketing ROI Blueprint from October 2025 found 85% of marketers confident in their ability to measure ROI, yet only 32% measure it holistically across traditional and digital channels. The 2024 report showed 84% confident and 38% measuring holistically. Survey wording and samples changed between waves, so the gap is the reliable signal, not the exact trend.
What percentage of marketers use multi-touch attribution?
In the IAB State of Data 2026 survey, 39% of US buy-side attribution users run multi-touch or assisted attribution today, behind platform-level reporting at 49%, first-touch at 46% and last-touch at 45%. Demand Gen Report's 2024 benchmark found 54% of B2B marketers engaged in attribution analysis, with multi-touch the top priority for 51% of them.
Which attribution models are left in GA4 and Google Ads?
GA4 offers data-driven, paid and organic last click, and Google paid channels last click. First click, linear, time decay and position-based models have been unavailable since November 2023. Google Ads keeps data-driven, last click and external attribution, after switching remaining rules-based conversion actions to data-driven in September 2023. Google said fewer than 3% of web conversions used the retired models.
What are free alternatives to Nielsen or Circana marketing mix modeling?
Google Meridian (Apache-2.0, generally available since January 29, 2025), Meta Robyn (MIT, built in R with a beta Python port) and PyMC-Marketing (Apache-2.0) are open-source MMM packages. Meta GeoLift is an open-source geo lift test. The software is free, but Meridian recommends two to three years of weekly data, and you need an analyst who works in Python or R.
B2B & marketing-strategy research