

First touch attribution gives 100% of the credit for a sale to the first interaction, last touch gives 100% to the final interaction before the conversion, and multi-touch attribution splits the credit across the journey: equally (linear), by recency (time decay), 40/20/40 between first, middle and last (U-shaped), 30/30/30/10 across three milestones (W-shaped), 22.5% to each of four milestones (full path), or by an algorithm trained on your own paths (data-driven). The catch most comparisons miss: Google removed first click, linear, time decay and position-based models from Google Ads and Google Analytics 4 in 2023, so in GA4 today you choose between data-driven and two flavors of last click.
Below you get every model side by side, one five-touch journey worked through ten ways with the dollar math, where each model still exists in GA4, Google Ads, HubSpot, Salesforce, Meta and Adobe Marketo Measure (with list prices checked November 1, 2026), and a decision table for picking one.
All 10 attribution models compared
| Model | How credit is split | Type | What it is good for | Main blind spot |
|---|---|---|---|---|
| First touch | 100% to the first interaction | Rules, single touch | Which channels introduce new prospects | Ignores everything that turned interest into a sale |
| Last touch (last click) | 100% to the last interaction before conversion | Rules, single touch | Which channels close; one-session purchases | Gives nothing to the channels that created demand |
| Linear (even distribution) | Equal share to every interaction | Rules, multi-touch | A neutral baseline to compare other models against | Treats a repeat email click like the touch that started the journey |
| Time decay | More credit the closer a touch is to conversion; Google’s retired version used a 7-day half-life | Rules, multi-touch | Short cycles and promotions | Early touches in long cycles get almost nothing |
| U-shaped (position-based) | 40% first, 40% last, 20% shared by the middle | Rules, multi-touch | Lead generation where opening and closing both matter | Middle nurture is underweighted on long journeys |
| W-shaped | 30% each to first touch, lead creation and opportunity creation, 10% shared by the rest | Rules, multi-touch | B2B funnels with a clear lead and opportunity stage in a CRM | Needs clean CRM stage dates to find the milestones |
| Full path (Z-shaped) | 22.5% each to first touch, lead creation, opportunity creation and closed-won, 10% shared by the rest | Rules, multi-touch | Long B2B sales cycles with a sales team | Needs four tracked milestones per deal |
| Data-driven | Computed from your converting and non-converting paths | Algorithmic | Bidding and channel mix inside one platform’s data | Opaque, and each platform only models what it can see |
| Marketing mix modeling (MMM) | Regression on weekly spend and sales by channel, not per user | Statistical, top down | Budget splits across online and offline channels | Needs two to three years of weekly data |
| Incrementality (lift) test | Compares a group that saw the ads with a holdout that did not | Experiment | Proving a channel causes sales | Measures one channel or campaign at a time |
The first seven are rules or algorithms that hand out credit after the fact. MMM and lift tests answer a different question, what would have happened without the spend, which is why serious measurement teams run them alongside attribution rather than instead of it. The split percentages come from vendor documentation: the 40/20/40 and 7-day half-life rules from Google’s GA4 help page as archived in March 2023, and the W-shaped and full path splits from Adobe’s Marketo Measure documentation.
One 5-touch journey, ten different answers
Here is one hypothetical journey for a professional-service firm that signs a client worth $12,000 in first-year fees. Every model below scores this exact path.
| Touch | Days before signing | Channel | What happened | CRM milestone |
|---|---|---|---|---|
| 1 | 45 | Organic search | Reads a blog post | First touch |
| 2 | 30 | LinkedIn Ads | Downloads a checklist through a form | Lead created |
| 3 | 21 | Email newsletter | Clicks through to a case page | None |
| 4 | 8 | Google Ads (branded search) | Books a consultation | Opportunity created |
| 5 | 1 | Meta Ads (retargeting) | Clicks, then signs the engagement letter | Closed-won |
Dollar credit per channel under each model
| Model | Organic search | LinkedIn Ads | Google Ads | Meta Ads | |
|---|---|---|---|---|---|
| First touch | $12,000 | $0 | $0 | $0 | $0 |
| Last touch, also GA4 “paid and organic last click” | $0 | $0 | $0 | $0 | $12,000 |
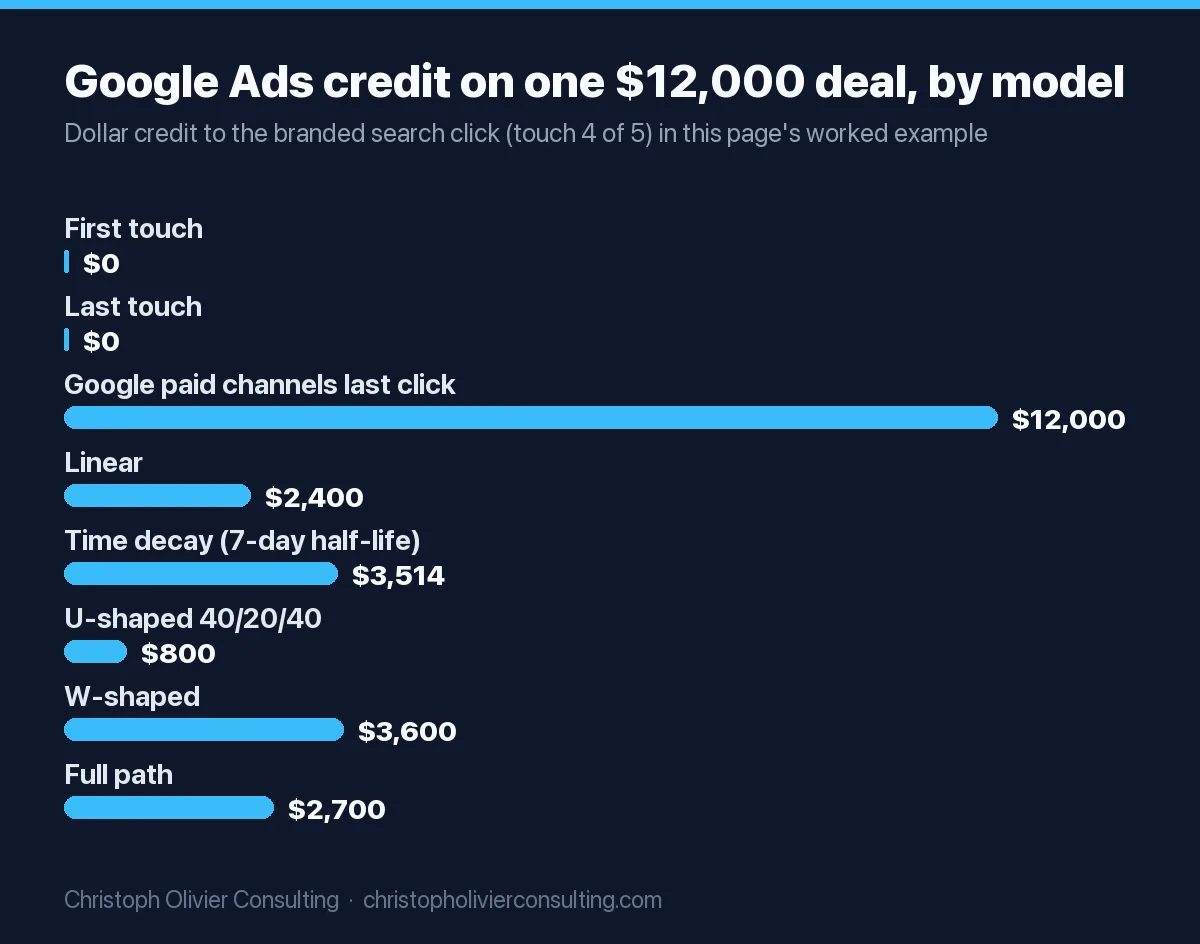
| GA4 “Google paid channels last click” and Google Ads last click | $0 | $0 | $0 | $12,000 | $0 |
| Linear | $2,400 | $2,400 | $2,400 | $2,400 | $2,400 |
| Time decay, 7-day half-life | $90 | $398 | $970 | $3,514 | $7,028 |
| U-shaped 40/20/40 | $4,800 | $800 | $800 | $800 | $4,800 |
| Marketo Measure U-shaped (first touch and lead creation, 50/50) | $6,000 | $6,000 | $0 | $0 | $0 |
| W-shaped 30/30/30/10 | $3,600 | $3,600 | $1,200 | $3,600 | $0 |
| Full path 22.5 x 4 + 10 | $2,700 | $2,700 | $1,200 | $2,700 | $2,700 |
| Data-driven, HubSpot Empirical | No fixed split. The weights come from all of your account’s paths, so one journey cannot be scored on paper. | ||||
| MMM and lift tests | No per-deal credit. They estimate what each channel adds in total over weeks or regions. | ||||
Same client, same $12,000. Organic search is worth anything from $0 to $12,000 and Meta from $0 to $12,000, depending only on the rule you picked. That spread is the real argument for comparing models before you move budget, not for trusting any single one.
The math behind each row
- Linear: $12,000 / 5 touches = $2,400 each.
- U-shaped: first and last get 40% x $12,000 = $4,800 each. The middle 20% ($2,400) splits across three touches: $800 each.
- W-shaped: the three milestones (first touch, lead created, opportunity created) get 30% x $12,000 = $3,600 each. The remaining 10% ($1,200) goes to the touch between the milestones, the email. The model’s milestones stop at opportunity creation, so in this example I give the post-opportunity Meta click nothing; check how your tool treats touches after the opportunity.
- Full path: four milestones (adding closed-won) get 22.5% x $12,000 = $2,700 each, and the email gets the remaining 10%, $1,200.
- Time decay: each touch’s weight is 0.5 raised to (days before conversion / 7). That gives 0.0116 (45 days), 0.0513 (30), 0.1250 (21), 0.4529 (8) and 0.9057 (1), which sum to 1.5465. Divide each weight by the sum for its share: 0.75%, 3.32%, 8.08%, 29.28% and 58.57%. Multiply by $12,000 and round: $90, $398, $970, $3,514, $7,028. The Google definition this follows: “a click 8 days before a conversion gets half as much credit as a click 1 day before a conversion.”
- GA4 last click flavors: “paid and organic last click” ignores direct visits and credits the last clicked channel, here the Meta ad (as long as the Meta link carried UTM tags). “Google paid channels last click” credits the last Google Ads click and falls back to paid and organic last click only when there is no Google Ads click in the path, per Google’s current attribution models page.
What Google removed from GA4 and Google Ads in 2023
Many comparison articles, including the earlier version of this page, still describe six GA4 models. That GA4 no longer exists. The timeline from Google’s own pages:
| Date | What happened | Source |
|---|---|---|
| April 6, 2023 | Google announced that first click, linear, time decay and position-based models “across Google Ads and Google Analytics 4 will be going away,” citing that less than 3% of Google Ads web conversions used them (Google data, February to March 2023). Data-driven, last click and external attribution were not affected. | Google Ads Help announcement |
| June 2023 | Google Ads removed the option to pick those four models for conversion actions not already using them. | Same announcement |
| September 2023 | Google Ads switched conversion actions still on those models to data-driven attribution (last click remained available as the alternative) and removed them from reporting, including the Model comparison report. | Same announcement |
| November 2023 | “The first click, linear, time decay, and position-based attribution models are no longer available as of November 2023” in Google Analytics. | GA4 attribution settings help |
What remains in GA4: data-driven, paid and organic last click, and Google paid channels last click. What remains in Google Ads: data-driven, last click and external attribution. Google’s announcement says data-driven is the default attribution model in both Google Ads and GA4, and Google Analytics itself is “free of charge,” per Google Marketing Platform. The earlier claim that data-driven needs the paid version of GA4 is wrong.
Three GA4 settings decide what your reports say. They sit under Admin, Data display, Events, Attribution settings:
- Reporting attribution model: changing it “applies to historical and future data,” so write down the date you switch.
- Lookback window for acquisition key events (first_open, first_visit): 30 days by default, 7 days as the alternative.
- Lookback window for all other key events: 90 days by default, with 30 or 60 as options. Changes “apply going forward.”
If you report GA4 to owners or partners, our digital marketing analytics guide shows where these settings belong in a monthly report.
First touch vs last touch vs multi-touch: what each one hides
First touch
First touch answers one question well: where do new prospects come from? In the worked example it hands organic search the whole $12,000 and gives the consultation booking nothing. Use it as a report on demand creation, never as the basis for cutting a closing channel. In 2026 you cannot run it in GA4 or Google Ads; you can in HubSpot, in Salesforce for Account Engagement users, and in Marketo Measure.
Last touch, and GA4’s two versions of it
Last touch is the closest model to “who was in the room when the deal closed.” It is the right default for single-session purchases and the wrong one for anything with a consultation, a proposal or a committee. Watch which last click you are looking at: GA4’s paid and organic last click credited Meta in the example, while Google Ads last click credited Google Ads, because Google Ads attribution scores Google ad interactions. Both are telling the truth about their own data.
Linear and time decay
Linear is the honest baseline: if a channel looks great under last click but average under linear, it is mostly a closer. Time decay with a 7-day half-life is brutal on long cycles: the blog post that started a 45-day journey earned $90 of $12,000. For a 3-day promotion that is fine. For a 90-day professional-services sale it quietly defunds content.
U-shaped, W-shaped and full path
These are the B2B models. U-shaped rewards opening and closing. W-shaped and full path need your CRM to stamp the lead-created and opportunity-created dates, which is where most small firms fall down: if lifecycle stages are updated by hand, the milestones land on the wrong touches. Note that vendors define “U-shaped” differently. Google’s retired position-based model was 40/20/40 between first and last; Marketo Measure’s U-shaped gives 50% each to first touch and lead creation and nothing to the touches that follow.
Data-driven
Data-driven attribution “uses your conversion data to calculate the actual contribution of each ad interaction across the conversion path,” by comparing people who converted with people who did not, per Google Ads Help. Every conversion action is eligible, but Google recommends at least 200 conversions and 2,000 ad interactions in supported networks within 30 days for precise results. Google’s archived explanation gives the logic in one line: if four exposures produce a 3% conversion probability and dropping the fourth lowers it to 2%, the fourth exposure gets credit for that difference. HubSpot’s closest equivalent is its Empirical model, which gives more weight to interaction types that occur less often across conversion paths.
The limit is scope. Google’s data-driven model sees Google’s data, Meta’s sees Meta’s, and neither sees the phone call or the partner referral. For phone-heavy businesses, the fix is to send booked-call outcomes back into the platforms; our call tracking attribution guide walks through that setup for a service business.
MMM and incrementality tests: the two methods that are not attribution models
Marketing mix modeling skips user-level tracking entirely. It regresses weekly sales on weekly spend by channel plus control variables such as seasonality. Google’s Meridian documentation asks for at least two years of weekly data for geo-level models and three years for national models, with no missing values, plus a KPI, media exposure, media spend and controls. Meridian is open source and has been available to everyone since January 29, 2025, launching with over 20 certified measurement partners. If you want a managed MMM from a research firm, note that Nielsen no longer sells one: Nielsen sold its marketing mix modeling business to Circana, which completed the deal in August 2025, as Marketing Dive reported.
Incrementality tests hold out a group of people or regions from the ads and measure the gap. Meta’s GeoLift is a free, MIT-licensed R package for geo experiments “based on Synthetic Control Methods,” with tools for market selection and power calculations. A lift test is the only method here that proves cause. Run one on your largest channel before you trust any model’s credit for it. Our full-funnel marketing guide maps which causal test fits each funnel stage.
Where each attribution model still exists in 2026, with prices
| Tool | Models available | Plan needed | List price (USD, checked Nov 1, 2026) |
|---|---|---|---|
| GA4 | Data-driven (default), paid and organic last click, Google paid channels last click | Any property | Free |
| Google Ads | Data-driven (default for most conversion actions), last click, external attribution | Any account | Included with the ad account; you pay for media |
| HubSpot attribution reports | First touch, last touch, linear, time decay, Empirical. HubSpot says Empirical “replaces the U-shaped, W-shaped, J-shaped, and Inverse J-shaped models.” | Contact create attribution: Marketing Hub or Content Hub Professional or Enterprise. Deal create and deal revenue attribution: Marketing Hub Enterprise only. | Marketing Hub Professional from $800/mo billed annually ($890 month to month) with 3 core seats, plus $3,000 onboarding. Enterprise from $3,600/mo with 5 core seats, plus $7,000 onboarding. |
| Salesforce Customizable Campaign Influence | Primary Campaign Source (default, 100% to one campaign) and custom models with your own percentages. First touch, last touch and even distribution are “Additional Campaign Influence Models” for Account Engagement users only. | Salesforce Professional, Enterprise, Performance, Unlimited or Developer edition. Custom model limits: 3 on Account Engagement Growth, 5 on Plus, Advanced and Premium. | Account Engagement Growth $1,250, Plus $2,750, Advanced $4,400, Premium $15,000 per org per month, billed annually |
| Adobe Marketo Measure | First touch, lead creation, U-shaped (50/50), W-shaped, full path, custom | Marketo Measure license | Not published in Adobe’s documentation; quote from Adobe |
| Meta Ads Manager | Click and view windows rather than a multi-touch model. Default as of June 2026: 7-day click, 1-day engage-through and 1-day view. Incremental attribution counts only conversions Meta’s models predict were caused by an ad (announced August 2024, global rollout June 2025). | Any ad account | Included with the ad account; you pay for media |
| Google Meridian, Meta GeoLift | MMM and geo lift tests | Python or R analyst | Free, open source |
Two Meta details matter for comparing reports over time. Since January 12, 2026 the Ads Insights API no longer returns 7-day view and 28-day view windows; 1-day click, 7-day click, 28-day click, 1-day engaged view and 1-day view remain, as PPC Land reported from Meta’s developer blog. Meta also renamed engaged-view to engage-through attribution on March 3, 2026, and the June 2026 default above replaced the long-standing 7-day click plus 1-day view, per PPC Land citing Jon Loomer. Meta-reported results from before and after June 2026 are not directly comparable.
HubSpot’s pricing makes the real decision visible: on Professional you can attribute contacts, but deal and revenue attribution, the reports that tie spend to signed clients, sit on Enterprise. For how these platforms compare as reporting tools overall, see our marketing reporting tools comparison.
Which attribution model for which business
The rows below are my rule of thumb, not a published standard. The tool facts in each row come from the vendor pages linked above.
| Your business | Primary model | Check it against | Where to run it | Skip |
|---|---|---|---|---|
| Online store, most orders in one session | GA4 data-driven | Paid and organic last click | GA4, free | W-shaped and full path; there are no CRM milestones |
| Local service business, most leads by phone | Last click on booked calls, imported to Google Ads | GA4 data-driven on call and form key events | GA4 plus a call tracking tool | CRM multi-touch until booked jobs are logged per source |
| Professional-service firm, consultation then proposal, 30 to 120 days | U-shaped or W-shaped on contacts and deals | First touch report for demand creation | HubSpot (deal attribution needs Enterprise) or Salesforce custom model | Time decay; it starves the content that starts the journey |
| B2B with a sales team and opportunity stages | Full path or W-shaped | Linear as a neutral baseline | Marketo Measure, Salesforce, HubSpot Enterprise | Platform-reported conversions as the source of truth |
| Spend in one dominant paid channel | Platform data-driven for bidding | A geo or holdout lift test on that channel | Google Ads or Meta, plus GeoLift | Comparing the platform’s own numbers across channels |
| Five or more channels including offline, two to three years of weekly history | MMM for budget splits | Lift tests to calibrate the model | Meridian or a managed vendor such as Circana | User-level attribution as the only view; it cannot see TV, print or radio |
If your firm sits between rows, start with the simpler one. A model fed by clean UTM tags and dated CRM stages beats a sophisticated one fed by guesses. For usage figures on each method, our marketing attribution statistics page breaks down how many marketers run first touch, last touch, multi-touch, MMM and lift tests.
How to switch attribution models without breaking your reports
- Log the date. GA4 rewrites history when you change the reporting model, so a month-over-month chart will silently change. Note the switch date in your report.
- Run old and new side by side for one full sales cycle. Build the five-column table above for your own top channels under both models. Any channel whose credit moves more than you would spend on it in a month deserves a lift test before you move budget.
- Fix the milestones first. W-shaped and full path need lead-created and opportunity-created dates set by automation, not by hand.
- Keep lookback windows stable. GA4 lookback changes apply only going forward, and Meta’s default changed in June 2026, so a window change can look like a performance change.
- Decide in money, not in conversions. Attribute signed revenue or pipeline value, as in the $12,000 example, so a cheap lead and a signed client do not count the same.
If you want a second pair of eyes on which model fits your funnel and what your CRM needs before W-shaped reports can be trusted, you can book a consultation.
Ready to scale your revenue?
Book a free 30-min consultation. We’ll diagnose your growth bottleneck and map out the 3 highest-leverage moves for your business.
Frequently asked questions
What is the difference between first touch and last touch attribution?
First touch gives 100% of the credit for a conversion to the first interaction a person had with you, so it shows which channels introduce new prospects. Last touch gives 100% to the final interaction before the conversion, so it shows which channels close. On a five-touch journey, the two can credit completely different channels with the same sale, which is why neither should decide budget on its own.
Which attribution models are left in GA4 and Google Ads?
GA4 offers data-driven, paid and organic last click, and Google paid channels last click. First click, linear, time decay and position-based models have been unavailable since November 2023. Google Ads keeps data-driven, last click and external attribution, after switching remaining rules-based conversion actions to data-driven in September 2023. Google said fewer than 3% of web conversions used the retired models.
What is the difference between U-shaped and W-shaped attribution?
U-shaped (position-based) attribution usually gives 40% to the first touch, 40% to the last touch and splits 20% across the middle. W-shaped gives 30% each to the first touch, the lead-creation touch and the opportunity-creation touch, and shares the remaining 10%. Full path adds closed-won as a fourth milestone at 22.5% each. Definitions vary: Marketo Measure's U-shaped is 50/50 between first touch and lead creation.
Is data-driven attribution better than last click?
For bidding inside Google Ads it usually fits better, because it compares converting and non-converting paths instead of applying a fixed rule, and Google made it the default in Google Ads and GA4. Google recommends at least 200 conversions and 2,000 ad interactions in 30 days for precise results. Its limit is scope: each platform's model only sees that platform's data, so check it with a lift test.
Which HubSpot plan includes multi-touch attribution reports?
Contact create attribution reports need Marketing Hub or Content Hub Professional or Enterprise. Deal create and deal revenue attribution need Marketing Hub Enterprise. Professional starts at $800 per month billed annually plus $3,000 onboarding; Enterprise starts at $3,600 per month plus $7,000 onboarding. HubSpot now offers first touch, last touch, linear, time decay and Empirical, which replaced its U-shaped and W-shaped models.
What is the difference between attribution, marketing mix modeling and incrementality testing?
Attribution splits credit for individual conversions across tracked touchpoints. Marketing mix modeling uses two to three years of weekly spend and sales data to estimate each channel's total contribution, including offline media. Incrementality testing holds out people or regions from the ads and measures the difference, which is the only one of the three that proves cause. Most mature teams use attribution for daily decisions and the other two to check it.
What attribution window does Meta use by default in 2026?
As of June 2026 Meta's default attribution setting is 7-day click, 1-day engage-through and 1-day view, replacing the long-standing 7-day click plus 1-day view, according to PPC Land. Meta renamed engaged-view to engage-through on March 3, 2026, and since January 12, 2026 the Ads Insights API no longer returns 7-day view or 28-day view windows.
More Growth, Strategy & Sales guides
- Workflow Automation: 12 Wins This Quarter
- YouTube Marketing for B2B & Service Businesses
- YouTube Marketing Strategy: A Business Playbook for Views That Become Leads
- The 4 Ps of Marketing: Product, Price, Place, Promotion
- A/B Testing: A Marketer’s Guide to Significance, Sample Size, and Avoiding False Wins
- Abandoned Cart Email: The 3-Email Sequence That Recovers Revenue
- All Analytics & Attribution guides →