
The average dental practice in the US takes in about $1.18 million a year: 136,140 dental office locations reported $160.2 billion in revenue in 2022, according to the Census Bureau’s Statistics of U.S. Businesses (NAICS 621210, Offices of Dentists). The typical practice is smaller than that average: more than 61% of dental firms took in under $1 million. Owner dentists who are general practitioners netted an average of $228,980 in 2025, per the ADA Health Policy Institute.
Short answer: Average revenue is about $1.18 million per dental office location (Census, 2022) and $965,660 in gross billings per general dentist owner (ADA, 2025). The median dental firm takes in between $500,000 and $999,999. An owner keeps roughly 20% to 31% of revenue as personal pre-tax income: ADA’s 2025 averages are $228,980 for general dentist owners and $372,460 for specialist owners.
Most pages ranking for this question repeat one ADA number, or quote a “30% to 40% profit margin” with no source. Below, I compiled the three primary datasets that actually measure dental practice money: Census receipts, IRS tax returns and the ADA’s own survey. I computed the averages myself (receipts divided by establishments or returns), and I explain why each source gives a different answer. At the end there is a copy-ready P&L worksheet you can fill in with your own numbers.
Dental practice average revenue: what each primary source says
Three sources count dental practice revenue, and each one counts something different. Census counts every employer dental office. The IRS counts unincorporated dentists who file a Schedule C. The ADA surveys individual dentists and reports billings per dentist, not per practice. Read the “what it measures” column before you compare yourself to any of them.
| Source and year | What it measures | Average | How it was calculated |
|---|---|---|---|
| Census SUSB 2022, NAICS 621210 | Revenue per dental office location (establishment), employer offices only | $1,176,698 | $160,195,607,000 receipts ÷ 136,140 establishments |
| Census SUSB 2022, NAICS 621210 | Revenue per dental firm (a firm can own several offices) | $1,329,557 | $160,195,607,000 ÷ 120,488 firms |
| ADA HPI Survey of Dental Practice, 2025 | Gross billings per dentist, general dentist owners | $965,660 | Published by ADA (median $893,510) |
| ADA HPI Survey of Dental Practice, 2025 | Gross billings per dentist, specialist owners | $1,213,040 | Published by ADA (median $993,490) |
| IRS SOI, Table 1, tax year 2023 | Business receipts per sole proprietorship return, offices of dentists | $319,670 | $17,951,725,000 ÷ 56,157 returns |
| CMS National Health Expenditure Accounts, 2024 | Total US spending on dental services (all payers) | $189.2 billion total | Published by CMS (Table 12) |
Why they differ:
- Census is the best answer to “dental office average revenue.” It covers every dental office with at least one employee, includes DSO-owned locations, and reports receipts (money collected), not fees charged. It excludes offices with no employees.
- ADA numbers are per dentist. A three-dentist group practice billing $2.5 million shows up as about $833,000 per dentist. ADA’s “gross billings” are also defined as fees charged, so they run higher than what the practice actually collects after insurance write-offs.
- The IRS sole proprietor figure is low on purpose. Schedule C filers include part-time dentists and independent contractors working out of someone else’s office. Incorporated practices (S corporations, partnerships) are not in this table, and the IRS does not publish dentist-level detail for them.
For context on the size of the market: Americans spent $189.2 billion on dental services in 2024, up 6.6% from 2023, per CMS NHE historical tables. Patients paid 38.3% of that out of pocket, private insurance paid 41.3%, Medicaid 8.0% and Medicare 6.7%.
What a typical dental office brings in (the median is lower than the average)
The $1.18 million average is pulled up by a small number of very large groups. Census also publishes dental firms by revenue band, which lets you see where the typical practice sits. I added the cumulative share and the average per firm in each band.
| Annual receipts of the firm | Dental firms | Share of firms | Cumulative share | Average receipts per firm | Share of all dental revenue |
|---|---|---|---|---|---|
| Under $100,000 | 6,734 | 5.6% | 5.6% | $52,012 | 0.2% |
| $100,000 to $499,999 | 33,200 | 27.6% | 33.1% | $296,863 | 6.2% |
| $500,000 to $999,999 | 33,814 | 28.1% | 61.2% | $733,682 | 15.5% |
| $1 million to $2.49 million | 35,800 | 29.7% | 90.9% | $1,515,784 | 33.9% |
| $2.5 million to $4.99 million | 7,988 | 6.6% | 97.5% | $3,332,569 | 16.6% |
| $5 million and over | 2,952 | 2.5% | 100% | n/a (12 bands combined) | 27.7% |
Source: U.S. Census Bureau, SUSB 2022, U.S. 6-digit NAICS by enterprise receipts size, NAICS 621210. Employer firms only. Averages and cumulative shares computed by dividing the published receipts by the published firm counts.
Three things stand out:
- The median dental firm takes in between $500,000 and $999,999. The 50% mark falls inside that band (33.1% of firms are below $500,000 and 61.2% are below $1 million).
- About 9 in 10 dental firms are under $2.5 million. Only 9.1% of firms reach $2.5 million or more, but they collect 44.3% of all dental office revenue.
- The largest groups are a different business. 104 firms with $100 million or more in receipts ran 7,645 locations and collected 10.0% of all dental office revenue in 2022.
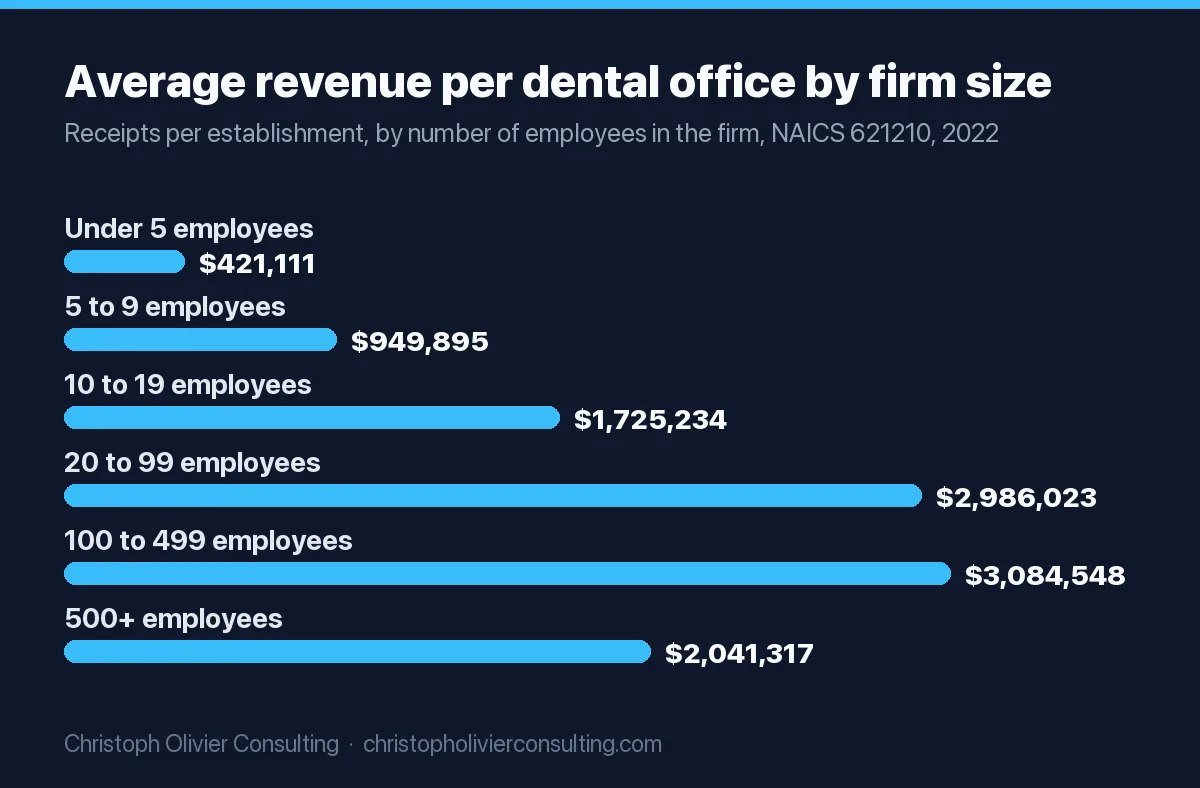
Revenue also tracks headcount closely. Census reports the same data by the firm’s number of employees, shown per location in the chart below. A dental office with fewer than five employees averaged $421,111, while one in a 10 to 19 employee firm averaged $1,725,234. Across all employer offices, the average was 7.6 employees and $155,235 of revenue per employee.
Dental office average revenue by state
Average receipts per dental office location vary by about $800,000 between states. These are the five highest and five lowest, computed from the SUSB 2022 state file (receipts ÷ establishments, NAICS 621210):
| State | Dental offices | Average receipts per office |
|---|---|---|
| South Dakota | 319 | $1,792,743 |
| Delaware | 286 | $1,732,598 |
| North Dakota | 289 | $1,690,737 |
| Wisconsin | 1,935 | $1,682,737 |
| Minnesota | 1,884 | $1,652,242 |
| United States | 136,140 | $1,176,698 |
| Kentucky | 1,463 | $1,026,166 |
| New Jersey | 4,582 | $1,017,901 |
| Hawaii | 589 | $1,007,037 |
| Utah | 1,781 | $995,061 |
| California | 22,642 | $983,403 |
Higher average revenue does not mean higher profit. Denser markets like California and New Jersey have more, smaller offices competing for the same patients. The ADA data point the same way: revenue per general dentist rose 11.9% in rural areas between the 2016 to 2020 and 2021 to 2025 periods, while it fell 0.1% in urban areas (inflation-adjusted, ADA HPI trends slide deck, 2026).
How much does a dentist practice owner make?
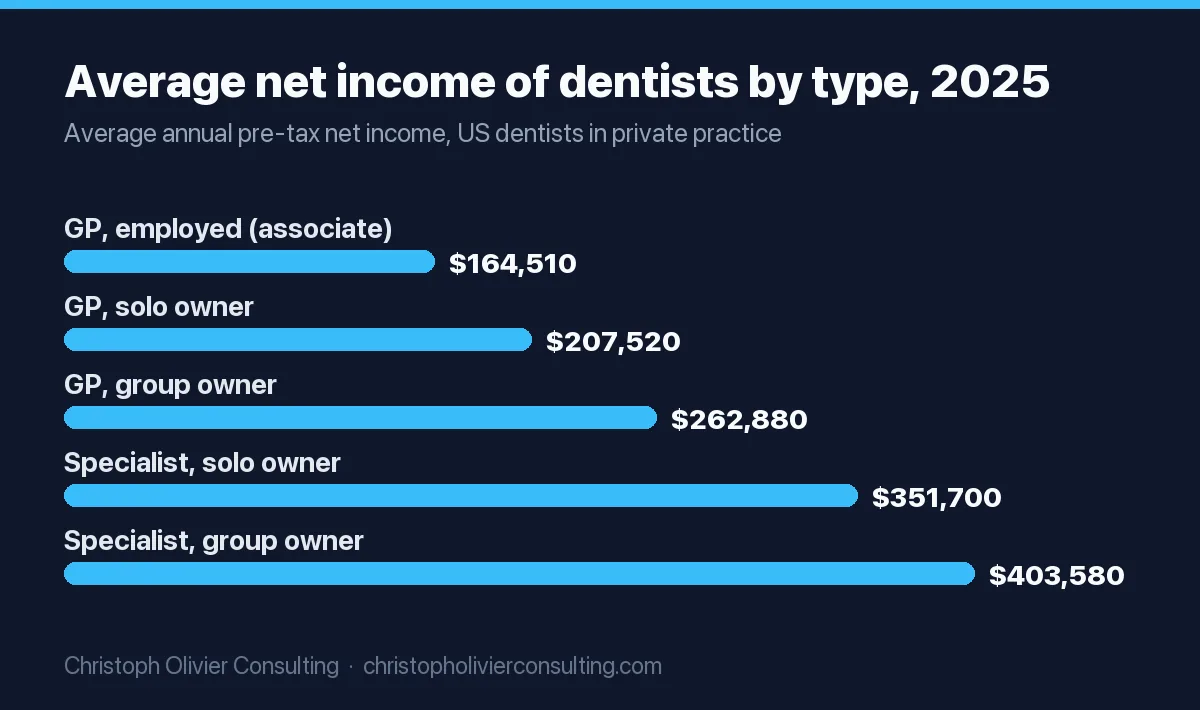
The ADA’s 2026 Survey of Dental Practice (covering 2025) is the only primary source that splits dentist income by ownership. “Net income” here means the dentist’s personal pre-tax income from the practice, including retirement plan contributions. For incorporated practices, the owner’s salary counts as net income.
| Dentist type, 2025 | Average net income | 25th percentile | Median | 75th percentile |
|---|---|---|---|---|
| General dentist, all owners | $228,980 | $137,010 | $199,140 | $295,370 |
| General dentist, solo owner | $207,520 | $115,200 | $179,360 | $270,210 |
| General dentist, owner in a group (nonsolo) | $262,880 | $171,230 | $217,490 | $318,090 |
| General dentist, employed (associate) | $164,510 | $129,280 | $165,520 | $191,470 |
| Specialist, all owners | $372,460 | $190,820 | $259,550 | $436,420 |
| Specialist, solo owner | $351,700 | $165,970 | $259,180 | $398,550 |
| Specialist, owner in a group (nonsolo) | $403,580 | $197,930 | $299,960 | $481,330 |
| Pediatric dentist (all) | $328,500 | $186,720 | $245,300 | $381,410 |
Source: ADA Health Policy Institute, 2026 Survey of Dental Practice, Tables 1 and 3. Weighted survey results, 1,113 responses (1.9% response rate). ADA did not publish other specialties for 2025 because of too few responses.
So a general dentist who owns a practice earns about $64,000 more on average than an associate ($228,980 versus $164,510), and the gap is narrowing. ADA reports that inflation-adjusted owner GP income fell by about $23,000 between the 2011 to 2015 and 2021 to 2025 periods, while associate income was essentially unchanged (ADA trends deck). Ownership itself is shrinking too: 72.5% of US dentists owned their practice in 2023, down from 84.7% in 2005, and 17% were affiliated with a DSO in 2025 (ADA HPI dental practice research).
Be careful with BLS figures when the question is owner income. The BLS Occupational Outlook Handbook lists a median wage of $170,950 for general dentists and $176,110 for all dentists in May 2025, but BLS pay data do not include self-employed workers, who are about 12% of dentists in its count. BLS numbers describe employed dentists, not practice owners.
The IRS view of the smallest owners: the 42,019 dentist sole proprietors who reported a profit in tax year 2023 averaged $122,336 in net income on $378,830 of receipts (IRS SOI Table 1). Another 14,138 returns, 25.2% of all dentist Schedule C filers, reported no net profit.
Can a dentist make $500,000 a year owning a practice?
Yes, but it puts you above the 75th percentile of every owner group the ADA publishes. The 75th percentile is $295,370 for general dentist owners and $481,330 for specialists who own a group practice. A $500,000 owner income is a top-quartile outcome even for specialists.
The revenue math shows why. Owners keep roughly 20% to 31% of revenue as personal income (see the margin section below). At those rates:
- At the IRS sole proprietor margin of 27.1%, $500,000 of net income needs about $1.85 million in collections.
- At the ADA general dentist owner ratio of 23.7% (average net income ÷ average gross billings), it needs about $2.11 million.
- At the solo general dentist ratio of 19.5%, it needs about $2.56 million.
One dentist rarely produces that alone. ADA’s solo general dentists billed an average of $621 per practice hour in 2025, and general dentist owners spent an average of 1,726 hours a year in the office. Billing $2 million personally would take about $1,159 per hour at that schedule. That is why $500,000 incomes usually come from adding associates, hygiene capacity or a specialty case mix, which is the 9.1% of firms over $2.5 million in the Census table above.
Dental practice average profit: how profitable is owning a dental practice?
“Profit margin” means three different things in dentistry, and that is why you see answers ranging from 4% to 40%. Here is what the primary data say for each definition.
| Definition of “profit” | Figure | Source and year | Use it to answer |
|---|---|---|---|
| Owner’s pre-tax income ÷ revenue, unincorporated (Schedule C) | 27.1% all filers; 32.3% among profitable filers | IRS SOI, tax year 2023, offices of dentists | “What share of revenue does the owner keep?” |
| Owner net income ÷ gross billings per dentist | 23.7% GP owners; 19.5% GP solo; 30.7% specialist owners | ADA SDPI 2025, Tables 1 and 5 (ratio of averages, my calculation) | “How much of each billed dollar becomes owner income?” |
| Practice expenses excluding owner pay ÷ gross billings (“overhead”) | 57.6% GP owners; 51.2% specialist owners | ADA SDPI 2025, Tables 5 and 13 (ratio of averages, my calculation) | “What is normal overhead?” |
| All expenses including the owner’s salary ÷ collections, incorporated owners | 96.2% (leaves about 3.8%) | ADA SDPI 2025, Table 17 (published) | “How much is left in the corporation after the owner is paid?” |
So the honest answer to “how profitable is a dental office” is: the owner typically keeps about a quarter of revenue as personal pre-tax income, and overhead (everything except the owner) runs a bit under 60% of billings. Incorporated practices pay most of the remainder out as owner salary, which is why ADA finds corporate expenses equal to 96.2% of collections. Note that ADA billings and expenses come from different respondent counts and billings are fees charged rather than collected, so the ADA ratios will not add up to exactly 100%.
Margins also vary widely. A quarter of dentist Schedule C filers reported no profit in 2023, and the ADA’s gap between the 25th and 75th percentile of general dentist owner income is $158,360. If you want to see how dentistry compares with other industries on a like-for-like basis, our profit margin by industry table uses IRS and Census definitions for 94 industries.
What is a good profit margin for a dental practice?
Using the primary data above, a practical benchmark for an owner-operated practice is:
- Below 20% owner income as a share of collections: below the ADA solo GP ratio (19.5%). Look at overhead first.
- About 24% to 27%: in line with the ADA general dentist owner ratio (23.7%) and the IRS sole proprietor margin (27.1%).
- Above 31%: at or above the ADA specialist owner ratio (30.7%) and close to the 32.3% margin of profitable dentist sole proprietors.
These bands are my reading of the published ratios, not an ADA standard. The widely repeated “30% to 40%” figure appears in vendor blogs without a primary source; it is only reachable in the upper part of the range.
Where the money goes: dental practice overhead by line item
Neither ADA nor Census publishes a full public line-item breakdown for 2025. These are the categories that primary sources do publish, as a share of revenue:
| Expense line | Share of revenue | Source |
|---|---|---|
| Payroll, all employer dental offices (W-2 pay, includes associates and incorporated owners on payroll) | 37.2% | Census SUSB 2022: $59.58 billion payroll ÷ $160.20 billion receipts |
| Payroll, unincorporated dentists (staff wages only; the owner is not on payroll) | 25.6% | IRS SOI 2023: $4.60 billion ÷ $17.95 billion |
| Rent on business property | 4.0% | IRS SOI 2023 |
| Depreciation | 3.2% | IRS SOI 2023 |
| Interest paid | 1.0% | IRS SOI 2023 |
| Equipment rent | 0.2% | IRS SOI 2023 |
| Supplies, lab fees, marketing, software, insurance | Not published as shares in these sources | Track in your own P&L (worksheet below) |
Staff wages are the line under the most pressure. ADA’s survey puts the average hourly wage of dental hygienists at $49.20 in 2025 (up from $39.30 in 2019) and dental assistants at $25.30 (up from $20.40), across all dentists surveyed. The average payroll per employee in employer dental offices was $57,734 in 2022 (Census, payroll ÷ employment).
Why dental practice profits are being squeezed
The ADA calls it a “fiscal squeeze.” For general dentists, inflation-adjusted revenue per dentist rose 1.4% while expenses per dentist rose 4.9% when comparing 2016 to 2020 with 2021 to 2025, according to ADA HPI’s trends report. As a result, average inflation-adjusted GP income was flat from 2024 to 2025 after declining for 15 years, as ADA News reported in October 2026.
Payer mix is part of the story. In 2025, general dentist owners received 50.0% of billings from private insurance carriers, 40.2% directly from patients, 7.3% from government programs and 2.5% from other sources (ADA SDPI Table 11). Practices that lean on PPO fee schedules feel cost inflation without a matching fee increase. Demand itself is not the problem: new patients waited an average of 16 days for a first appointment with a general dentist in 2025, versus 7.9 days in 2019 (ADA SDPI Table 22).
What is the 50-40-30 rule in dentistry?
It is not a financial rule. The 50:40:30 rule is a smile-design guideline for the contact areas between upper front teeth: the contact between the two central incisors spans about 50% of the central incisor’s height, the contact between central and lateral incisors about 40%, and between lateral incisor and canine about 30%. It is described in “Principles of smile design” (Journal of Conservative Dentistry, 2010). I found no ADA, IRS or Census source that defines a “50-40-30” budgeting rule for dental practice finances, so treat any such rule you see online as an opinion, not a benchmark.
Dental practice P&L worksheet (copy and fill in)
Use this to compare your practice against the primary-source benchmarks above. Fill in the “Your practice” column from your accounting software for the last 12 months, then divide each line by net collections.
| Line | Your practice ($) | Your % of net collections | Benchmark (source) |
|---|---|---|---|
| A. Gross production (fees charged) | n/a | GP owner $965,660 per dentist (ADA 2025) | |
| B. Adjustments and write-offs (PPO, Medicaid, discounts) | B ÷ A | Not published | |
| C. Net collections (A minus B, minus uncollected) | 100% | Average office $1,176,698 (Census 2022) | |
| D. Staff wages, payroll taxes, benefits (exclude owner) | D ÷ C | 25.6% staff payroll, unincorporated (IRS 2023) | |
| E. Associate dentist pay | E ÷ C | Associate GP average $164,510 (ADA 2025) | |
| F. Rent or mortgage interest on the office | F ÷ C | Rent 4.0% (IRS 2023) | |
| G. Dental supplies | G ÷ C | Track trend year over year | |
| H. Lab fees | H ÷ C | Track trend year over year | |
| I. Equipment depreciation, leases, loan interest | I ÷ C | Depreciation 3.2% + interest 1.0% (IRS 2023) | |
| J. Marketing | J ÷ C | Set from your new-patient target | |
| K. Software, insurance, professional fees, other | K ÷ C | Track trend year over year | |
| L. Total overhead (D through K) | L ÷ C | About 51% to 58% of billings (ADA 2025, my calculation) | |
| M. Owner pre-tax income (C minus L) | M ÷ C | 23.7% GP owners (ADA); 27.1% (IRS) |
How to read your result:
- If M is under 20%, sort lines D to K by their share and start with the largest. Payroll is almost always first.
- If B is large (write-offs above roughly a quarter of production), your fee schedules are the constraint, not your volume. Review which PPO plans produce most of your write-offs.
- If C is below $500,000 per full-time dentist, you are in the bottom third of dental firms by revenue (Census). The fix is usually schedule fill and case acceptance before any cost cutting.
- Recalculate every quarter. A single year can mislead; the ADA’s own medians move by $10,000 to $50,000 between survey years.
Using these benchmarks to grow revenue
Revenue per dentist is driven by hours, fees and how full the schedule is. ADA’s 2025 data put the median general dentist solo practice at $529 of billings per practice hour and $481 per patient visit, with general dentists averaging 3,307 patient visits a year including hygiene appointments. Each extra filled hour is worth roughly the hourly figure, so filling five empty hours a week is worth about $130,000 a year at the median rate (5 × $529 × 49 weeks). That arithmetic is the starting point for any marketing budget.
If you are deciding how much to invest in patient acquisition, our guide to the dental office marketing budget shows how to size spend from collections and new-patient value, and dental marketing: what works and what it costs per patient breaks down channel costs. Practices with a cosmetic or implant mix, the ones most likely to sit above $2.5 million, should read the cost-per-case playbook for cosmetic dentists. The same retention-first logic runs through our guide on how healthcare practices attract and keep patients.
In my view, the most useful number on this page is not the average but the gap between your owner-income share and the 24% to 27% range. If you want a second set of eyes on your P&L and growth plan, you can book a consultation.
How these figures were compiled
- Census: Statistics of U.S. Businesses 2022 (released April 2025), NAICS 621210 Offices of Dentists, built from the 2022 County Business Patterns and Economic Census. Employer businesses only. I divided published receipts by published establishments or firms. Size classes are based on the whole firm (enterprise), not the single office. The ADA cites a newer establishment count of 135,665 from County Business Patterns 2023, which does not include receipts.
- IRS: SOI Nonfarm Sole Proprietorship Statistics, Table 1, tax year 2023 (published March 2026). Estimates based on samples of Schedule C returns. Averages are totals divided by number of returns.
- ADA: Income, Gross Billings, Expenses, and Characteristics: selected 2025 results from the 2026 Survey of Dental Practice. Survey of 59,951 sampled dentists with 1,113 responses; figures are weighted and not inflation-adjusted. The ratios I calculated divide one published average by another, so they are approximations, not ADA statistics.
- CMS: National Health Expenditure Accounts, Table 12, Dental Services Expenditures, 2024.
- BLS: Occupational Outlook Handbook, Dentists, May 2025 wage data, which exclude self-employed workers.
Ready to scale your revenue?
Book a free 30-min consultation. We’ll diagnose your growth bottleneck and map out the 3 highest-leverage moves for your business.
Frequently asked questions
What is the average revenue of a dental practice?
About $1.18 million per dental office location. Census Statistics of U.S. Businesses data for 2022 show 136,140 dental offices (NAICS 621210) with $160.2 billion in receipts. Per firm it is about $1.33 million. The median dental firm is smaller, with receipts between $500,000 and $999,999, because a few large groups pull the average up.
How much does a dental practice owner make?
In the ADA Health Policy Institute's 2026 Survey of Dental Practice, general dentist owners averaged $228,980 in net income for 2025 (median $199,140) and specialist owners averaged $372,460 (median $259,550). Employed general dentists averaged $164,510. Net income is personal pre-tax income from the practice, including retirement contributions.
What is the average profit margin for a dental practice?
Owners typically keep about a quarter of revenue as personal pre-tax income. IRS data for tax year 2023 show dentist sole proprietors kept 27.1% of receipts as net income. In ADA 2025 data, general dentist owner income equals about 23.7% of gross billings per dentist, and overhead excluding owner pay is about 57.6% of billings.
How profitable is owning a dental office compared with being an associate?
Ownership still pays more on average, but the gap is shrinking. ADA reports 2025 average net income of $228,980 for general dentist owners versus $164,510 for employed general dentists. Comparing 2011 to 2015 with 2021 to 2025, inflation-adjusted owner income fell about $23,000 while associate income was essentially unchanged.
Can a general dentist make $500,000 a year owning a practice?
It is possible but uncommon. The ADA's 75th percentile for general dentist owners in 2025 was $295,370, so $500,000 is well into the top quarter. At owner margins of about 24% to 27%, it needs roughly $1.85 million to $2.1 million in collections, which usually requires associates or a high-value case mix.
What is the 50-40-30 rule in dentistry?
It is a smile-design guideline, not a business rule. It describes the contact areas between upper front teeth: about 50% of the central incisor height between the two centrals, 40% between central and lateral incisors, and 30% between lateral incisor and canine. No ADA, IRS or Census source defines a 50-40-30 financial benchmark.
What is the average overhead for a dental practice?
ADA's 2025 survey shows average practice expenses excluding owner pay of $556,450 per general dentist owner against average gross billings of $965,660, about 57.6%. For specialist owners it is about 51.2%. For incorporated owners, expenses including the owner's salary equal 96.2% of collections, because most profit is paid out as salary.
Practice economics benchmarks