

Most dental practices should plan a marketing budget of about 2% to 5% of collections, and the number you can defend comes from your cost per new patient, not from a rule of thumb. For context, US dental offices reported advertising equal to 1.18% of receipts (sole proprietors) and 1.56% (corporations) on their 2023 tax returns, while dental marketing agencies recommend 2% to 10% for established practices and up to 25% for new ones. On a solo general practice billing the 2025 ADA median of $995,100, 3% is $29,853 a year, or about $2,488 a month.
Short answer: Start at 1.5% of collections to hold your patient base, 3% to grow, and 5% or more only for a new office, a new location or an elective service push (implants, aligners, veneers). Then check it from the bottom up: new patients you want each month times what one costs. In the worked example below, a solo general dentist who wants 15 new patients a month from Google Search needs about $1,900 a month in ad spend before website and SEO costs.
Below: what dentists actually spend according to IRS data, where the popular percentages come from, a budget calculator worked out for three practice sizes, a cost per new patient target table built from stated inputs, and how the math changes for cosmetic, implant and orthodontic work. The wider channel playbook lives in our guide to dental marketing and what it costs per patient; this page is the budget.
What dental practices actually spend on advertising: the IRS numbers
No dental body publishes an audited average marketing budget. The ADA Health Policy Institute’s Survey of Dental Practice reports income, gross billings and total practice expenses, but it does not break out marketing. The best public record of what dentists really spend is the advertising line on their business tax returns, which the IRS Statistics of Income division tabulates by industry. NAICS 621210 is “Offices of dentists.”
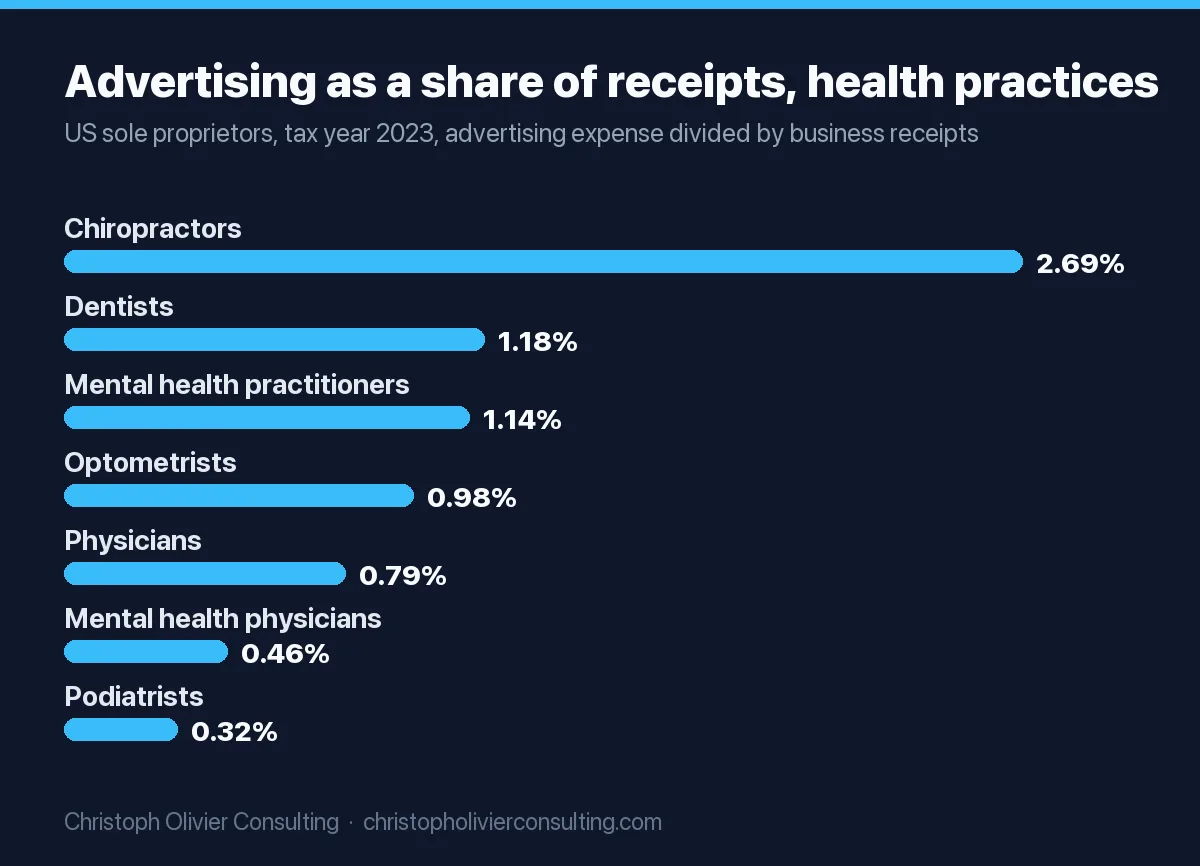
| Offices of dentists, tax year 2023 | Returns | Business receipts | Advertising expense | Advertising as % of receipts | Advertising per return |
|---|---|---|---|---|---|
| Sole proprietors (Schedule C) | 56,157 | $17.95 billion | $212.1 million | 1.18% | $3,776 |
| Active corporations (C and S corps) | 101,508 | $129.40 billion | $2.02 billion | 1.56% | $19,859 |
| Both combined | 157,665 | $147.35 billion | $2.23 billion | 1.51% | n/a |
Sources: IRS SOI Nonfarm Sole Proprietorships, Table 2, Tax Year 2023 and Corporation Returns, Table 5.1, Tax Year 2023. Percentages and per-return figures are our calculation from those tables. Partnerships are not included.
Three things to take from this:
- Bigger offices spend a bigger share. The average incorporated dental return reported about $1.27 million in receipts and spent 1.56% on advertising. The average sole proprietor reported about $320,000 and spent 1.18%.
- Dentists advertise more than physicians but less than chiropractors. Among sole proprietors in the same IRS table, physicians spent 0.79% of receipts on advertising and chiropractors 2.69%. The chart in this section shows the full set of health practices.
- The tax line understates total marketing. “Advertising” is media and promotion. A practice’s website build, SEO retainer, call tracking, review software and the office manager’s marketing hours often sit in other lines (professional services, contract labor, software, wages). So 1.2% to 1.6% is a floor for what dentists put into marketing, not the full figure.
If you want to compare dentistry with law, accounting, real estate and public companies on the same basis, our advertising to sales ratio by industry dataset uses the same IRS tables.
Where the “5% to 10%” dental marketing budget percentage comes from
Search for a dental marketing budget percentage and you get numbers between 2% and 25%. Here is who says what, and what each figure rests on.
| Figure you will see quoted | Source | What it is based on | What it measures |
|---|---|---|---|
| 1.18% to 1.56% of receipts | IRS SOI, tax year 2023 (tables above) | All dental tax returns, sample-based IRS estimates | Reported advertising expense only |
| 2% to 3% to maintain, 3% to 5% slow growth, 5% to 7% fast growth | Studio 8E8 and Dental Intel | Agency experience (“about a decade”), no dataset published | Recommended total marketing, existing practices |
| 10%, 18% or 25% for new offices | Dental Intel | No data cited; tiers by growth speed and competition | Recommended total marketing, startups |
| 5% to 10% of gross revenue | Dr. Marketing | No data cited | Recommended total marketing |
| 4.68% of revenue | Align Technology 2025 10-K | Audited filing: $188.7 million advertising on $4.03 billion revenue | A manufacturer’s consumer advertising for Invisalign, not a practice |
| No percentage given | ADA, Create Your Marketing Plan | Guidance only | Says an in-house marketer, usually the office manager, should expect about 25% of their time (about 10 hours a week) |
The agency figures are not wrong, they measure something different. They describe total marketing for a practice that wants to grow, written by firms that sell marketing. The IRS figure describes media spend across every dental office in the country, including the many that do little marketing at all. A practice at 3% total marketing is spending roughly double the national advertising ratio, which is about right for an office that is actively adding patients.
We searched the SEC’s XBRL advertising expense data for 2023 to 2025 and found no dental practice or DSO among the filers, so there is no audited DSO benchmark to quote. The only dental company reporting the figure is Align, whose 10-K describes advertising “expensed as incurred” for the years 2023 to 2025 ($201.2 million, $185.0 million, $188.7 million).
Dental marketing budget calculator: three practice sizes worked out
Use collections, not production. The inputs below are from the ADA’s 2025 Survey of Dental Practice (released 2026), which reports gross billings per owner dentist: $995,100 median for a solo general dentist and $836,540 average per dentist in a nonsolo general practice. Billings are fees charged, so your actual collections will be lower; swap in your own number.
Formula: annual collections x budget % = annual marketing budget. Divide by 12 for the monthly figure.
| Practice | Collections input | 1.5% (hold the base) | 3% (steady growth) | 5% (aggressive growth) |
|---|---|---|---|---|
| Solo general dentist | $995,100 (ADA 2025 median, solo GP owner) | $14,926 a year ($1,244 a month) | $29,853 a year ($2,488 a month) | $49,755 a year ($4,146 a month) |
| 3-dentist general group | $2,509,620 (3 x $836,540 ADA 2025 nonsolo GP average) | $37,644 ($3,137 a month) | $75,289 ($6,274 a month) | $125,481 ($10,457 a month) |
| 8-dentist, multi-location group | $6,692,320 (8 x $836,540) | $100,385 ($8,365 a month) | $200,770 ($16,731 a month) | $334,616 ($27,885 a month) |
The 1.5% column is close to the 1.51% that dental offices reported as advertising in 2023. The 3% and 5% columns match the middle and top of the agency ranges for existing practices. These are planning tiers, not benchmarks.
Check the percentage from the bottom up
A percentage tells you what is affordable. The patient math tells you what is needed. Two worked examples, using Google Search cost per lead from Delmain’s June 2026 benchmark of its dental ad accounts and an assumed booking rate (leads that book and show up), which you should replace with your own front-desk numbers:
- Solo general dentist, 15 new patients a month from search. General “dentist” campaigns averaged $50.60 per lead. At a 40% booking rate, one patient costs $50.60 / 0.40 = $126.50. Fifteen patients cost $1,897.50 a month, or $22,770 a year: 2.3% of $995,100 before website, SEO and software. Add those fixed costs and the solo office lands near the 3% tier.
- 3-dentist group, 40 new patients a month with an elective mix. 30 general patients at $126.50 = $3,795. 6 implant patients at $107.63 per lead and a 25% booking rate ($430.52 each) = $2,583. 4 aligner patients at $212.63 per lead and 25% booking ($850.52 each) = $3,402. Total media: $9,780 a month, or $117,362 a year, which is 4.7% of $2,509,620. Elective goals push a group toward the 5% tier fast.
If the bottom-up number is far above your chosen percentage, either the patient goal is too high for this year or your booking rate is the real problem. Fixing phones is cheaper than buying more leads.
How to split the budget by channel
This is the starting split I use for dental practices at the 3% tier. It is an opinion to adjust after 90 days of cost per patient data, not an industry average. Search gets the biggest share because it captures people already looking for a dentist; branded search (your practice name) stays funded because Delmain’s data shows it converting at 29.9% for $7.64 a lead.
| Channel | Solo GP ($29,853) | 3-dentist group ($75,289) | 8-dentist group ($200,770) |
|---|---|---|---|
| Google Search ads (branded + general dentist) | 45%: $13,434 | 40%: $30,116 | 35%: $70,270 |
| Website, Google Business Profile, local SEO | 30%: $8,956 | 25%: $18,822 | 20%: $40,154 |
| Elective campaigns (implants, aligners, cosmetic: landing pages, Meta, video) | 0%: $0 | 15%: $11,293 | 20%: $40,154 |
| Reviews, recall and reactivation of lapsed patients | 10%: $2,985 | 10%: $7,529 | 10%: $20,077 |
| Community, sponsorships, referral program | 5%: $1,493 | 5%: $3,764 | 5%: $10,038 |
| Call tracking, reporting, coordination | 10%: $2,985 | 5%: $3,765 | 10%: $20,077 |
Do not leave staff time out. The ADA’s own planning guide expects the in-house marketer to spend about 10 hours a week on it. At an office manager’s wage, that is a real cost even if it never shows on a marketing invoice. For the general method behind these tiers, including plan vs actual tracking, see how to set a marketing budget.
Cost per new patient: what you can afford to pay
The question behind every dental marketing budget is the most you can pay for a new patient. Here is a target table built only from stated inputs, so you can rerun it with your own numbers.
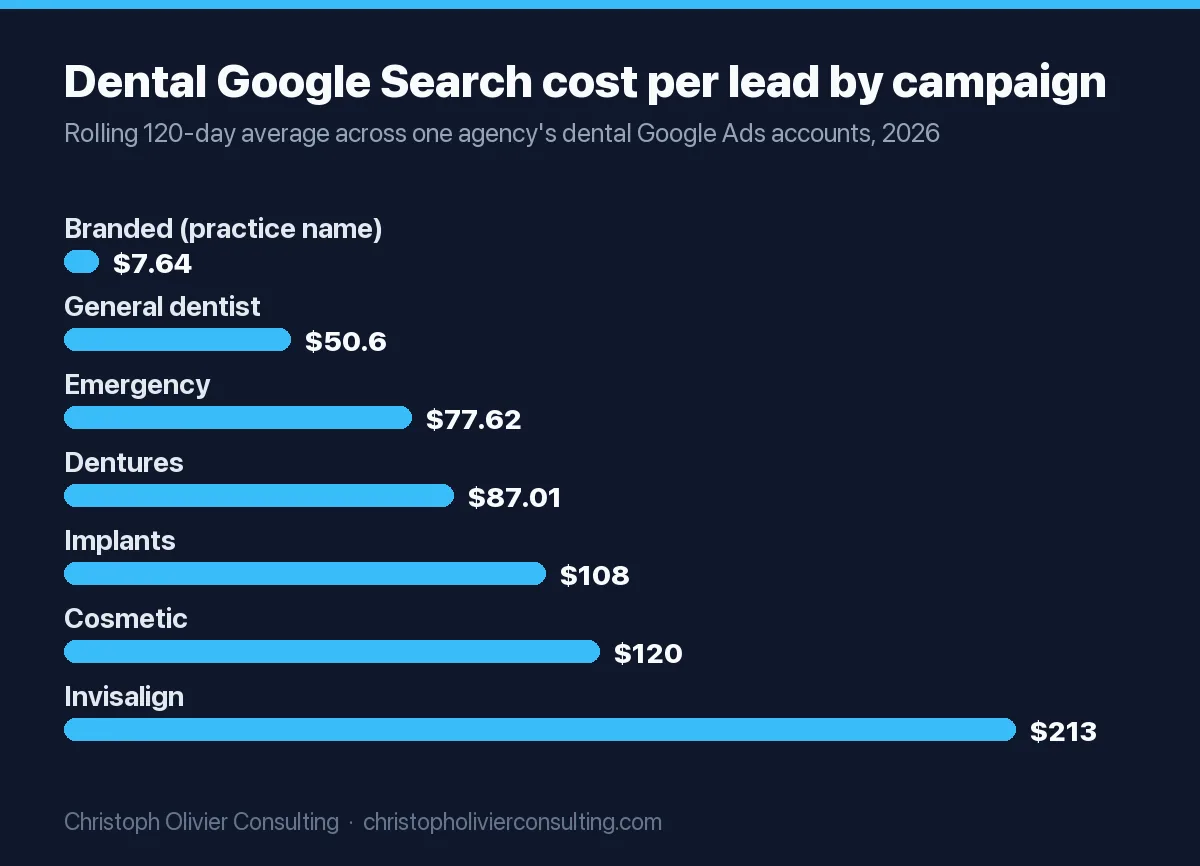
Inputs. First-year revenue per patient: $887 for a general patient, the average annual dental spending per person with any dental visit in 2021 (all payers, 2021 dollars) from AHRQ MEPS Statistical Brief #555; case fees for elective work from the Synchrony/CareCredit Average Procedural Cost Study (2023 national averages: $2,695 per implant, $5,108 for clear aligners, $1,765 per porcelain veneer). Owner margin: 42.4%, an estimate equal to 1 minus average practice expenses ($556,450) divided by average gross billings ($965,660) for general dentist owners in the ADA 2025 Survey of Dental Practice. That margin is before the owner’s own pay, so it is generous. Target: spend no more than half the first-year margin, so the patient pays back acquisition twice in year one.
| Patient type | First-year revenue | Margin at 42.4% (break-even ceiling) | Target cost per new patient (half) | Google Search cost per lead (Delmain 2026) | Minimum booking rate to hit target |
|---|---|---|---|---|---|
| General / hygiene patient | $887 | $376 | $188 | $50.60 | 27% |
| Single implant | $2,695 | $1,142 | $571 | $107.63 | 19% |
| Clear aligner case | $5,108 | $2,165 | $1,082 | $212.63 (Invisalign campaigns) | 20% |
| Six porcelain veneers | $10,590 | $4,488 | $2,244 | $119.62 (cosmetic campaigns) | 5.3% |
Read the last column first. A general-dentistry campaign only works if at least 27 of every 100 leads become patients, because the patient is worth little in year one. A veneer campaign can survive a booking rate as low as 5.3%. That is why cosmetic and implant practices can spend a far higher percentage of collections and still be profitable, and why a general practice with a weak phone process should fix that before raising its budget.
Two caveats. Delmain’s numbers come from a rolling 120-day window across its own accounts, and some rows are thin (13 cosmetic, 12 Invisalign and 20 implant campaigns), so treat them as directional. A broader panel, LocaliQ’s 2026 Search Advertising Benchmarks, puts the average dentist lead at $72.97 on an $8.00 click and a 10.67% conversion rate; at a 40% booking rate that is $182.43 per patient, just under the $188 general target. Cost-per-click detail for other industries is in our Google Ads CPC benchmarks.
What about lifetime value?
We looked for a published dental patient lifetime value study with a stated method and sample and did not find one; the figures quoted online come from vendors without methodology. Build your own instead: annual value per patient x expected years retained, where expected years = 1 / annual attrition rate. A practice that loses 20% of active patients a year keeps the average patient 5 years, so at $887 a year the undiscounted value is $4,435. Use first-year value for the budget ceiling and lifetime value only to decide how patient you can be with a channel. The full method is in our customer lifetime value guide.
General dentistry vs cosmetic, implant and orthodontic budgets
The single biggest mistake in dental budgeting is using one percentage for every service. The economics differ on payer mix, case value and lead cost.
| Practice focus | Who pays | Case value | Lead cost (Google Search) | Budget implication |
|---|---|---|---|---|
| General dentistry | General dentist owners: 50.0% of billings from private insurance, 40.2% direct patient payment, 7.3% government programs (ADA 2025) | $887 a year per patient (MEPS 2021) | $50.60 per lead (Delmain); $72.97 (LocaliQ, blended dental) | 1.5% to 3%. Win on search, reviews and recall. |
| Cosmetic | Not reported separately by the ADA | $1,765 per veneer; $10,590 for six | $119.62 per lead; 4.5% lead conversion | 3% to 5%+ is affordable if consults close. Spend on before and after proof, financing pages and follow-up. |
| Implants | Not reported separately by the ADA | $2,695 per implant; more for full arch | $107.63 per lead; 6.3% lead conversion | Budget per case, not per lead. Track lead to consult to case accepted. |
| Orthodontics and aligners | Specialist owners: 49.7% direct patient payment, 37.8% private insurance (ADA 2025) | $5,108 per aligner case | $212.63 per Invisalign lead; 3.5% lead conversion | Highest lead cost. Referral relationships with general dentists matter as much as ads, and Align spends $188.7 million a year advertising the brand that sends searchers to providers. |
Payer mix is from Table 11 of the ADA 2025 survey; specialist figures cover all specialists, not orthodontists alone, because the ADA had too few orthodontist responses to publish separately. Case values are national averages from the Synchrony/CareCredit study and vary by market. For the channel side of these service lines, see our playbooks on cosmetic dentist marketing and orthodontist marketing cost per start.
Marketing budget for a new dental office or a DSO-affiliated practice
New (de novo) office. You have no collections to take a percentage of, so use your year-one revenue goal. Dental Intel suggests 10% for slow growth in a less competitive market, 18% for moderate growth and 25% for fast growth in a competitive market. Those are agency recommendations, not measured averages, but the logic holds: a new office has no recall base, so almost every patient in year one is a paid or earned new patient. Run the bottom-up check every month. On a $600,000 year-one goal, 10% is $60,000, which at $126.50 per general patient buys about 474 patients if it all went to search; you will not need that many to reach the goal, so trim the percentage once booked patients show you the true cost.
DSO-affiliated practice. The ADA HPI estimates that 17.0% of US dentists were affiliated with a dental support organization in 2025, and its definition of a DSO includes an outside entity managing non-clinical functions “such as billing, marketing, human resources.” If a DSO runs your marketing, your budget question becomes what the management fee covers, how many new patients the DSO commits to deliver to your location, and whether you see cost per patient by channel. Ask for those three numbers in writing.
For scale: the BLS Quarterly Census of Employment and Wages counted 136,040 private dental office establishments employing 1,039,896 people in 2024. In a city, as Delmain notes, you can be bidding against dozens of practices for the same searcher, which is why a budget set without cost per patient data drifts.
Copy-ready dental marketing budget worksheet
Put these lines in a spreadsheet, one column per month. Fill the inputs once, then update actuals monthly.
- Collections, trailing 12 months (from your practice management system).
- Budget tier %: 1.5%, 3% or 5%. Annual budget = line 1 x line 2. Monthly = annual / 12.
- New patient goal per month, split by type (general, implant, aligner, cosmetic).
- Cost per lead by type: use your own ad account; until you have 90 days of data, use $50.60 general, $107.63 implant, $212.63 aligner, $119.62 cosmetic (Delmain 2026).
- Booking rate by type = new patients seen / leads, from call tracking and the schedule.
- Cost per new patient = line 4 / line 5. Pass if it is at or below the target in the cost per patient table; fail if it is above for two months running.
- Media needed = line 3 x line 6, summed across types.
- Fixed costs: website, SEO, review and recall software, call tracking, agency fees (from your actual invoices).
- Staff time: marketing hours per week x hourly wage x 52 / 12.
- Total monthly marketing = line 7 + line 8 + line 9. Compare with line 2. If line 10 is more than 1.5 times line 2, cut the patient goal or fix the booking rate before spending more.
If you want a second set of eyes on the inputs, especially the booking rate and the elective mix, you can book a consultation. In my experience the worksheet usually shows the budget is fine and the leak is between the phone and the schedule.
Ready to scale your revenue?
Book a free 30-min consultation. We’ll diagnose your growth bottleneck and map out the 3 highest-leverage moves for your business.
Frequently asked questions
How much should a dental office spend on marketing?
Plan on about 1.5% of collections to hold your patient base, 3% to grow and 5% or more for a new location or an elective service push. For reference, US dental offices reported advertising equal to 1.18% (sole proprietors) and 1.56% (corporations) of receipts on 2023 tax returns, per IRS Statistics of Income. Check any percentage against your cost per new patient before committing.
What is a good dental marketing budget percentage?
Agencies such as Studio 8E8 and Dental Intel recommend 2% to 3% to maintain, 3% to 5% for slow growth and 5% to 7% for fast growth in existing practices. Those are recommendations, not measured averages. IRS data shows dental offices actually report about 1.5% of receipts as advertising, which excludes websites, SEO fees and staff time, so a 3% total marketing budget is a reasonable growth tier.
How much does it cost to get a new dental patient?
It depends on the service. Delmain's 2026 Google Search benchmark shows $50.60 per lead for general dentist campaigns, $107.63 for implants, $119.62 for cosmetic and $212.63 for Invisalign. Divide cost per lead by your booking rate to get cost per patient: at a 40% booking rate a general patient costs $126.50. LocaliQ's 2026 benchmark puts the average dentist lead at $72.97.
What should a new dental practice budget for marketing?
A de novo office has no collections, so base the budget on its year-one revenue goal. Dental Intel suggests 10% for slow growth, 18% for moderate growth and 25% for fast growth in competitive markets. On a $600,000 goal, 10% is $60,000. Track booked new patients monthly and lower the percentage once your real cost per patient is known.
Should cosmetic, implant and orthodontic practices spend more on marketing?
Usually yes, because each case is worth more. Using national average fees from the Synchrony CareCredit cost study, six veneers average $10,590 and a single implant $2,695, versus $887 a year for a typical dental patient (AHRQ MEPS 2021). Higher case values let elective campaigns survive lower booking rates, so 3% to 5% or more of collections can still pay back.
What is the 70/20/10 rule for a marketing budget?
It is a general planning heuristic: put about 70% of the budget into proven channels, 20% into channels you are scaling and 10% into tests. It is not a dental benchmark. For a dental office, proven usually means Google Search and Google Business Profile, scaling might be an implant or aligner campaign, and tests could be a new social or video channel.
Does the ADA recommend a marketing budget percentage?
No. The ADA's Create Your Marketing Plan guide does not give a percentage. It does say an in-house marketer, usually the office manager, should expect to spend about 25% of their time, around 10 hours a week, on marketing, which is a real cost to include. The ADA Survey of Dental Practice reports total expenses but does not break out marketing.
Marketing budget research