

The typical US public company spends 1.54% of revenue on advertising. That is the median advertising to sales ratio across 1,278 companies that reported both advertising expense and revenue to the SEC for fiscal 2025. Small businesses sit in the same range: sole proprietors put 1.18% of business receipts into advertising and corporations 1.20%, according to the latest IRS tax return statistics (tax year 2023). We computed every number on this page ourselves from those two government sources, and the industry tables below show where your business falls.
Short answer: Advertising as a percentage of revenue runs from under 0.5% (industrial manufacturing, construction, engineering) to 3% to 8% (education, consumer finance, e-commerce, apparel). The median US public company spent 1.54% of revenue on advertising in 2025, and half of all companies fell between 0.50% and 4.49%. Among professional practices, real estate agents (3.38%), insurance agencies (2.95%) and incorporated law firms (2.79%) spend the largest share; physicians (0.46% to 0.79%) and investment advisers (0.43%) spend the least.
Most pages that rank for this question either sell the data behind a paywall, quote a 2017 table, or repeat survey averages from a few hundred marketing executives. This report is different in three ways. It is computed from filings, not surveys. It reports medians and ranges, not just averages that a few giant advertisers distort. And it covers small firms, using the advertising line that 31 million sole proprietors and 7 million corporations entered on their tax returns.
Key findings
- The median public company spends 1.54% of revenue on advertising. Across 1,278 SEC filers with fiscal 2025 data, the middle half ranged from 0.50% to 4.49%, and the top 10% spent more than 11.44%.
- The average is misleading. The simple mean ratio is 4.34%, 2.8 times the median, because a few heavy spenders pull it up. Use the median for planning.
- In dollar terms, those 1,278 companies booked $229.9 billion of advertising on $8.75 trillion of revenue, an aggregate ratio of 2.63%.
- Small businesses spend about the same share. Sole proprietors reported $24.3 billion of advertising on $2.06 trillion of receipts in 2023 (1.18%). Corporations reported $487.2 billion on $40.5 trillion (1.20%).
- Company size barely moves the median. Public companies under $100 million in revenue had a median of 1.76%; companies above $10 billion had 1.44%.
- Ad budgets grew with sales, not faster. For 1,254 companies in both years, median advertising spend rose 4.4% from 2024 to 2025, yet the median ratio was flat (1.55% to 1.54%). In aggregate, ad spend rose 7.2% while revenue rose 6.3%.
- 57.2% of companies raised ad spend in 2025, but only 49.4% raised it faster than revenue.
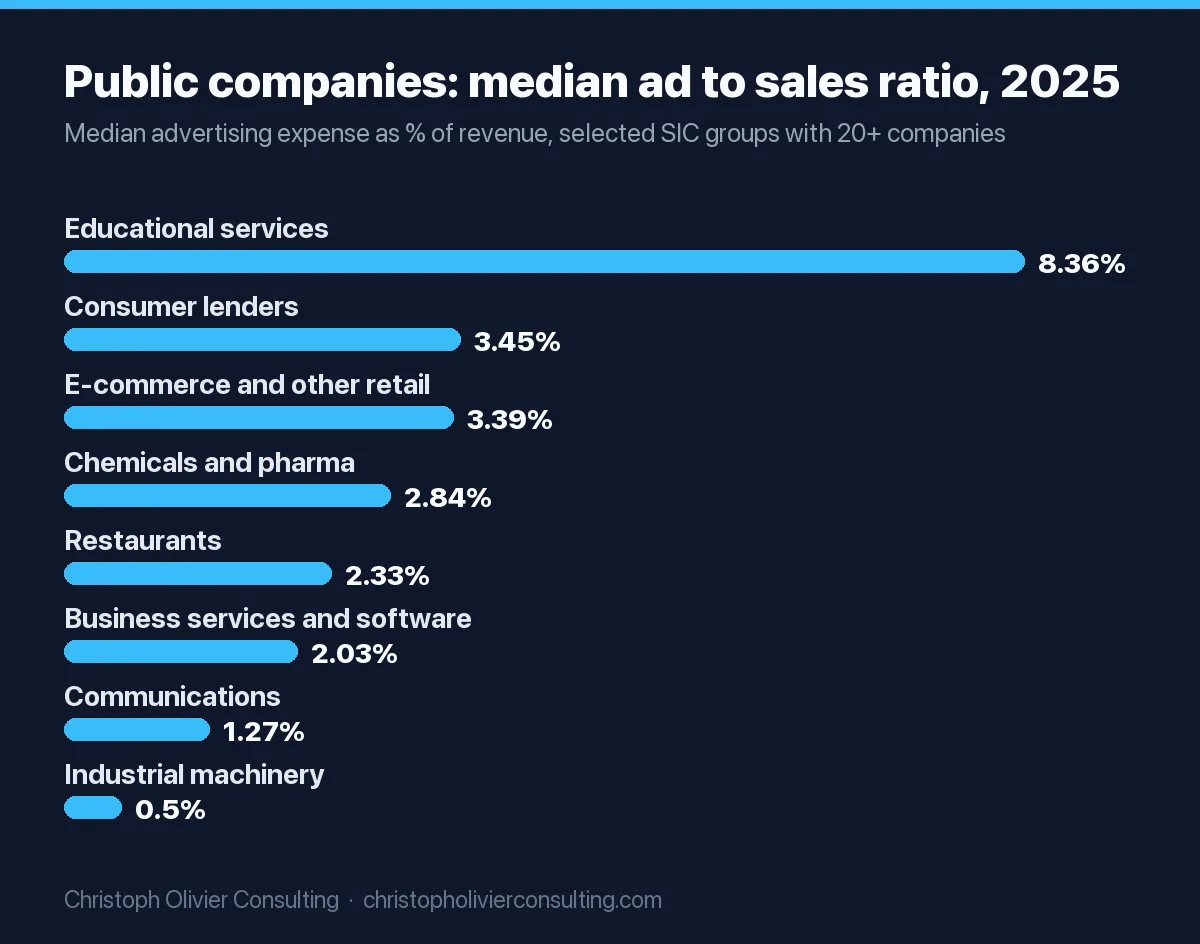
- Education is the most ad-intensive public industry with a median of 8.36% (22 companies), followed by banks (6.48%, see the caveat below), miscellaneous manufacturing (4.12%) and apparel stores (3.66%).
- Industrial sellers spend the least. Industrial machinery (0.50%), fabricated metal (0.51%), electronic equipment (0.54%) and building contractors (0.62%) sit at the bottom.
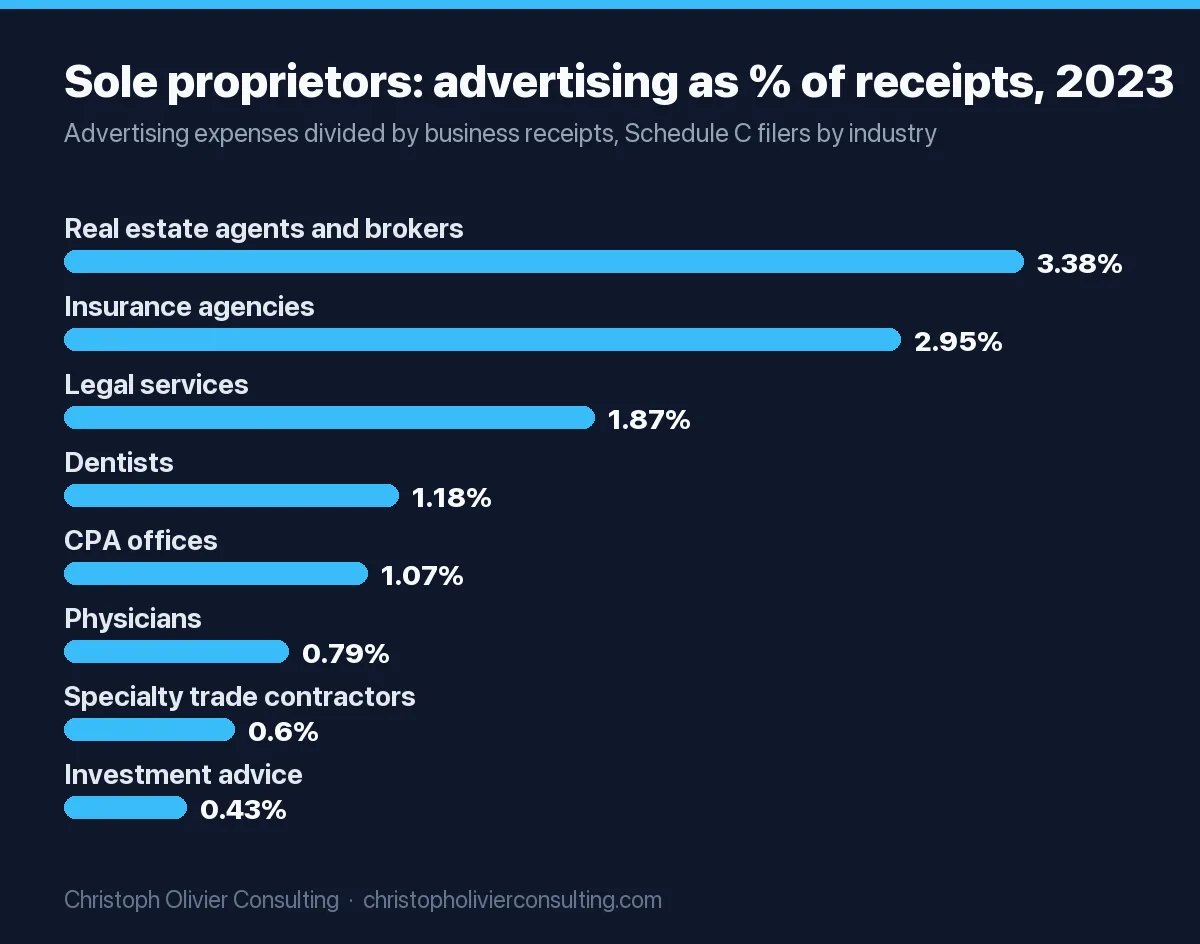
- Real estate agents are the biggest advertisers among professional practices: 3.38% of receipts for sole proprietors, 2.81% for incorporated brokerages.
- Incorporated law firms spend 1.5 times the share of solo lawyers: 2.79% of receipts versus 1.87%. Per return, that is $33,819 versus $2,560.
- Plumbing, heating and air-conditioning contractors spend 2.2 times the share of electrical contractors (0.80% versus 0.36% of receipts, corporations, 2023).
- Dentists outspend physicians. Solo dentists put 1.18% of receipts into advertising ($3,776 per return); solo physicians 0.79% ($1,218).
- Business model beats industry label. Inside the same SIC code for insurance agents, lead-generation marketplaces such as eHealth (27.71%) and GoHealth (28.99%) spend 80 times the share of franchise agency Goosehead (0.36%).
Advertising to sales ratio by industry: public companies, 2025
This is the master table for public companies. Each row is an SEC Standard Industrial Classification (SIC) major group with at least 10 companies in our cleaned 2025 sample. “Median” is the middle company. “Middle 50%” is the 25th to 75th percentile range. “Aggregate” is total advertising divided by total revenue for the group, which large companies dominate. The last column shows the median change in advertising dollars for companies that reported in both 2024 and 2025.
| Industry (SIC major group) | Companies | Median ad to sales | Middle 50% | Aggregate | Median ad spend change, 2024 to 2025 |
|---|---|---|---|---|---|
| Educational services (82) | 22 | 8.36% | 2.29% to 13.26% | 9.45% | +8.0% |
| Depository institutions, banks (60) | 28 | 6.48% | 1.17% to 12.25% | 2.13% | +6.2% |
| Miscellaneous manufacturing (39) | 11 | 4.12% | 2.64% to 7.10% | 5.96% | minus 11.9% |
| Apparel and accessory stores (56) | 14 | 3.66% | 1.04% to 5.15% | 1.95% | +6.5% |
| Nondepository credit, consumer lenders (61) | 30 | 3.45% | 0.31% to 10.21% | 7.52% | +23.4% |
| Miscellaneous retail, incl. e-commerce (59) | 44 | 3.39% | 0.92% to 7.49% | 2.41% | +5.3% |
| Furniture and fixtures (25) | 12 | 2.98% | 1.70% to 7.54% | 6.86% | minus 7.1% |
| Chemicals, incl. pharma and personal care (28) | 107 | 2.84% | 1.11% to 6.47% | 4.96% | +7.1% |
| Printing and publishing (27) | 10 | 2.72% | 1.31% to 5.69% | 5.50% | minus 2.4% |
| Restaurants, eating and drinking places (58) | 27 | 2.33% | 1.23% to 3.21% | 5.08% | +5.4% |
| Food and beverage manufacturing (20) | 42 | 2.13% | 0.80% to 4.30% | 4.86% | minus 0.5% |
| Hotels and lodging (70) | 17 | 2.06% | 0.68% to 3.82% | 2.33% | +2.6% |
| Engineering, accounting, research, management services (87) | 13 | 2.06% | 0.32% to 7.28% | 1.59% | 0.0% |
| Business services, incl. software (73) | 288 | 2.03% | 0.71% to 5.24% | 3.56% | +7.1% |
| Amusement and recreation, incl. betting (79) | 26 | 1.72% | 0.80% to 3.90% | 7.14% | minus 0.4% |
| Holding and investment offices, incl. REITs (67) | 26 | 1.66% | 1.09% to 2.59% | 1.63% | +8.3% |
| Communications, telecom and media (48) | 44 | 1.27% | 0.49% to 3.19% | 3.20% | +1.1% |
| Health services (80) | 23 | 1.11% | 0.40% to 3.25% | 2.41% | +11.3% |
| Real estate (65) | 17 | 1.08% | 0.38% to 1.34% | 0.81% | +0.5% |
| Air transportation (45) | 12 | 0.91% | 0.59% to 1.21% | 0.67% | minus 3.9% |
| Medical, optical and measuring instruments (38) | 88 | 0.89% | 0.41% to 3.25% | 2.10% | +0.1% |
| Transportation equipment, incl. autos (37) | 21 | 0.81% | 0.28% to 1.65% | 1.42% | minus 1.6% |
| General merchandise stores (53) | 10 | 0.71% | 0.41% to 1.56% | 0.87% | +8.6% |
| Auto dealers and gas stations (55) | 17 | 0.68% | 0.42% to 1.14% | 0.81% | +4.9% |
| Building construction, general contractors (15) | 13 | 0.62% | 0.32% to 0.77% | 0.50% | +22.6% |
| Electronic and electrical equipment (36) | 69 | 0.54% | 0.18% to 2.15% | 1.48% | minus 1.7% |
| Insurance carriers (63) | 11 | 0.53% | 0.20% to 2.83% | 4.65% | +30.0% |
| Fabricated metal products (34) | 16 | 0.51% | 0.28% to 0.98% | 0.56% | minus 1.5% |
| Industrial machinery and computer equipment (35) | 55 | 0.50% | 0.31% to 1.14% | 0.71% | +2.2% |
| Wholesale trade, durable goods (50) | 17 | 0.43% | 0.22% to 2.06% | 1.58% | +7.3% |
| All 1,278 companies | 1,278 | 1.54% | 0.50% to 4.49% | 2.63% | +4.4% |
Source: our calculation from SEC XBRL frames for AdvertisingExpense and revenue tags, joined to SIC codes from EDGAR company submissions, pulled November 11, 2026. Year-over-year changes use only companies present in both years, so the counts differ slightly from the Companies column. The 30 rows cover 1,130 of the 1,278 companies; the other 148 sit in 30 smaller groups that are in the downloadable dataset.
When the median and the aggregate differ a lot, a few large companies are driving the total. Amusement and recreation is the clearest case: the median company spends 1.72%, but the group’s aggregate is 7.14% because Walt Disney ($6.5 billion of advertising, 6.88% of revenue) and sports betting operator DraftKings (18.58%) report very large advertising lines. Banks are the opposite caution: their median looks high because bank “revenue” in XBRL often excludes much of net interest income, which inflates the ratio. Treat the bank row as a rough indicator, not a budget target.
Advertising as a percentage of revenue for small businesses
Public companies are a small, unusual slice of the economy. For the other 38 million business tax returns, the best free source is the IRS Statistics of Income program, which tabulates the advertising deduction from tax returns. We divided the advertising line by business receipts for every industry in two files: the 2023 nonfarm sole proprietorship income statements (Schedule C filers) and Table 5.1 of the 2023 Corporation Complete Report (all active corporations, including S corporations). Tax year 2023 is the latest year the IRS has published.
| Sector (NAICS) | Sole proprietor returns | Sole proprietors: ad to receipts | Corporation returns | Corporations: ad to receipts |
|---|---|---|---|---|
| Information | 474,628 | 3.27% | 147,230 | 3.59% |
| Real estate and rental and leasing | 1,511,411 | 2.69% | 810,832 | 2.07% |
| Arts, entertainment, and recreation | 1,784,320 | 1.91% | 169,571 | 3.07% |
| Educational services | 862,502 | 1.76% | 69,735 | 4.32% |
| Professional, scientific, and technical services | 3,912,417 | 1.66% | 1,108,790 | 1.27% |
| Retail trade | 2,276,668 | 1.50% | 563,001 | 1.41% |
| Other services (repair, personal care) | 4,066,467 | 1.46% | 487,567 | 1.27% |
| Manufacturing | 417,440 | 1.30% | 237,193 | 1.20% |
| Accommodation and food services | 738,481 | 1.27% | 350,789 | 1.86% |
| Finance and insurance | 708,558 | 1.25% | 314,045 | 1.15% |
| Administrative, support, and waste services | 3,159,026 | 1.22% | 315,513 | 1.20% |
| Health care and social assistance | 2,468,353 | 1.02% | 590,312 | 0.69% |
| Wholesale trade | 457,822 | 0.94% | 376,526 | 0.75% |
| Utilities | 31,174 | 0.57% | 7,856 | 0.20% |
| Agriculture, forestry, fishing, and hunting | 356,476 | 0.55% | 143,958 | 0.32% |
| Construction | 3,368,860 | 0.51% | 844,438 | 0.36% |
| Transportation and warehousing | 3,922,574 | 0.34% | 384,067 | 0.60% |
| Mining | 86,848 | 0.19% | 30,939 | 0.06% |
| All industries | 31,125,909 | 1.18% | 7,031,498 | 1.20% |
Source: our calculation from IRS SOI, Sole Proprietorship Returns 2023 (Table 2, released March 2026) and Corporation Income Tax Returns 2023 (Table 5.1, September 2026). Ratios are advertising divided by business receipts, both in thousands of dollars as published. The corporation file also has a “management of companies” sector at 7.41%, which we left out of this table because it is almost entirely bank holding companies, whose business receipts exclude most interest income.
IRS ratios are aggregates: total advertising in the industry divided by total receipts. Larger firms carry more weight, the same way they do in the “Aggregate” column of the public table. The IRS does not publish medians.
Marketing budget as a percentage of revenue for professional services and trades
This site works with professional practices and owner-led service firms, so we pulled the exact IRS lines for those businesses. The table shows the advertising share of receipts for solo owners and for incorporated firms, the average advertising dollars per return, and public companies in the same field where any exist.
| Vertical | Sole proprietors: ad to receipts (ad $ per return) | Corporations: ad to receipts (ad $ per return) | Public company reference, 2025 |
|---|---|---|---|
| Real estate agents and brokers | 3.38% ($2,143); 1,046,471 returns | 2.81% ($14,525); 197,198 returns | SIC 6531, 6 companies, median 1.19% (Compass 1.12%, Douglas Elliman 2.34%) |
| Insurance agencies and brokerages | 2.95% ($3,121); 313,543 returns | 2.09% ($32,969); 108,701 returns | SIC 6411, 9 companies, median 1.87%; range from Goosehead 0.36% to GoHealth 28.99% |
| Legal services (law firms) | 1.87% ($2,560); 316,370 returns | 2.79% ($33,819); 139,111 returns | No law firms are public; LegalZoom (SIC 7374) reported 23.23% |
| Accounting: CPA offices | 1.07% ($1,577); 28,476 returns | 1.18% ($13,489) for accounting, tax prep, bookkeeping and payroll; 101,967 returns | Too few filers to report |
| Accounting: bookkeeping and tax prep (non-CPA) | 1.79% ($628); 333,080 returns | ||
| Dentists | 1.18% ($3,776); 56,157 returns | 1.56% ($19,859); 101,508 returns | Too few filers to report |
| Physicians (except mental health) | 0.79% ($1,218); 181,294 returns | 0.46% ($10,985); 161,894 returns | Teladoc 21.57%, AirSculpt 17.98% (consumer models, not clinics) |
| Chiropractors | 2.69% ($4,464); 21,935 returns | in “other health practitioners”: 0.57% | None |
| Investment advice and securities | 0.43% ($1,538); 183,173 returns | 1.35% ($45,127); 68,492 returns | SIC 6282, 4 companies, median 3.84% (Morningstar 1.69%) |
| Plumbing, heating and air-conditioning (HVAC) | Specialty trade contractors combined: 0.60% ($609); 2,521,516 returns | 0.80% ($23,447); 86,269 returns | TopBuild (SIC 1700) 0.06% |
| Electrical contractors | 0.36% ($11,475); 71,248 returns | ||
| Management consulting | 1.62% ($979); 1,109,907 returns | 0.73% ($11,619); 295,320 returns | See SIC 87 in the master table |
Source: IRS SOI 2023 sole proprietorship Table 2 and corporation Table 5.1; public company ratios from SEC XBRL, fiscal 2025. Dollar figures per return are advertising divided by number of returns, so they are averages that include firms that spent nothing.
Three patterns stand out. First, incorporated law firms spend a larger share than solo lawyers, while in real estate and insurance the solo agent spends the larger share. Second, HVAC and plumbing companies are the heaviest advertisers among the trades, which fits a business where an urgent repair call is won by whoever the homeowner finds first. Third, the public company “reference” is often a different business model wearing the same label: online insurance marketplaces and telehealth brands buy customers through ads, so their ratios say little about an agency or a medical practice. If you run one of these firms, our vertical guides go deeper on how much accounting firms should spend on marketing, HVAC marketing budgets, financial advisor marketing budgets and what estate planning attorneys spend.
Small firms versus public companies in the same industry
Put the two datasets side by side and the overall picture is surprisingly flat: 1.18% for sole proprietors, 1.20% for corporations, 1.54% for the median public company. Within public companies, size changes little either.
| Public companies by annual revenue (2025) | Companies | Median ad to sales | Middle 50% | Aggregate |
|---|---|---|---|---|
| Under $100 million | 296 | 1.76% | 0.40% to 4.94% | 3.63% |
| $100 million to $1 billion | 408 | 1.50% | 0.54% to 4.94% | 5.25% |
| $1 billion to $10 billion | 439 | 1.50% | 0.50% to 4.37% | 3.56% |
| $10 billion and up | 135 | 1.44% | 0.62% to 4.08% | 2.37% |
The gap between industries is far larger than the gap between big and small companies. A software company and a machinery maker of the same size differ by about 4 times at the median (2.03% versus 0.50%). A company with $50 million in revenue and one with $50 billion differ by a fraction of a point. So when you benchmark, match the industry first and the size second.
Where both datasets cover a comparable industry, small firms are not consistently lower. Information businesses run 3.27% (sole proprietors) and 3.59% (corporations). Restaurants run 1.27% and 1.86% at the small end and 2.33% for the median public chain. Construction is low everywhere: 0.51% for sole proprietors, 0.36% for corporations, 0.62% for public general contractors.
How much do companies spend on advertising in dollars?
The 10 largest advertising lines in our 2025 sample belong to familiar names. These are the advertising expense amounts each company tagged in its annual report, as returned by the SEC frames API. For a fuller treatment of brand budgets and how they are reported, see our breakdown of big brand marketing budgets.
| Company | Fiscal year end | Advertising expense | Revenue | Ad to sales |
|---|---|---|---|---|
| Amazon | Dec 2025 | $23.5 billion | $716.9 billion | 3.28% |
| PDD Holdings | Dec 2025 | $10.7 billion | $61.8 billion | 17.35% |
| Procter & Gamble | Jun 2025 | $9.2 billion | $84.3 billion | 10.92% |
| Walt Disney | Sep 2025 | $6.5 billion | $94.4 billion | 6.88% |
| Coca-Cola | Dec 2025 | $5.4 billion | $47.9 billion | 11.26% |
| Walmart | Jan 2026 | $5.4 billion | $713.2 billion | 0.76% |
| Progressive | Dec 2025 | $5.1 billion | $87.7 billion | 5.86% |
| Expedia Group | Dec 2025 | $3.9 billion | $14.7 billion | 26.47% |
| Verizon | Dec 2025 | $3.8 billion | $138.2 billion | 2.77% |
| T-Mobile US | Dec 2025 | $3.7 billion | $88.3 billion | 4.19% |
Source: SEC XBRL frames, AdvertisingExpense and revenue tags, CY2025 frame, pulled November 11, 2026. Not every large advertiser tags this line (see limitations), so this is a list of the largest disclosed amounts, not a ranking of all US advertisers. Foreign filers such as PDD Holdings report in other currencies; the values shown are the USD-denominated facts in their filings.
Ad spend versus marketing budget: what this ratio does and does not include
An advertising to sales ratio is not your whole marketing budget. The SEC tag AdvertisingExpense is defined in the US GAAP taxonomy as the “amount charged to advertising expense for the period.” The IRS corporate line, per the Publication 16 explanation of terms, includes advertising reported as a deduction, advertising inside cost of goods sold, and combined lines such as “advertising and promotion.” In both datasets, salaries of marketing staff sit elsewhere (the IRS tables carry them under salaries and wages).
Some companies tag a broader concept instead, MarketingAndAdvertisingExpense (“promotion, public relations, and brand or product advertising”). We ran that tag too: 328 companies, median 3.78% of revenue, middle half 1.26% to 9.87%. For the 44 companies in our cleaned samples that report both tags, the median advertising ratio was 5.44% and the median marketing and advertising ratio was 7.36%. Survey-based totals, which add people and tools, run higher again; our roundup of CMO marketing budget statistics covers those surveys.
How to use these benchmarks to set your budget
The method that works with this data has four steps. It is a starting point, and our guide on how to set a marketing budget covers the other methods you can check it against.
- Pick the closest row. Use the IRS row for your entity type if you are a small or mid-size firm, and the public table if you sell nationally.
- Choose a position. If you want to hold share, start near the median. If you are entering a market or growing faster than peers, plan from the 75th percentile of the public range for your industry.
- Multiply by next year’s revenue target, not last year’s revenue.
- Add the non-advertising costs separately: people, agency fees, software, content. The ratio covers media and ad production only.
Worked example 1: an HVAC and plumbing company with $3 million in revenue, organized as a corporation. The IRS corporate ratio for plumbing, heating and air-conditioning contractors is 0.80%. $3,000,000 x 0.802% = $24,060 a year in advertising, about $2,005 a month. As a check, the average corporate return in that industry reported $2.92 million of receipts and $23,447 of advertising, so the result lines up with what similar firms actually deducted.
Worked example 2: a law firm with $2 million in revenue. At the corporate legal services ratio of 2.79%, $2,000,000 x 2.793% = $55,860. At the solo practitioner ratio of 1.87%, the same revenue gives $37,460. The difference is real: incorporated firms in the 2023 data spent about 1.5 times the share of solo lawyers. A firm trying to grow into the incorporated peer group should plan from the higher number.
| Copy-ready formula | What to enter |
|---|---|
| Ad to sales ratio | Advertising expense / Revenue x 100 |
| Benchmark ad budget | Target revenue x Benchmark ratio (from the tables above) |
| Monthly ad budget | Benchmark ad budget / 12 |
| Gap to peers | Your ratio minus Benchmark ratio (in percentage points) |
If the numbers suggest your spend is far from peers and you want a second opinion on where the money should go, you can book a consultation.
Methodology
Public companies. We downloaded the SEC XBRL frames for us-gaap/AdvertisingExpense in USD for CY2024 (1,636 facts) and CY2025 (1,462 facts), and for MarketingAndAdvertisingExpense CY2025 (459 facts). The frames API returns one fact per filer that “most closely fits the calendrical period requested,” with annual periods of 365 days plus or minus 30, according to the SEC EDGAR API documentation. So CY2025 includes fiscal years ending from mid 2025 to early 2026. For revenue we pulled the same frames for Revenues, RevenueFromContractWithCustomerExcludingAssessedTax and RevenueFromContractWithCustomerIncludingAssessedTax. The older SalesRevenueNet tag has no CY2024 or CY2025 frame (the API returned 404), so it adds nothing for these years. For each company we kept revenue facts with exactly the same start and end dates as the advertising fact and used the largest of them as total revenue. SIC codes come from each company’s EDGAR submissions record.
Filters. From the 1,352 CY2025 companies with matching revenue we dropped: revenue under $1 million (49), zero advertising (17), ratio above 100% (4), periods outside 340 to 380 days (2), and 2 companies whose figures showed obvious scale errors (a small solar electronics maker tagged $103.5 billion of revenue; a small pharma issuer tagged advertising and revenue in billions). That leaves 1,278 companies in 60 SIC major groups and 268 four-digit SIC codes. For CY2024: 1,512 matched, 1,416 kept. The year-over-year panel is the 1,254 companies kept in both years. Medians, 25th and 75th percentiles (linear interpolation) and aggregates are computed per group.
Small businesses. IRS SOI Table 2, Nonfarm Sole Proprietorships, Tax Year 2023: row “Advertising expenses” divided by row “Business receipts, total,” for every industry column. IRS SOI Table 5.1, Returns of Active Corporations, Tax Year 2023: row “Advertising” divided by row “Business receipts,” for every sector and minor industry column. Two corporate cells (pulp and paper mills, converted paper products) are suppressed by the IRS (“d”) and excluded. All files were downloaded on November 11, 2026.
Download the data (free, CSV): public_companies_ad_to_sales_CY2024_CY2025.csv · public_industry_summary_CY2025.csv · irs_2023_advertising_by_industry.csv. Free to reuse with attribution to CO Consulting and a link to this page.
The dataset. We publish three CSV files built from this work. Their fields:
| File | Fields |
|---|---|
| public_companies_ad_to_sales_CY2024_CY2025.csv (2,694 rows) | cik, name, tickers, exchanges, sic, sicDescription, sic2, fiscal_start, fiscal_end, advertising_expense_usd, revenue_usd, revenue_tag (which XBRL tag supplied revenue), ad_to_sales_pct, adv_accn and rev_accn (SEC accession numbers of the source filings), frame (CY2024 or CY2025) |
| public_industry_summary_CY2025.csv (60 rows) | frame, sic2, industry, companies, median_pct, p25_pct, p75_pct, aggregate_pct, sum_adv_usd, sum_rev_usd |
| irs_2023_advertising_by_industry.csv (360 rows) | source (sole proprietorships or corporations), level (0 total, 1 sector, 2 and 3 sub-industries), sector, industry, returns, business_receipts_k and advertising_k (thousands of dollars as published), ratio_pct, adv_per_return_usd, flag (IRS suppression) |
Limitations
- Disclosure bias. About 4,700 companies reported a revenue fact in the CY2025 frames, but only 1,462 tagged AdvertisingExpense. Companies that advertise little often do not disclose the line at all, so public medians lean toward advertisers. Some heavy advertisers tag a different concept (such as selling and marketing expense) and are missing.
- Definitions differ. The SEC line is advertising under accounting rules; the IRS line is advertising as deducted or capitalized for tax. Neither includes marketing salaries. The SEC and IRS also classify industries differently (SIC versus NAICS), so rows are comparable only roughly.
- Revenue for financial firms. For banks, insurers and holding companies, “revenue” and “business receipts” leave out much of interest and investment income, which pushes ratios up. Read those rows with care.
- Time lag. IRS figures are for tax year 2023, the latest published. Public company data is fiscal 2025.
- Aggregates versus medians. IRS ratios are industry totals, which weight larger firms more, while our headline public numbers are medians. Compare IRS figures to the “Aggregate” column when you want like for like.
- Small cells. Groups with fewer than 10 public companies are not in the main table, and four-digit vertical figures with 4 to 9 companies are indicative only.
- XBRL errors. Filers sometimes tag values with the wrong scale. We removed the obvious cases and any ratio above 100%, but smaller errors can remain; medians barely move because of them, aggregates can.
Most quotable numbers
- “The median US public company spent 1.54% of revenue on advertising in fiscal 2025, based on 1,278 SEC filers.”
- “Half of public companies spend between 0.50% and 4.49% of revenue on advertising; the average, 4.34%, is pulled up by a few heavy spenders.”
- “US sole proprietors spent $24.3 billion on advertising in 2023, 1.18% of their receipts; US corporations spent $487.2 billion, 1.20%.”
- “Real estate agents spend 3.38% of receipts on advertising, the most of any professional practice in IRS data.”
- “Incorporated law firms spend 2.79% of receipts on advertising, about 1.5 times the share of solo lawyers (1.87%).”
- “From 2024 to 2025, median public company ad spend rose 4.4%, but the median ad to sales ratio did not move.”
Cite this report
Olivier, Christoph. “Advertising to Sales Ratio by Industry: 2025 SEC and 2023 IRS Data.” CO Consulting, November 2026. https://christopholivierconsulting.com/advertising-to-sales-ratio-by-industry/. Computed from SEC XBRL frames (AdvertisingExpense, revenue tags; CY2024 and CY2025) and IRS Statistics of Income tables for tax year 2023.
Ready to scale your revenue?
Book a free 30-min consultation. We’ll diagnose your growth bottleneck and map out the 3 highest-leverage moves for your business.
Frequently asked questions
What is a good advertising to sales ratio?
There is no single good ratio; it depends on industry. Across 1,278 US public companies in fiscal 2025 the median was 1.54% of revenue, and half spent between 0.50% and 4.49%. Industrial manufacturers sit near 0.5%, while education, consumer lending and e-commerce run 3% to 8%. Compare yourself with the median and the middle range for your own industry, not with an all-industry average.
What percentage of revenue should a small business spend on advertising?
IRS data for tax year 2023 shows US sole proprietors spent 1.18% of business receipts on advertising and corporations 1.20%. The share ranges from about 0.2% in mining and 0.5% in construction to 3% or more in information businesses and real estate. Use the row for your industry and entity type, then adjust up if you plan to grow faster than peers.
How do you calculate the advertising to sales ratio?
Divide advertising expense by revenue for the same period and multiply by 100. A company with $150,000 of advertising and $5 million of revenue has a ratio of 3%. Use the advertising line only (media and ad production), not marketing salaries or software, if you want to compare with SEC or IRS benchmarks, because both sources record staff costs elsewhere.
Is a marketing budget the same as advertising spend?
No. Advertising is one part of marketing. Among 44 public companies that report both figures, the median advertising ratio was 5.44% of revenue and the median marketing and advertising ratio was 7.36%. A full marketing budget also covers people, agencies, content and tools, so it will be higher than the advertising benchmarks on this page.
How much do law firms spend on advertising as a percentage of revenue?
In IRS data for 2023, incorporated law firms deducted 2.79% of business receipts as advertising, an average of $33,819 per return. Solo lawyers filing Schedule C spent 1.87%, or $2,560 per return. On $2 million of revenue, the corporate ratio implies about $55,860 a year of advertising.
Which industries spend the most on advertising as a percentage of sales?
Among US public companies in fiscal 2025, educational services had the highest median at 8.36%, followed by banks (6.48%, inflated by how bank revenue is tagged), miscellaneous manufacturing (4.12%), apparel stores (3.66%), consumer lenders (3.45%) and e-commerce and other retail (3.39%). Among small professional practices, real estate agents lead at 3.38% of receipts.