

Construction companies spend far less on advertising than the “5 to 10 percent of revenue” rule you see quoted everywhere. On their 2023 tax returns, US construction corporations deducted 0.36% of business receipts for advertising, and public homebuilders reported a median of 0.65% of revenue in fiscal 2025. Build your construction marketing budget from your cost per signed job, not from a percentage: in the three worked examples below, that math lands at 0.9% to 1.5% of revenue for media, tools and fees, with sales and estimating salaries on a separate line.
Short answer: Measured advertising in construction runs from 0.09% to about 1% of revenue: 0.25% for building contractors, 0.80% for plumbing and HVAC contractors (IRS, tax year 2023), and 0.8% of a new home’s sale price for builders (NAHB, 2024). Residential contractors who buy leads should budget from the job: a $2.7M remodeler that wins 34 jobs a year through Google ads and lead services at $727 to $993 per signed job needs about $30,000 a year in media and fees, roughly 1.1% of revenue. Commercial contractors spend mostly on estimating and business development time.
Below: every construction benchmark I could trace to a primary source, the 10-K advertising lines of 18 public builders and contractors, channel math that turns a lead price into a cost per signed job, and a budget calculator worked through for a remodeler, a roofer and a commercial general contractor.
Construction company marketing budget percentage: what the primary data says
Most pages ranking for this question quote 2 to 3%, 4.8 to 10.8%, 5 to 10% or 7 to 10% of revenue, usually with no source. Here is what the sources that actually measure construction spending report. Read the “what it measures” column carefully, because the gap between these numbers and the agency rules of thumb is mostly a difference in what counts as marketing.
| Source and year | What it measures | Figure |
|---|---|---|
| IRS Statistics of Income, corporations, tax year 2023 (Table 5.1) | Advertising deducted on corporate returns divided by business receipts, all construction | 0.36% |
| IRS Statistics of Income, sole proprietors, tax year 2023 (Table 2) | Schedule C advertising expense divided by business receipts, all construction | 0.51% |
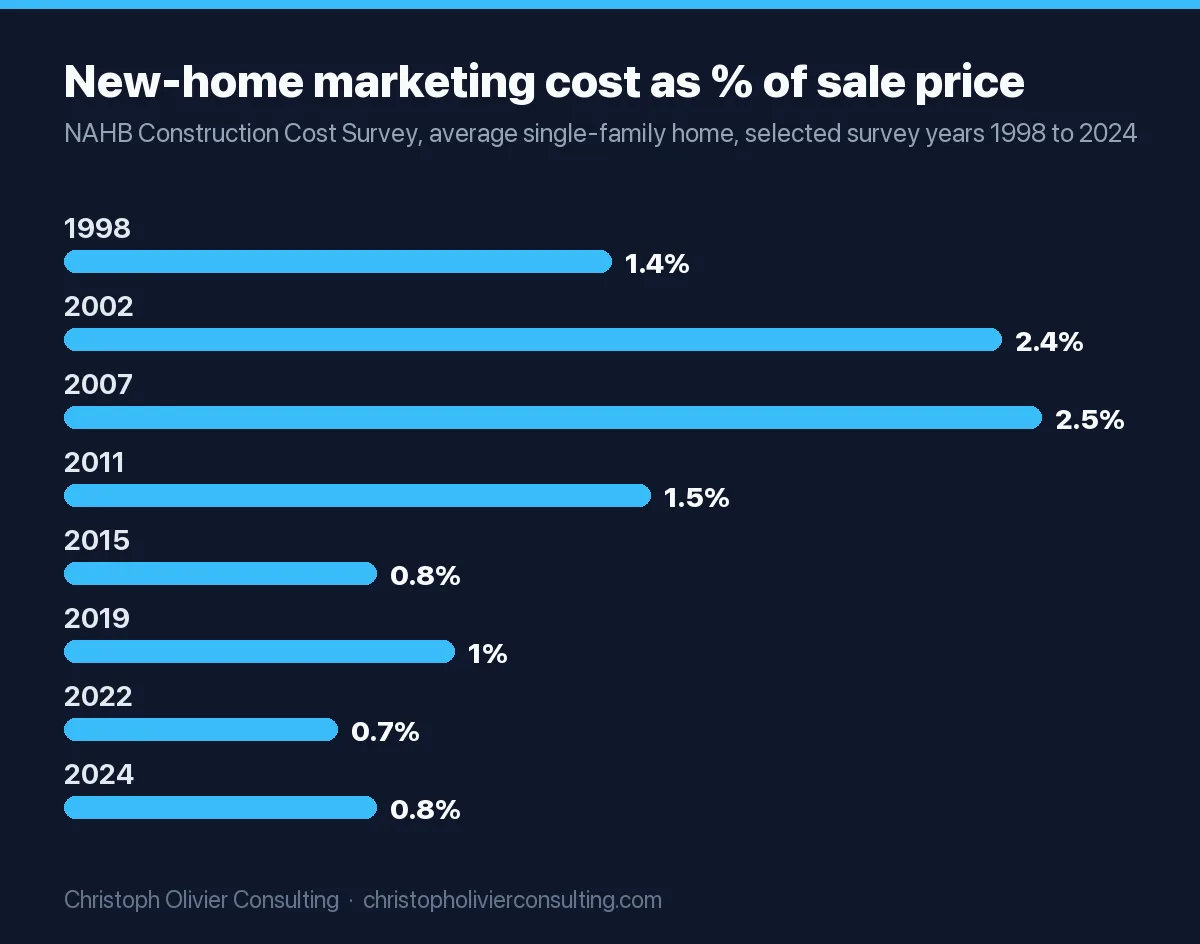
| NAHB Cost of Constructing a Home, 2024 (41 builders) | Marketing cost as a share of the average new single-family home sale price ($5,633 of $665,298); sales commission is a separate 2.8% | 0.8% |
| SEC 10-K filings, fiscal 2025 (table below) | Advertising expense tagged by 10 public homebuilders, divided by total revenue | 0.19% to 0.97%, median 0.65% |
| SEC 10-K filings, fiscal 2025 (table below) | Advertising expense of 5 public specialty and infrastructure contractors, divided by revenue | 0.04% to 0.20% |
| Hinge 2026 High Growth Study, AEC edition (110 architecture, engineering and construction firms) | Median marketing budget as a share of revenue; the summary does not say whether staff pay is included | 5% (average-growth firms), 10% (high-growth firms) |
| SBA.gov community blog, 2013 | A rule of thumb for small businesses under $5M in revenue, not a measurement | 7 to 8%, if net margins are 10 to 12% |
Two things explain the spread. First, the IRS and SEC lines count advertising only: ad spend, directories, print, sponsorships. They leave out salespeople, estimators, sales commissions, design time on proposals and most software. Second, Hinge measures total marketing budgets across architecture, engineering and construction firms together, and its summary does not define what the budget includes. A residential contractor buying leads and a heavy civil contractor bidding public work are not running the same kind of budget, and the next sections split them apart.
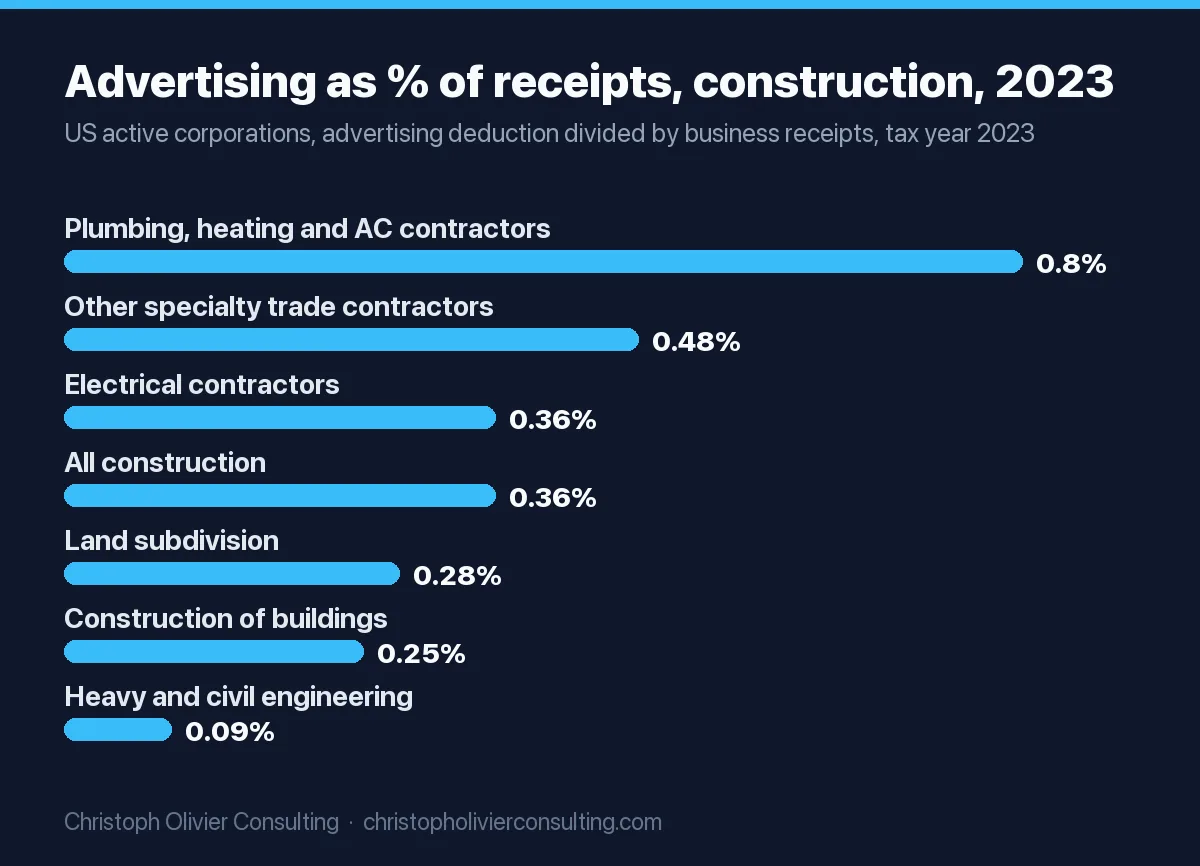
Advertising as a percentage of receipts, by type of construction company
The IRS corporate file breaks construction into six minor industries. I divided each industry’s advertising deduction by its business receipts. These are all US active corporations filing in tax year 2023, money in thousands of dollars in the source.
| Construction industry (IRS minor industry) | Corporate returns | Business receipts | Advertising | Advertising as % of receipts | Average receipts per return |
|---|---|---|---|---|---|
| Plumbing, heating and air-conditioning contractors | 86,269 | $252.1B | $2.02B | 0.80% | $2.92M |
| Other specialty trade contractors (roofing, framing, concrete, finishing and more) | 379,071 | $841.6B | $4.05B | 0.48% | $2.22M |
| Electrical contractors | 71,248 | $226.1B | $0.82B | 0.36% | $3.17M |
| Land subdivision | 13,671 | $22.7B | $0.06B | 0.28% | $1.66M |
| Construction of buildings (residential and commercial builders, general contractors) | 269,456 | $1,178.7B | $2.95B | 0.25% | $4.37M |
| Heavy and civil engineering construction | 24,723 | $352.1B | $0.32B | 0.09% | $14.24M |
| All construction | 844,438 | $2,873.4B | $10.23B | 0.36% | $3.40M |
Source: IRS SOI Table 5.1, tax year 2023. Ratios and per-return averages are my calculations from the file. Sole proprietors show the same order: specialty trades 0.60%, building construction 0.34%, heavy and civil 0.32% (IRS SOI sole proprietorship Table 2, 2023). For how construction compares with law firms, retailers and software companies, see our advertising to sales ratio by industry dataset.
The pattern is the residential versus commercial split in numbers. Plumbing and HVAC contractors sell to homeowners with emergencies and replacement decisions, so they advertise at more than three times the rate of building contractors and nearly nine times the rate of heavy civil firms, whose customers are public agencies and developers who issue bids.
What public homebuilders and contractors spend on advertising
Public companies disclose advertising expense in their 10-K notes and tag it in XBRL. These are the construction companies (SEC SIC codes 1520 to 1731) that tagged an advertising or marketing-and-advertising expense for fiscal 2025, pulled from the SEC XBRL frames API and each company’s own filing. Revenue is total revenue tagged in the same 10-K for the same period.
| Company (fiscal year end) | What it builds | Advertising, FY2025 | Change vs FY2024 | Revenue, FY2025 | Advertising as % of revenue |
|---|---|---|---|---|---|
| LGI Homes (Dec 2025) | Entry-level homes | $40.2M* | n/a | $1,705.5M | 2.36%* |
| Beazer Homes (Sep 2025) | Homes | $23.0M | +16% | $2,371.6M | 0.97% |
| Smith Douglas Homes (Dec 2025) | Entry-level homes | $9.3M | +37% | $971.1M | 0.96% |
| United Homes Group (Dec 2025) | Homes | $3.4M* | n/a | $406.7M | 0.84%* |
| Century Communities (Dec 2025) | Homes | $32.3M* | n/a | $4,117.8M | 0.78%* |
| Hovnanian (Oct 2025) | Homes | $22.8M | +33% | $2,978.6M | 0.77% |
| Toll Brothers (Oct 2025) | Luxury homes | $77.4M | +23% | $10,966.7M | 0.71% |
| KB Home (Nov 2025) | Homes | $42.0M | +5% | $6,236.2M | 0.67% |
| Lennar (Nov 2025) | Homes | $210.8M | +10% | $34,186.9M | 0.62% |
| Taylor Morrison (Dec 2025) | Homes | $40.7M | +20% | $8,121.5M | 0.50% |
| PulteGroup (Dec 2025) | Homes | $81.6M | +9% | $17,312.0M | 0.47% |
| D.R. Horton (Sep 2025) | Homes | $108.2M | +50% | $34,250.4M | 0.32% |
| Installed Building Products (Dec 2025) | Insulation and building product installation | $5.8M | minus 3% | $2,970.8M | 0.20% |
| Green Brick Partners (Dec 2025) | Homes | $3.8M | +23% | $2,040.0M | 0.19% |
| Energy Services of America (Sep 2025) | Utility and pipeline contracting | $0.29M | +5% | $411.0M | 0.07% |
| TopBuild (Dec 2025) | Insulation installation and distribution | $3.4M | +127% | $5,409.1M | 0.06% |
| MYR Group (Dec 2025) | Electrical transmission and commercial electrical | $1.9M | minus 5% | $3,657.9M | 0.05% |
| Everus Construction Group (Dec 2025) | Electrical, mechanical and transmission contracting | $1.5M | +36% | $3,746.4M | 0.04% |
*Tagged as “marketing and advertising expense,” a broader line than advertising alone, so not strictly comparable. Meritage Homes tagged $17.5M of advertising for 2025 but no matching undimensioned revenue figure in XBRL, so I left it out of the ratio. Ratios and year-over-year changes are my calculations from the tagged values.
Three takeaways for a private contractor. Homebuilders cluster between 0.3% and 1% of revenue on advertising, the same zone as NAHB’s 0.8% marketing cost per home, and they pay sales commissions on top. Contractors that sell to builders, utilities and commercial owners spend under 0.2%, because their “marketing” is estimating, relationships and prequalification. And every one of the 11 homebuilders that tagged advertising in both years spent more in fiscal 2025 than in fiscal 2024. That is spending, not proof it worked. The market has softened since: the Census Bureau puts US construction spending for January to September 2026 at $1,649.6 billion, 2.9% below the same period of 2025.
The NAHB series shows how stable the residential number is over time. Marketing cost has stayed between 0.7% and 2.5% of the sale price in every survey since 1998, and at or below 1.2% in every survey since 2013.
Residential vs commercial construction: two different budgets
Decide which business you are in before you pick a number, because the money goes to different places.
| Residential (remodelers, home builders, roofing and home trades) | Commercial and public (GCs, heavy civil, commercial trades) | |
|---|---|---|
| Buyer | A homeowner deciding once every few years | An owner, developer, GC or public agency issuing bids or shortlists |
| What “marketing” buys | Leads: search ads, lead services, website, reviews, referrals | Invitations to bid: estimating capacity, plan room access, prequalification, relationships |
| Measured advertising share | 0.48% to 0.80% of receipts for specialty trades; 0.8% of sale price for builders | 0.09% for heavy civil (IRS); 0.04% to 0.07% for public electrical and utility contractors (SEC) |
| Biggest hidden cost | The salesperson or owner time spent running estimates | Estimator hours on bids you lose |
| Budget unit to track | Cost per signed job | Cost per win (bid cost divided by hit rate) |
Public work makes the point. Public construction ran at a seasonally adjusted annual rate of $546.8 billion in September 2026, per the same Census release, and much of it is awarded through formal procurement, where advertising does little. If that is your market, your “marketing budget” is mostly an estimating and business development budget. Our guide to hiring a construction marketing agency for commercial firms covers what that work looks like when you outsource part of it.
How much should a contractor spend on marketing? Work it backward from the job
A percentage of revenue tells you nothing about whether a channel pays. The job does. Use this five-step formula, then sanity-check the total against the benchmarks above.
- Jobs you need from marketing = revenue target divided by average job value, minus the jobs you expect from repeat customers and referrals (from your own job list for the last 12 months).
- Cost per signed job, by channel = cost per lead divided by (qualified rate × close rate). Pull the two rates from your CRM, not from a blog.
- Ceiling per job = average job value × net margin. NAHB’s average remodeler kept 6.3% net in fiscal 2024 (NAHB Remodelers’ Cost of Doing Business Study), so on a $40,000 job the whole profit is $2,520. A channel that costs more than that per signed job loses money on new customers.
- Media budget = jobs from each channel × that channel’s cost per signed job.
- Total budget = media + fixed costs (website, SEO, call tracking, CRM, plan rooms) + any agency fees. List sales and estimating salaries on a separate line so you can see them.
This is the same bottom-up method we lay out in how to set a marketing budget, adapted to contractor job economics.
Channel math: from cost per lead to cost per signed job
Lead prices below are published by the vendor or measured by the benchmark source. The qualified and close rates are assumptions I set for illustration, lower for shared leads because several contractors call the same homeowner. Swap in your own rates; the math is the point.
| Channel | Price input (source) | Qualified rate (assumed) | Close rate of qualified (assumed) | Cost per qualified lead | Cost per signed job | Share of job value |
|---|---|---|---|---|---|---|
| Google Search ads, residential | $90.92 median cost per lead, Home and Home Improvement, April 2025 to March 2026 (WordStream 2026 benchmarks) | 50% | 25% | $181.84 | $727.36 | 1.8% of a $40,000 remodel |
| Google Search ads, commercial trades | $75.19 median cost per lead, Industrial and Commercial (same report) | 50% | 25% | $150.38 | $601.52 | Depends on contract size |
| Networx pay-per-lead, Remodeling and Renovation | $70 to $86 per lead, midpoint $78 (Networx pricing) | 50% | 15% | $156.00 | $1,040.00 | 2.6% of $40,000 |
| Networx exclusive, Remodeling and Renovation | $134 to $164 per lead, midpoint $149 (Networx exclusive) | 60% | 25% | $248.33 | $993.33 | 2.5% of $40,000 |
| Networx pay-per-lead, Roof Installation (shingle and wood) | $60 to $90, midpoint $75 | 50% | 20% | $150.00 | $750.00 | 2.4% of a $31,871 roof |
| Networx exclusive, Roof Installation (shingle and wood) | $120 to $167, midpoint $143.50 | 60% | 25% | $239.17 | $956.67 | 3.0% of $31,871 |
| Website, local SEO and Google Business Profile management | $249 a month, $2,988 a year (Footbridge Media) | Fixed cost. It beats Google ads once it produces 4.1 signed jobs a year ($2,988 divided by $727.36) | n/a | |||
| Commercial plan room | ConstructConnect Professional, from $199 a month per market per seat billed annually, $2,388 a year (ConstructConnect pricing) | Fixed cost. One won contract usually covers it; the real cost is the estimating time per bid | n/a | |||
Job values come from the 2025 Cost vs Value Report: midrange minor kitchen remodel $28,458, basement remodel $52,012, asphalt shingle roof replacement $31,871, national averages. The $40,000 remodel is my assumed blend of those project types. For the per-channel detail on remodeling, see our general contractor cost per qualified lead breakdown and our roofing lead generation guide.
The useful comparison is the last column against your net margin. At NAHB’s 6.3%, a $40,000 remodel earns $2,520. Every channel above signs that job for $601 to $1,040 if your close rates match the assumptions. If your close rate on shared leads is 5% instead of 15%, the Networx shared cost per job triples to $3,120 and the channel loses money on every job.
Construction marketing budget calculator: three worked examples
Each profile uses a published revenue and margin reference where one exists, and labeled assumptions where none does. Copy the structure and replace every input with your own.
Profile 1: residential remodeler, $2.7M revenue
Revenue and the 6.3% net margin are NAHB’s fiscal 2024 averages for remodelers. Everything else is an assumption.
| Line | Input or formula | Amount |
|---|---|---|
| Average job value | Assumed blend of 2025 Cost vs Value project types | $40,000 |
| Jobs per year | $2,700,000 ÷ $40,000 | 67.5 |
| Jobs from repeat customers and referrals | Assumed 50% | 34 |
| Jobs to win through marketing | Remainder | 34 |
| Google Search ads | 24 jobs × $727.36 | $17,457 |
| Networx exclusive remodeling leads | 10 jobs × $993.33 | $9,933 |
| Website, local SEO, GBP | $249 × 12 | $2,988 |
| Total media, tools and fees | $30,378 (1.13% of revenue) | |
| Cost per marketed job | $30,378 ÷ 34 | $893, versus $2,520 net profit per job |
Profile 2: roofing or exterior specialty contractor, $2.2M revenue
$2.2M is the average receipts per return for “other specialty trade contractors” corporations in IRS 2023 data, and 7.5% is that group’s net income as a share of total receipts (my calculation from the same table). Job value is the 2025 national asphalt shingle roof replacement.
| Line | Input or formula | Amount |
|---|---|---|
| Average job value | Cost vs Value 2025, asphalt shingle roof replacement | $31,871 |
| Jobs per year | $2,200,000 ÷ $31,871 | 69 |
| Jobs to win through marketing | Assumed 60% of jobs | 41 |
| Google Search ads | 21 jobs × $727.36 | $15,275 |
| Networx pay-per-lead roof installation | 20 jobs × $750.00 | $15,000 |
| Website, local SEO, GBP | $249 × 12 | $2,988 |
| Total media, tools and fees | $33,263 (1.51% of revenue) | |
| Cost per marketed job | $33,263 ÷ 41 | $811, versus $2,390 net profit per job at 7.5% |
Profile 3: commercial general contractor, $20M revenue
Revenue, average project size, hit rate and hours per bid are assumptions for illustration. The 5.7% net margin is IRS 2023 net income over total receipts for building construction corporations, which mixes residential and commercial firms. The wage is the May 2025 median for cost estimators, $37.86 an hour, from the BLS Occupational Outlook Handbook, before benefits and overhead.
| Line | Input or formula | Amount |
|---|---|---|
| Average contract | Assumed | $1,500,000 |
| Wins needed | $20,000,000 ÷ $1,500,000 | 13.3 |
| Bids needed | Assumed hit rate of 1 in 6 | 80 |
| Estimating labor | 80 bids × 40 hours × $37.86 | $121,152 |
| Plan room | ConstructConnect Professional, 1 market, 1 seat | $2,388 |
| Website, proposals, sponsorships, association events | Set at the IRS 0.25% advertising ratio for building construction | $50,000 |
| Total business development budget | $173,540 (0.87% of revenue) | |
| Cost per win | $173,540 ÷ 13.3 | $13,016, versus $85,500 net profit on a $1.5M job at 5.7% |
The lever here is the hit rate, not the ad line. Move from 1 in 6 to 1 in 4 and you need 53 bids instead of 80, which cuts estimating labor by about $40,000 at the same wage. That is why commercial “marketing” money is best spent on bidding fewer, better-fit jobs and on the relationships that get you invited.
How the three profiles compare with the benchmarks
| Profile | Bottom-up budget | IRS advertising ratio applied | SBA 7 to 8% rule |
|---|---|---|---|
| Remodeler, $2.7M | $30,378 (1.13%) | $6,750 at 0.25% (building construction) | $189,000 to $216,000 |
| Roofer, $2.2M | $33,263 (1.51%) | $10,582 at 0.48% (other specialty trades) | $154,000 to $176,000 |
| Commercial GC, $20M | $173,540 (0.87%, mostly estimating labor) | $50,000 at 0.25% | Rule covers firms under $5M only |
The bottom-up numbers sit above the tax-return averages, which is what you would expect from contractors that buy leads, and far below the 7 to 8% rule. None of the residential totals include a salesperson’s or estimator’s pay; add that on its own line. In my view that split, media in one line and people in another, is the most useful thing you can do to your budget, because it shows which half is underperforming.
Where the “7 to 8 percent of revenue” rule comes from
The figure most construction marketing pages repeat traces to a 2013 SBA.gov community blog post, which said small businesses under $5 million “should allocate 7-8 percent of their revenues to marketing.” Two details rarely get quoted. The post says the percentage “assumes you have margins in the range of 10-12 percent,” and readers in the comments asked where the rule came from without getting an answer. The average remodeler’s 6.3% net margin and the 5.7% for building construction corporations are well below that condition, so by the rule’s own logic a typical contractor should spend less.
Use 7 to 8% only as an upper bound for a growth push in a residential trade with strong margins, and only if the bottom-up math shows each extra job still pays. For trades with thinner margins, compare with our HVAC marketing spend analysis, which works the same problem for a service-heavy trade.
The 70/20/10 rule for a construction marketing budget
The 70/20/10 rule is a planning heuristic, not a measured benchmark: 70% of the budget to channels with a proven cost per job, 20% to the next most likely channel, 10% to tests. Applied to Profile 1’s $30,378, that is $21,265 on Google Search ads (the channel with the lowest cost per job in your data), $6,076 on exclusive remodeling leads and $3,038 for a test such as a new service page or a neighborhood mailer. Re-sort the buckets every quarter by actual cost per signed job.
When to spend above the benchmark
- Entering a new market or service line. You have no referral base there, so the share of jobs that must come from paid channels jumps. Rerun step 1 of the formula with a lower referral share.
- A softer market. With US construction spending down 2.9% year to date through September 2026, fewer homeowners and owners are buying, so you may need more leads per signed job. Rerun the formula with your latest close rates before you cut. The 11 public homebuilders with two years of data all raised advertising in fiscal 2025.
- Selling high-ticket projects. A $170,517 midrange primary suite addition (2025 Cost vs Value) can carry a cost per signed job several times higher than a bath remodel and still clear your margin.
- Thin capacity. Do not. If your crews are booked out, extra leads go cold and shared-lead close rates fall.
If you want a second set of eyes on your own numbers, you can book a consultation and bring your job list and lead sources for the last 12 months.
Ready to scale your revenue?
Book a free 30-min consultation. We’ll diagnose your growth bottleneck and map out the 3 highest-leverage moves for your business.
Frequently asked questions
What percentage of revenue should a construction company spend on marketing?
Measured advertising in construction is low: 0.36% of business receipts for construction corporations in IRS tax year 2023 data, and a 0.65% median for public homebuilders in fiscal 2025. Bottom-up budgets for contractors who buy leads typically come out higher, around 1% to 1.5% of revenue for media, tools and fees in our worked examples, with sales and estimating salaries counted separately.
How much should a contractor spend on marketing?
Start from the job. Divide your revenue target by your average job value, subtract jobs that come from referrals and repeat customers, then multiply the remaining jobs by each channel's cost per signed job. Keep the cost per job well under your net profit per job: on a $40,000 remodel at NAHB's 6.3% average net margin, that profit is $2,520.
What is a reasonable marketing budget for a small construction company?
For a $2.7M remodeler winning 34 jobs a year through Google ads and lead services, the worked example in this article comes to about $30,000 a year in media, tools and fees, or 1.13% of revenue. A $2.2M roofer comes to about $33,000, or 1.51%. Your figure depends on your close rate, job size and how many jobs referrals already supply.
Where does the 7 to 8 percent marketing budget rule come from?
It traces to a 2013 SBA.gov community blog post that said businesses under $5 million should allocate 7 to 8 percent of revenue to marketing, assuming net margins of 10 to 12 percent. The average remodeler earned 6.3% net in fiscal 2024 per NAHB, so by the rule's own condition most contractors should spend less.
How much do home builders spend on marketing?
NAHB's 2024 Cost of Constructing a Home survey put marketing at 0.8% of the average new home sale price, or $5,633 on a $665,298 home, with sales commissions a separate 2.8%. Ten public homebuilders reported advertising between 0.19% and 0.97% of revenue in their fiscal 2025 10-K filings, with a median of 0.65%.
How do commercial contractors budget for marketing?
Commercial and public work is won through bids and relationships, so most of the budget is estimating and business development time. Heavy and civil construction corporations deducted just 0.09% of receipts for advertising in 2023. Track cost per win instead: bids needed at your hit rate, times estimating hours per bid, times your estimator cost, plus plan room and proposal costs.
What is the 70/20/10 rule for a marketing budget?
It is a planning heuristic, not a measured benchmark: put 70% of the budget into channels with a proven cost per signed job, 20% into the next most promising channel, and 10% into tests. On a $30,378 remodeler budget that is about $21,265, $6,076 and $3,038. Re-sort the buckets each quarter using your actual cost per job.
Marketing budget research