

The average US real estate brokerage with employees took in about $1.19 million in revenue in 2022: 150,892 firms in NAICS 531210 (Offices of Real Estate Agents and Brokers) reported $180.0 billion in receipts, according to the Census Bureau’s Statistics of U.S. Businesses. That average is misleading on its own. The typical brokerage took in between $100,000 and $499,999, and 208 very large firms collected 35% of all industry revenue.
Short answer: Average revenue is $1.19 million per employer brokerage (Census SUSB 2022, NAICS 531210), but 72.8% of firms take in under $500,000. Most of that revenue is gross commission income that goes straight back out to agents. The big public brokerages kept 7% to 25% of revenue as company dollar in 2025 and posted net margins between a 0.8% loss and a 1.5% profit, per their 10-Ks. The median real estate broker earned $73,220 in May 2025, per the BLS.
Most pages ranking for this question quote a “15% gross margin” or “4% net margin” with no link, or a broker salary from a job board. Below are the primary datasets that actually measure brokerage money: Census receipts, IRS tax returns, BLS wages, the NAR Member Profile and the 10-K filings of the public brokerages. I computed the averages myself (receipts divided by firms or returns) and label every calculation. At the end there is a copy-ready brokerage P&L model with the math filled in.
Real estate brokerage average revenue: what each primary source says
Each source counts a different thing. Census counts brokerage firms that have at least one W-2 employee. The nonemployer data counts one-person businesses with no payroll, which is where most individual agents land. The IRS counts sole proprietor tax returns. Read the “what it measures” column before you compare your brokerage to any of these numbers.
| Source and year | What it measures | Average | How it was calculated |
|---|---|---|---|
| Census SUSB 2022, NAICS 531210 | Receipts per employer brokerage firm (a firm can have several offices) | $1,192,995 | $180,013,344,000 ÷ 150,892 firms (my calculation) |
| Census SUSB 2022, NAICS 531210 | Receipts per brokerage office (establishment) | $1,087,136 | $180,013,344,000 ÷ 165,585 establishments (my calculation) |
| Census Nonemployer Statistics 2022, NAICS 5312 | Receipts per real estate agent or broker business with no paid employees | $71,004 | $61,655,041,000 ÷ 868,344 nonemployer businesses (my calculation) |
| IRS SOI Table 1, tax year 2023 | Business receipts per sole proprietor return, offices of real estate agents, brokers, property managers and appraisers | $63,319 | $66,261,028,000 ÷ 1,046,471 returns (my calculation) |
| IRS SOI Table 1, tax year 2023 | Net income less deficit per sole proprietor return, same group | $22,139 | $23,167,501,000 ÷ 1,046,471 returns (my calculation) |
| eXp World Holdings 10-K, FY2025 | Revenue per agent at the largest cloud brokerage | $57,456 | $4,772,311,000 ÷ 83,060 agents (my calculation) |
What the gaps tell you:
- Census SUSB is the best answer to “real estate brokerage average revenue.” It covers every brokerage with a payroll, from a two-person shop to the national firms. It does not include brokerages that run with no W-2 staff at all.
- Employer brokerages are thin on staff. The 150,892 firms reported only 416,530 paid employees, about 2.8 per firm (my calculation). Agents are mostly not on payroll: NAR’s 2026 Member Profile found 86% of Realtors are independent contractors at their firms.
- The nonemployer and IRS numbers mostly describe individual agents, not brokerages. An agent who files a Schedule C for commission income shows up there. The IRS group also includes property managers and appraisers, so treat it as a ceiling on how specific it is.
How much does a real estate brokerage make? The typical firm is much smaller than the average
Census also sorts brokerages by annual revenue band, which shows where a typical firm sits. I added the cumulative share and the average per firm in each band. All math is mine from the published totals.
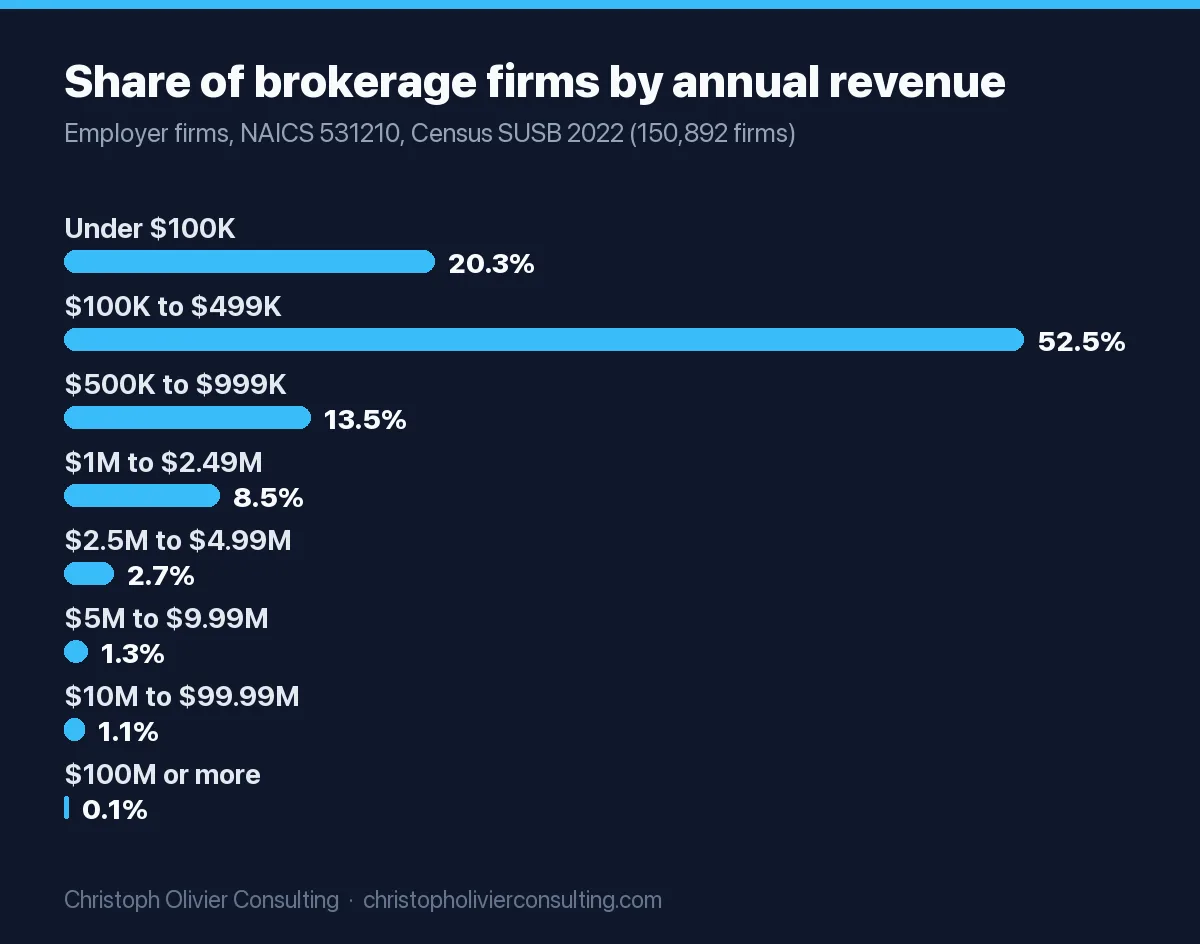
| Firm annual receipts | Firms | Share of firms | Cumulative share | Average receipts per firm | Share of industry receipts |
|---|---|---|---|---|---|
| Under $100,000 | 30,565 | 20.3% | 20.3% | $55,613 | 0.9% |
| $100,000 to $499,999 | 79,253 | 52.5% | 72.8% | $243,325 | 10.7% |
| $500,000 to $999,999 | 20,335 | 13.5% | 86.3% | $689,398 | 7.8% |
| $1 million to $2.49 million | 12,825 | 8.5% | 94.8% | $1,508,578 | 10.7% |
| $2.5 million to $4.99 million | 4,066 | 2.7% | 97.4% | $3,411,839 | 7.7% |
| $5 million to $9.99 million | 1,907 | 1.3% | 98.7% | $6,724,679 | 7.1% |
| $10 million to $99.99 million | 1,733 | 1.1% | 99.9% | $20,400,856 | 19.6% |
| $100 million or more | 208 | 0.1% | 100% | $305,825,692 | 35.3% |
Source: Census SUSB 2022, receipts size table, NAICS 531210. Bands from $5 million upward combine several Census bands. Shares and averages are my calculations.
Three things stand out. The median brokerage firm sits in the $100,000 to $499,999 band. Only 5.2% of employer brokerages clear $2.5 million a year. And the 208 firms above $100 million, with 11,418 offices between them, took in $63.6 billion, more than the bottom 94.8% of firms combined (30.2%).
Average brokerage revenue by state
The same Census release breaks NAICS 531210 out by state. Firms are counted in every state where they have an office, so a multi-state brokerage appears more than once. Averages are my calculations.
| State | Brokerage firms | Receipts (2022) | Average receipts per firm |
|---|---|---|---|
| California | 21,559 | $27.85 billion | $1,292,036 |
| Florida | 19,998 | $19.45 billion | $972,429 |
| Texas | 10,116 | $12.89 billion | $1,274,223 |
| New York | 5,955 | $11.08 billion | $1,860,631 |
| Arizona | 6,135 | $10.84 billion | $1,767,562 |
| Washington | 5,362 | $9.97 billion | $1,858,842 |
| New Jersey | 1,770 | $6.30 billion | $3,560,374 |
| Georgia | 5,911 | $6.22 billion | $1,051,702 |
| North Carolina | 6,328 | $5.63 billion | $889,673 |
| Colorado | 7,459 | $5.20 billion | $697,372 |
Source: Census SUSB 2022, state by 6-digit NAICS file. Top 10 states by total receipts. New Jersey’s high average reflects a small number of firms with large offices, not typical New Jersey brokerages.
Gross commission income vs company dollar: the number that actually pays the bills
Brokerage revenue is mostly pass-through money. When a home closes, the full commission lands at the brokerage as gross commission income (GCI). The brokerage then pays the agent’s share under the agent’s independent contractor agreement. What stays is the company dollar, and rent, staff, technology, marketing and the owner’s profit all come out of it.
Anywhere Real Estate’s 2024 10-K lays out the mechanics in plain terms. Its company-owned brokerages earned an average homesale broker commission rate of 2.37% per side, or $18,557 of GCI per side, on 249,421 closed sides. Those offices also paid the franchise arm a royalty and marketing fee of about 6% of GCI, and “the remainder of gross commission income is split between the broker … and the independent sales agent,” with the split varying by agent.
The worked math for one side of a $400,000 sale at that 2.37% rate (my calculation, example price):
- GCI: $400,000 × 2.37% = $9,480
- Franchise royalty and marketing, if franchised: 6% × $9,480 = $569
- Agent share on an 80/20 split of the remainder: 80% × $8,911 = $7,129
- Company dollar: $8,911 − $7,129 = $1,782, or 18.8% of GCI
Every brokerage benchmark worth using is quoted against one of these two lines. A “20% margin” for a brokerage usually means company dollar as a share of GCI, not profit. Ask which one before you compare.
Real estate brokerage profit margin: what the public brokerages’ 10-Ks show
Public brokerages are the only firms that publish audited numbers. I pulled each company’s latest annual report from SEC EDGAR and computed company dollar (revenue minus agent commissions) and margins from the income statement. Anywhere is shown for 2024 because Compass completed its acquisition of Anywhere on January 9, 2026, per Compass’s 2025 10-K, so Anywhere filed no 2025 10-K.
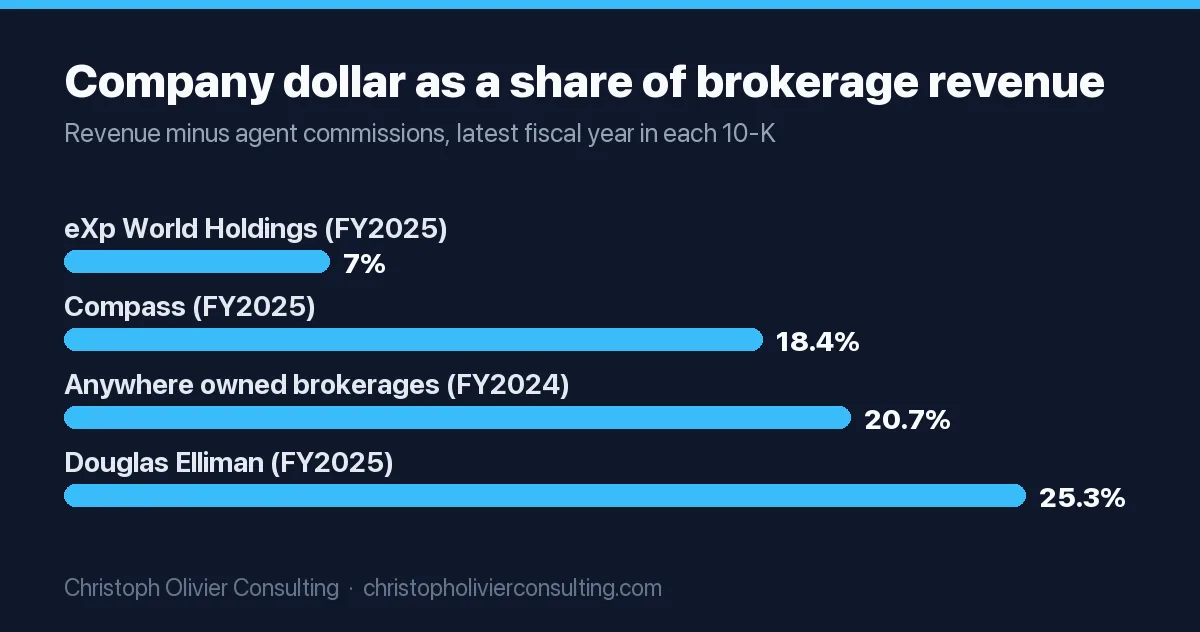
| Brokerage (fiscal year, filing) | Revenue | Agent commissions | Company dollar (share of revenue) | Operating margin | Net margin |
|---|---|---|---|---|---|
| Compass, FY2025 (10-K) | $6,961.6M | $5,679.7M (81.6%) | $1,281.9M (18.4%) | −0.9% | −0.8% |
| eXp World Holdings, FY2025 (10-K) | $4,772.3M | $4,438.7M (93.0%) | $333.6M (7.0%) | −0.4% | −0.5% |
| Douglas Elliman, FY2025 (10-K) | $1,033.1M | $772.0M (74.7%) | $261.1M (25.3%) | 4.4% reported; −3.5% excluding an $81.7M gain on a business sale | 1.5% |
| Anywhere, Owned Brokerage Group segment, FY2024 (10-K) | $4,688M | $3,718M (79.3%) | $970M (20.7%) | −2.0% (segment operating EBITDA) | Not reported by segment |
| RE/MAX Holdings, FY2025 (10-K), franchisor | $291.6M | Not applicable (franchise fees, not GCI) | Not applicable | 16.1% | 4.6% |
Revenue, commission and income figures are as reported. Percentages, company dollar and the Douglas Elliman ex-gain operating margin are my calculations. Compass and Douglas Elliman net margins use net income attributable to the company; eXp and RE/MAX use consolidated net income.
What the filings say about profitability:
- Company dollar runs 7% to 25% of revenue, and it is set almost entirely by the agent split. eXp, a high-split cloud model, keeps 7.0%. Douglas Elliman, a traditional luxury brokerage, keeps 25.3%. Compass says its ratio improved in 2025 because acquired brokerages “operate with more favorable average agent commissions splits compared to our core brokerage.”
- Brokerage operations hover around break-even. None of the three operating brokerages made a GAAP operating profit from brokerage alone in 2025, and Anywhere’s owned brokerages posted a $93 million segment EBITDA loss in 2024. Douglas Elliman’s only positive net income came with a one-time gain.
- The money is in franchising and fees. Anywhere’s franchise segment produced $521 million of segment operating EBITDA on $961 million of segment revenue in 2024, while the brokerage segment lost money. RE/MAX, which collects fees instead of commissions, reported a 32.1% adjusted EBITDA margin for 2025.
- Adjusted EBITDA is friendlier than GAAP. Compass reported a 4.2% adjusted EBITDA margin for 2025 and eXp $33.2 million of adjusted EBITDA (0.7% of revenue, my calculation), both above their GAAP results. If a benchmark quotes “EBITDA,” it is usually this adjusted measure.
These are the largest firms in the country, so they are a reference point, not a target. A small independent brokerage with low overhead can keep more than they do. A small brokerage paying a 6% franchise fee on top of an 80/20 split can easily keep less. For how brokerages compare with other industries, see our profit margin by industry tables.
Revenue and company dollar per agent
Per-agent numbers make the models easier to compare with your own roster. All figures below are my calculations from each 10-K.
| Brokerage | Agents (as reported) | Revenue per agent | Company dollar per agent | Company dollar per transaction |
|---|---|---|---|---|
| Douglas Elliman, FY2025 | About 5,800 agents; 21,338 transactions | $178,113 | $45,014 | $12,236 |
| Compass, FY2025 | 21,190 principal agents (about 37,000 agents in total); 250,360 transactions | $328,532 per principal agent | $60,496 per principal agent | $5,120 |
| eXp World Holdings, FY2025 | 83,060 agents; 440,163 sales transactions | $57,456 | $4,016 | $758 |
| Anywhere Owned Brokerage Group, FY2024 | 249,421 closed homesale sides | Not disclosed for this segment | Not disclosed | $3,889 per side |
Compass defines principal agents as team leaders or agents operating independently. Douglas Elliman’s average transaction value was $1.86 million in 2025, which explains its high per-transaction figures.
How much do brokerage owners make?
No federal dataset reports brokerage owner pay directly. Here is what the primary sources do show, from the narrowest to the broadest measure:
| Measure | Figure | Source |
|---|---|---|
| Median annual wage, real estate brokers (May 2025) | $73,220 (lowest 10% under $37,110, highest 10% over $143,300) | BLS Occupational Outlook Handbook |
| Share of real estate brokers who are self-employed | 55% (of about 103,500 broker jobs in 2025) | BLS Occupational Outlook Handbook |
| Average net income per sole proprietor return, real estate agents, brokers, property managers and appraisers (tax year 2023) | $22,139 (my calculation) | IRS SOI Table 1 |
| Median gross income, Realtors with 16 or more years of experience (2025) | $88,500 | NAR 2026 Member Profile |
| Average payroll per W-2 employee at employer brokerages (2022) | $82,258 (my calculation: $34.26B payroll ÷ 416,530 employees) | Census SUSB 2022 |
In practice, an owner’s income has two parts: the brokerage’s profit after expenses, and the owner’s own commissions if the owner still sells. Given the public brokerages’ near-zero operating margins and the fact that 72.8% of employer brokerages take in under $500,000, most small brokerage owners earn the bulk of their income from personal production, not from the agents they host. The P&L model below shows how the math works for a 25-agent office.
Real estate broker average income vs agent income
The BLS reports a May 2025 median of $73,220 for brokers and $52,830 for sales agents. NAR’s 2026 Member Profile puts the median gross income of all Realtors at $59,200 for 2025, up from $58,100, with $8,000 for members with two years or less of experience. The typical Realtor completed nine transaction sides in 2025. If you want to see what that means in client counts, our breakdown of how many clients real estate agents have uses the same NAR data.
How much does a real estate agent make on a $300,000 house?
Start with the commission rate, then subtract the brokerage’s share. Redfin reported that the average buyer’s agent commission on homes that sold for under $500,000 was 2.52% in the second quarter of 2025 (2.43% across all prices). The math below is my calculation using that rate:
| Step | 70/30 split | 80/20 split | 90/10 split |
|---|---|---|---|
| Buyer-side commission: $300,000 × 2.52% | $7,560 | $7,560 | $7,560 |
| Brokerage keeps (company dollar) | $2,268 | $1,512 | $756 |
| Agent’s gross on the deal | $5,292 | $6,048 | $6,804 |
| Agent’s gross if a 25% referral fee comes off the top first | $3,969 | $4,536 | $5,103 |
That gross is before the agent’s own expenses. NAR’s 2026 Member Profile release put Realtors’ median business expenses at $9,530 for 2025. The 25% referral line is the common norm covered in our guide to the real estate agent referral fee; check your own agreement. The listing side is negotiated separately, and Redfin’s figure covers only the buyer side.
Copy-ready brokerage P&L model (with a 25-agent worked example)
Use this to estimate your own revenue, company dollar and owner profit. The structure follows the income statements in the 10-Ks above. In the example, the sides per agent come from NAR’s 2025 median, the commission rate from Anywhere’s 2024 average, the royalty from Anywhere’s description of its franchise fee and the staff cost from Census payroll data. The $400,000 price, the split and the four overhead lines are example inputs I chose for illustration. Replace every input with your own numbers.
| Line | Formula | Independent brokerage | Franchised brokerage |
|---|---|---|---|
| A. Agents | Input | 25 | 25 |
| B. Sides per agent per year | Input (NAR 2025 median: 9) | 9 | 9 |
| C. Average sale price | Input (example) | $400,000 | $400,000 |
| D. Commission rate per side | Input (Anywhere 2024 average: 2.37%) | 2.37% | 2.37% |
| E. Gross commission income (GCI) | A × B × C × D | $2,133,000 | $2,133,000 |
| F. Franchise royalty and marketing fee | E × royalty rate (about 6% at Anywhere) | $0 | $127,980 |
| G. Agent commissions | (E − F) × agent split (example: 80%) | $1,706,400 | $1,604,016 |
| H. Company dollar | E − F − G | $426,600 (20.0% of GCI) | $401,004 (18.8% of GCI) |
| I. Staff payroll | 2 employees × $82,258 (Census average payroll per brokerage employee, 2022) | $164,516 | $164,516 |
| J. Occupancy | Input (example) | $60,000 | $60,000 |
| K. Technology, MLS and transaction software | Input (example) | $30,000 | $30,000 |
| L. Marketing and recruiting | Input (example) | $50,000 | $50,000 |
| M. E&O insurance, accounting, legal | Input (example) | $30,000 | $30,000 |
| N. Profit before owner pay and taxes | H − (I + J + K + L + M) | $92,084 (4.3% of GCI) | $66,488 (3.1% of GCI) |
Three checks to run on your own version:
- Company dollar between 7% and 25% of GCI. That is the range in the public filings above. Below 10% means a high-split or capped model that needs volume or fee income to work. Above 25% usually means a luxury or traditional split that has to keep agents happy with services.
- Payroll near or below 19% of revenue. Employer brokerages paid $34.26 billion in payroll on $180.0 billion of receipts in 2022, or 19.0% (my calculation from Census SUSB). Payroll consuming most of your company dollar is the most common reason small brokerages lose money.
- Profit per agent, not profit in total. In the example, each agent contributes $3,683 of profit before owner pay ($92,084 ÷ 25). Losing one top producer who closes 30 sides removes $56,880 of company dollar (30 × $9,480 × 20%) and more than half of the profit.
If recruiting is the lever, your agent count depends on lead flow. Our guide to lead generation for real estate agents covers the channels that produce deals, and the real estate marketing plan template turns that into a budget.
Rules of thumb brokerage owners hear (and what the data says)
What is the 80/20 rule for realtors?
It is the Pareto principle applied to real estate: a small share of agents, clients or lead sources produces most of the business. It is a rule of thumb, not a measured statistic. The Census data shows the same kind of concentration at the firm level: the 5.2% of employer brokerages with $2.5 million or more in receipts took in 69.8% of all industry receipts in 2022 (my calculation from SUSB). Inside a brokerage, the practical version is to know which agents produce your company dollar and protect them first.
What is the 3-3-3 rule for real estate?
The version agents use is a monthly outreach habit. Florida Realtors described it in September 2025 as calling three people, sending three handwritten notes and sharing three valuable resources each month. Some blogs use the same name for a buyer savings checklist, so check the context. For a brokerage owner, it matters because repeat and referral business is the cheapest revenue there is: NAR found the typical Realtor earned 28% of business from repeat clients and 22% from referrals in 2025. For more numbers on how buyers and sellers find agents, see our real estate marketing statistics.
How to read your own numbers against these benchmarks
- Revenue under $500,000: you are in the same band as 72.8% of employer brokerages. Owner income will come mostly from personal production.
- Revenue of $1 million to $2.5 million: you are in roughly the top 14% of employer brokerages (13.7% of firms are at $1 million or more). Company dollar and payroll discipline decide whether there is profit left.
- Revenue above $2.5 million: you are in the top 5.2%. At this size, split structure and fee income (franchise, title, mortgage joint ventures) matter more than agent count, which is exactly what the public filings show.
If you want a second opinion on your brokerage’s recruiting and marketing budget against your company dollar, you can book a consultation.
Ready to scale your revenue?
Book a free 30-min consultation. We’ll diagnose your growth bottleneck and map out the 3 highest-leverage moves for your business.
Frequently asked questions
What is the average revenue of a real estate brokerage?
Employer brokerages averaged $1.19 million in receipts in 2022: 150,892 firms in NAICS 531210 reported $180.0 billion, per Census Statistics of U.S. Businesses (my calculation). The typical firm is smaller. 72.8% of employer brokerages took in under $500,000, and 208 firms above $100 million collected 35.3% of all industry receipts.
How much does a real estate brokerage make in profit?
Very little after agents are paid. Public brokerages kept 7% to 25% of revenue as company dollar in 2025 (eXp 7.0%, Compass 18.4%, Douglas Elliman 25.3%), and net margins ranged from a 0.8% loss to a 1.5% profit, based on their 10-K filings. Small independents with low overhead can do better; franchised offices pay about 6% of GCI in royalties first.
What is a good profit margin for a real estate brokerage?
Measure two lines. Company dollar, what stays after agent splits, ran 7% to 25% of revenue at the public brokerages in their latest 10-Ks. Profit after overhead is far thinner: Compass, eXp and Anywhere's owned brokerages were at or below break-even. In the worked P&L model on this page, a 25-agent independent office keeps about 4% of GCI before owner pay.
How much do real estate brokerage owners make?
There is no official owner pay statistic. The BLS reports a median of $73,220 for real estate brokers in May 2025, and 55% of brokers are self-employed. IRS data for tax year 2023 shows average net income of $22,139 per sole proprietor return for agents, brokers and related businesses. Most small brokerage owners earn mainly from their own sales, not from agents' splits.
What is the average income of a real estate broker?
The BLS median annual wage for real estate brokers was $73,220 in May 2025, with the lowest 10% under $37,110 and the highest 10% over $143,300. For comparison, sales agents had a median of $52,830. NAR's 2026 Member Profile puts median gross income for all Realtors at $59,200 for 2025 and $88,500 for those with 16 or more years of experience.
How much does a real estate agent make on a $300,000 house?
On the buyer side, Redfin reported an average buyer's agent commission of 2.52% for homes under $500,000 in Q2 2025. That is $7,560 on a $300,000 sale. The agent keeps $5,292 on a 70/30 split, $6,048 on 80/20 or $6,804 on 90/10, before referral fees and personal business expenses. The listing side is negotiated separately.
What is the 80/20 rule for realtors?
It is the Pareto principle: a small share of agents, clients or lead sources generates most of the business. It is a rule of thumb, not a measured figure. Census data shows similar concentration among firms: brokerages with $2.5 million or more in receipts were 5.2% of employer firms in 2022 but took in 69.8% of industry receipts, by my calculation.
Practice economics benchmarks