

The average US CPA firm brought in about $2.97 million in 2022: 50,885 firms classified as Offices of Certified Public Accountants (NAICS 541211) reported $151.1 billion in receipts to the Census Bureau. That mean is pulled up by a few giants. 62% of CPA firms earned under $500,000, the 50,797 firms with fewer than 500 employees averaged about $1.0 million, and the median firm in the AICPA’s 2025 MAP Survey reported $1.22 million in net client fees with 36.9% left over before partners are paid.
Below: the Census numbers for every accounting sub-industry (CPAs, tax prep, bookkeeping, payroll), the full revenue-size distribution, revenue per employee and per partner, the profit margin by firm size, what owners actually take home, and a copy-ready P&L worksheet you can drop your own numbers into. Every average here is computed from the source table, and each table names its dataset, year and NAICS code.
Short answer: Mean revenue for a US CPA firm was $2.97 million in 2022 (Census SUSB, NAICS 541211), but the typical firm is far smaller: 62% earned under $500,000. The median MAP Survey firm had $1.22 million in fees, $711,784 in fees per partner and kept 36.9% of fees as profit before partner pay. A solo CPA filing Schedule C averaged $146,840 in receipts and $65,773 in net income (IRS, 2023).
Accounting firm average revenue by NAICS code (Census, 2022)
“Accounting firm” covers four different businesses with very different economics. The Census Bureau’s Statistics of US Businesses (SUSB) 2022 table splits NAICS 5412 into its four parts. I divided receipts by firms (an enterprise, which can have several offices) and by establishments (a single office) to get the averages below. SUSB covers employer firms only: a solo practitioner with no payroll is not in these counts (the IRS data further down covers them).
| NAICS industry (2022) | Firms | Receipts | Average per firm | Average per office | Receipts per employee | Payroll as % of receipts |
|---|---|---|---|---|---|---|
| 541211 Offices of CPAs | 50,885 | $151.15B | $2,970,358 | $2,716,413 | $263,807 | 37.1% |
| 541211 CPA firms under 500 employees | 50,797 | $51.06B | $1,005,176 | $966,513 | $174,220 | 43.0% |
| 541213 Tax preparation services | 19,464 | $8.25B | $423,976 | $290,716 | $62,700 | 39.2% |
| 541219 Other accounting services (incl. bookkeeping) | 45,390 | $28.97B | $638,236 | $623,645 | $116,910 | 47.2% |
| 541214 Payroll services | 4,484 | $27.32B | $6,093,408 | $4,985,920 | $98,054 | 73.6% |
| 5412 All accounting, tax, bookkeeping, payroll | 120,085 | $215.69B | $1,796,155 | $1,586,432 | $175,216 | 43.2% |
Source: US Census Bureau, SUSB 2022 (2022 County Business Patterns and Economic Census), US totals. Averages computed as receipts divided by firms or establishments. Employment is paid employees in the March pay period, so partners and proprietors who are not on payroll are excluded.
Two things stand out. First, the 88 CPA firms with 500 or more employees earned $100.1 billion, or 66% of all CPA firm receipts, while being 0.17% of firms. Strip them out and the average CPA firm drops from $2.97 million to $1.0 million. Second, tax preparation offices average $290,716 per location because chains run thousands of small seasonal offices: just 13 tax prep firms with 500+ employees ran 7,477 establishments.
What is the formula for average revenue?
For an industry, average revenue per firm = total receipts ÷ number of firms. Using the Census figures: $151,146,658,000 ÷ 50,885 = $2,970,358. Per office, divide by establishments instead: $151,146,658,000 ÷ 55,642 = $2,716,413. (In economics, “average revenue” also means total revenue ÷ units sold, which for a firm that sells only one service equals price.) For your own firm, the more useful versions are revenue ÷ partners and revenue ÷ full-time professionals, covered below.
Why the average misleads: most CPA firms earn under $500,000
The Census also publishes the same 2022 data by enterprise receipts size. This is the table that answers “what does a normal CPA firm make,” because it shows the whole distribution instead of one mean.
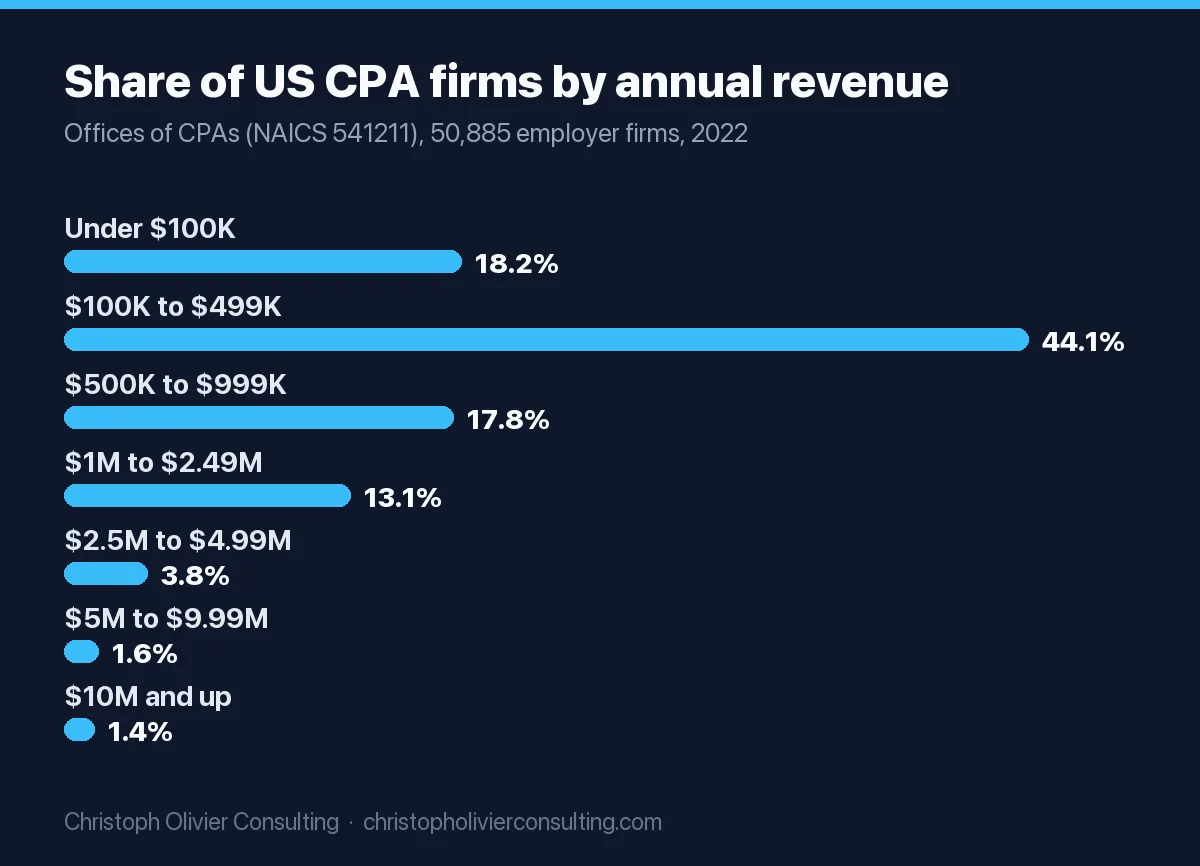
| Annual receipts (CPA firms, NAICS 541211) | Firms | Share of firms | Cumulative share | Average receipts in band | Share of all CPA receipts |
|---|---|---|---|---|---|
| Under $100,000 | 9,265 | 18.2% | 18.2% | $48,505 | 0.3% |
| $100,000 to $499,999 | 22,434 | 44.1% | 62.3% | $262,840 | 3.9% |
| $500,000 to $999,999 | 9,046 | 17.8% | 80.1% | $705,292 | 4.2% |
| $1M to $2.49M | 6,642 | 13.1% | 93.1% | $1,522,444 | 6.7% |
| $2.5M to $4.99M | 1,931 | 3.8% | 96.9% | $3,419,211 | 4.4% |
| $5M to $9.99M | 837 | 1.6% | 98.6% | $6,792,588 | 3.8% |
| $10M and up | 730 | 1.4% | 100% | $158,932,436 | 76.8% |
Source: US Census Bureau, SUSB 2022, Number of Firms, Establishments, Employment, Payroll and Receipts by Enterprise Receipts Size (released April 10, 2025). Bands above $5M combined from the published rows; averages and shares computed from receipts and firm counts.
So the median employer CPA firm sits in the $100,000 to $499,999 band, and 80% of firms are under $1 million. A firm at $1 million in revenue is already larger than four out of five CPA practices in the country. The 730 firms at $10 million and up take 76.8% of the money; the 104 firms above $100 million alone take 67%.
CPA firm average revenue by number of employees
If you know your headcount, this is the closest peer group. Same SUSB 2022 dataset, NAICS 541211, split by enterprise employment size.
| Employees (CPA firms) | Firms | Average receipts per firm | Receipts per employee | Payroll as % of receipts |
|---|---|---|---|---|
| 0 to 4 | 35,096 | $300,013 | $180,076 | 33.3% |
| 5 to 9 | 9,158 | $944,405 | $143,989 | 40.4% |
| 10 to 19 | 4,257 | $2,000,227 | $152,927 | 45.2% |
| 20 to 99 | 2,015 | $6,602,856 | $181,323 | 48.5% |
| 100 to 499 | 271 | $37,129,554 | $221,218 | 46.0% |
| 500 or more | 88 | $1,137,349,114 | $357,624 | 34.1% |
Source: US Census Bureau, SUSB 2022, US, NAICS 541211. “0 to 4” includes firms that had payroll during the year but no employees in the March pay period. Averages computed by dividing receipts by firms and by employees.
What is the typical revenue per employee for a CPA firm?
Three primary sources, three slightly different measures:
- $144,000 to $181,000 per employee for CPA firms with 5 to 99 employees (Census SUSB 2022, table above). The overall $263,807 is inflated by the largest firms and because partners in partnerships are not counted as employees.
- $208,128 in net client fees per full-time professional, the median in the AICPA’s 2025 National MAP Survey executive summary (fiscal 2024 data, 1,073 firms). Top performers: $259,444. This counts professionals only, not admin staff.
- $253,055 per employee across the Top 100 firms ($140.79 billion in revenue over 556,378 total employees), computed from the Accounting Today 2026 Top 100 Firms report. Top 100 firms under $100 million: $223,535.
A working rule from these numbers: a small firm below about $150,000 of revenue per head (all staff) or $200,000 per full-time professional is under the national middle.
Revenue per partner at accounting firms
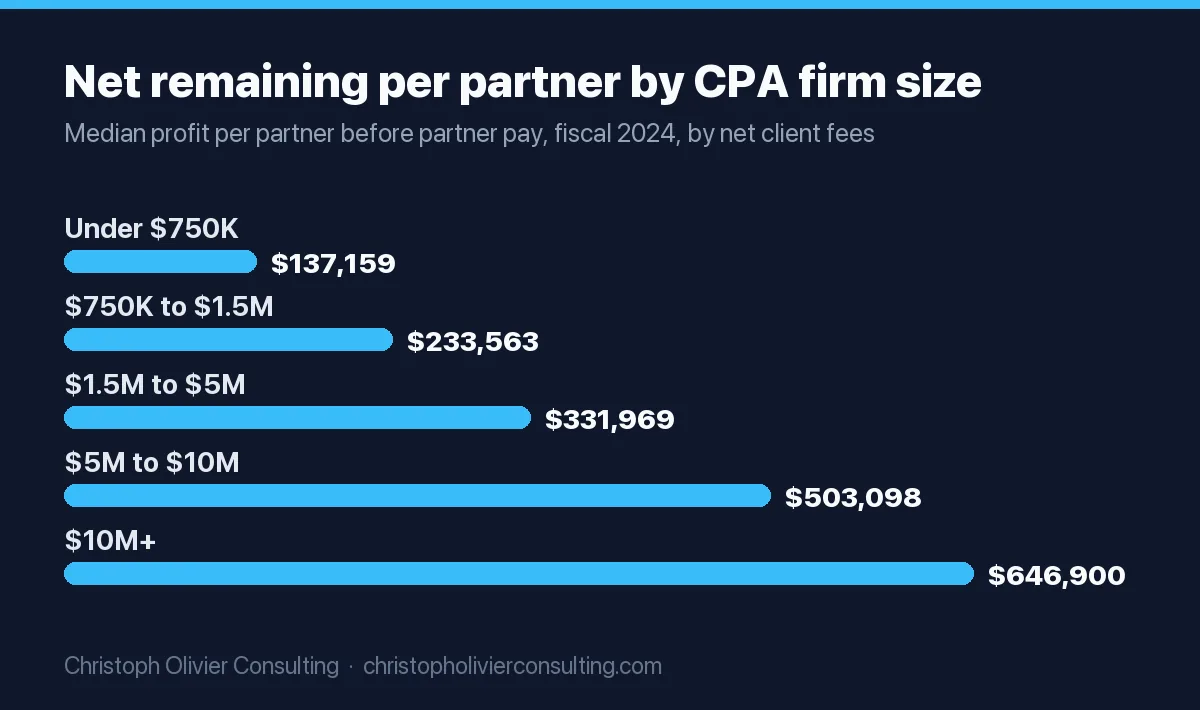
Revenue per partner is the metric firm owners actually compare, because it combines pricing, staffing and owner count in one number. The median across all 2025 MAP respondents was $711,784 in net client fees per partner/owner, up 11.5% from $638,470 in the 2023 survey, per the AICPA MAP executive summary. Here is the full by-size picture from that report (fiscal year 2024, medians).
| Firm size (net client fees) | Median NCF | NCF per partner/owner | NCF per full-time professional | Net remaining per partner/owner | Billable pros per equity partner | Realization |
|---|---|---|---|---|---|---|
| Under $200K | $106,301 | $102,450 | $85,000 | $44,761 | 1.00 | 100.0% |
| $200K to $500K | $330,000 | $295,838 | $212,850 | $160,035 | 1.50 | 100.0% |
| $500K to $750K | $609,852 | $580,116 | $179,974 | $193,724 | 2.00 | 100.0% |
| $750K to $1.5M | $1,049,536 | $747,204 | $196,790 | $233,563 | 2.50 | 99.0% |
| $1.5M to $5M | $2,620,966 | $1,025,000 | $220,153 | $331,969 | 3.50 | 96.0% |
| $5M to $10M | $6,539,639 | $1,578,801 | $246,931 | $503,098 | 5.50 | 92.7% |
| $10M+ | $17,676,641 | $2,146,760 | $250,382 | $646,900 | 7.40 | 87.5% |
| All respondents | $1,218,598 | $711,784 | $208,128 | $252,663 | 3.00 | n/a |
| Top performers (top 25%) | $5,299,429 | $1,664,009 | $259,444 | $616,052 | 5.78 | n/a |
Source: AICPA PCPS and CPA.com, 2025 National MAP Survey Executive Summary, Exhibits 5, 8, 11, 12 and 13. Fiscal year 2024; medians. “Billable pros per equity partner” is the survey’s firm ratio of billable professionals to equity partners. Realization not shown for all respondents in the summary.
At the top of the market, revenue per partner runs higher still. From the Accounting Today 2026 Top 100 databank (fiscal 2025, US only; “partners” includes equity and non-equity partners):
| Top 100 tier (2026 report) | Firms | Total revenue | Partners | Revenue per partner | Employees per partner |
|---|---|---|---|---|---|
| Over $1 billion | 15 | $122,235.76M | 26,010 | $4.70M | 18.4 |
| $100M to $1 billion | 57 | $16,270.95M | 7,303 | $2.23M | 9.4 |
| Under $100M | 28 | $2,287.66M | 1,351 | $1.69M | 7.6 |
| #100 on the list (YHB, Winchester, Va.) | 1 | $68.60M | 34 | $2.02M | 8.9 |
Source: Accounting Today, 2026 Top 100 Firms (Arizent), databank and rankings. Ratios computed from published revenue, partner and total employee counts. Big Four revenue is gross, not net.
The pattern across both tables is consistent: revenue per partner climbs with the number of billable people each partner oversees. The top-performer firms in the MAP survey had 5.78 billable professionals per equity partner against 3.00 overall, and twice the fees per partner.
Accounting firm average profit margin
Accounting firms rarely report “profit margin” the way a manufacturer does, because partners take profit as pay. The standard measure is net remaining: net client fees minus all expenses, before partner compensation. In the 2025 MAP Survey, the median firm’s net remaining per partner was 36.9% of net client fees; for top performers it was 38.4%. Net remaining per partner rose 11.9%, from $225,725 (fiscal 2022) to $252,663 (fiscal 2024), as the AICPA’s release confirms.
| Firm size (net client fees) | Total expenses, % of NCF (before owner pay) | Non-owner salaries, % of NCF | Rent and occupancy, % of NCF | Main service line (share of firms) |
|---|---|---|---|---|
| Under $200K | 42.2% | 16.9% | 2.3% | Tax, 74% |
| $200K to $500K | 47.7% | 19.7% | 4.5% | Tax, 82% |
| $500K to $750K | 60.7% | 28.7% | 4.6% | Tax, 83% |
| $750K to $1.5M | 64.5% | 30.3% | 4.6% | Tax, 74% |
| $1.5M to $5M | 66.3% | 34.4% | 4.0% | Tax, 76% |
| $5M to $10M | 67.9% | 39.1% | 3.9% | Tax, 77% |
| $10M+ | 73.4% | 41.1% | 3.7% | Tax, 63% |
Source: AICPA 2025 National MAP Survey Executive Summary, Exhibits 11 to 13 (fiscal 2024 medians). Each column is a separate median, so rows do not sum.
Read it this way: as firms grow, more of each fee dollar goes to staff salaries, so the margin before owner pay shrinks, but the dollars per partner grow because each partner has more people billing under them.
What is the typical profit margin for CPA firms?
Before paying the owners, roughly 35% to 40% of fees for a typical small or mid-sized firm (MAP median 36.9%). For sole proprietors the IRS figure is higher because there is no staff layer: CPA offices filing Schedule C reported $1.87 billion of net income on $4.18 billion of receipts in tax year 2023, a 44.8% net margin before the owner’s own pay, per the IRS SOI Nonfarm Sole Proprietorship Table 1, 2023. After you pay owners a market salary for the work they do, the true economic margin is much thinner; see the worked example in the worksheet below.
Is a 40% profit margin high?
For an accounting firm measured before partner pay, 40% is at or slightly above the top-performer median (38.4%). For a margin measured after a market salary for every owner, 40% would be exceptional. Compare it with other sectors on our profit margin by industry page, but only like for like: most industry margins are after owner salaries, the CPA firm benchmark is not.
Is 30% markup the same as 30% margin?
No. Margin is profit ÷ price; markup is profit ÷ cost. A 30% markup on $100 of cost gives a $130 price and a 23.1% margin (30 ÷ 130). A 30% margin needs a 42.9% markup (30 ÷ 70). When you build fees from staff cost (hours × cost per hour), quote targets as margin so the math matches the MAP benchmarks.
Is 3% a low profit margin?
For an accounting firm, yes, very. Even the smallest MAP band keeps more than half its fees before owner pay (expenses of 42.2% to 47.7% of fees in firms under $500,000). A 3% margin after paying owners a fair salary means the firm is barely covering its own labor; a 3% margin before owner pay means it is effectively losing money. In the IRS 2023 data, 5,206 of 28,476 CPA sole proprietorships (18.3%) reported no net income.
Is an accounting firm profitable? What owners actually take home
Yes, for most owners, and the income scales with size and staffing:
- Solo CPAs (Schedule C, 2023): average receipts $146,840 and net income $65,773 across all 28,476 returns; for the 23,270 with a profit, $161,537 in receipts and $82,428 in net income (IRS SOI sole proprietorship statistics).
- Owners in MAP Survey firms: median compensation per equity partner $202,521 in fiscal 2024, up 10% from $183,855; at top-performing firms, $508,234 (MAP Exhibits 3 and 8).
- Equity partners in the Rosenberg MAP Survey: average income per equity partner of $615,000, up 3.2%, per CPA Trendlines’ 2025 coverage (the full survey is paid, and its sample and definitions differ from the AICPA’s, so compare the two only loosely).
Can you make $500,000 a year as an accountant?
As an owner, yes; as an employee, rarely. The highest 10% of all accountants and auditors earned more than $144,090 in May 2025, per the BLS Occupational Outlook Handbook. The $500,000 level shows up in the owner data: top-performer equity partners at a median $508,234 (AICPA MAP) and an average $615,000 per equity partner in the Rosenberg survey. In the MAP data, net remaining per partner clears $500,000 at the median only in firms with $5 million or more in fees.
Do most CPAs make 6 figures? How much does a 30 year old CPA make?
The BLS median for accountants and auditors (CPA and non-CPA combined) was $83,680 in May 2025, and $81,490 inside accounting, tax and bookkeeping firms. BLS does not publish pay by age or CPA status. The MAP Survey publishes it by experience, which is the closest proxy for age: median pay was $77,364 for senior associates (4 to 5 years), $99,000 for managers (6 to 7 years) and $111,798 for senior managers (8 to 10 years) in fiscal 2024. Someone who started at 22 or 23 is usually at manager or senior manager level by 30, so roughly $99,000 to $112,000 at a typical small or mid-sized firm, with Big Four and large-firm pay outside this sample.
CPA firm P&L benchmark worksheet
Copy this into a spreadsheet, fill column 2 from last year’s books, and compare with the benchmark for your size band from the MAP tables above. The pass mark is the median for your band; the stretch mark is the top-performer figure.
| Line | Your number | Formula | Pass (median, your band) | Stretch (MAP top performers) |
|---|---|---|---|---|
| A. Net client fees | ____ | Gross billings minus write-downs and write-offs | Median NCF for your band (MAP table above) | $5.3M median |
| B. Equity partners/owners | ____ | Count | n/a | 3 median |
| C. Full-time professionals | ____ | Full-time professional employees | n/a | n/a |
| D. Non-owner salaries | ____ | Payroll excluding owners | 16.9% to 41.1% of A, rising with size | Higher than median is normal |
| E. Total expenses before owner pay | ____ | All costs except owner comp | 42.2% to 73.4% of A, by band | n/a |
| F. Fees per partner | ____ | A ÷ B | $747,204 at $750K to $1.5M; $1,025,000 at $1.5M to $5M | $1,664,009 |
| G. Fees per professional | ____ | A ÷ C | $208,128 overall | $259,444 |
| H. Net remaining per partner | ____ | (A minus E) ÷ B | $233,563 at $750K to $1.5M; $331,969 at $1.5M to $5M | $616,052 |
| I. Margin before owner pay | ____ | (A minus E) ÷ A | 36.9% | 38.4% |
| J. Economic margin | ____ | (A minus E minus market pay for owners’ hours) ÷ A | Positive | Above 10% |
| K. Partner billing rate | ____ | Standard hourly rate | $275 | $376 |
Benchmarks: AICPA 2025 National MAP Survey Executive Summary, fiscal 2024 medians. Line J thresholds are my own rules of thumb, not survey figures.
Worked example. Take a one-owner firm at the median of the $750K to $1.5M band per partner: $747,204 in fees and $233,563 in net remaining, so line I = 31.3%. Now price the owner’s labor at what the firm would pay a director to do it, the MAP median of $149,822 for directors with 11+ years. Economic profit = $233,563 minus $149,822 = $83,741, or 11.2% of fees. That $83,741 is the real return on owning the firm rather than working in one, and it is the number a buyer or a successor partner is really paying for.
What separates top-quartile firms from the median
The MAP data points to a short list of levers, each with a number attached:
- Billing rates. The median net hourly rate rose 6.9% over two years to $170, but top-performer partners bill $376 an hour against $275 for all firms. If you have not repriced in two years, our price increase letter templates for accountants and the proposal and pricing presentation guide cover the client-facing side.
- More billable people per partner. 5.78 professionals per equity partner at top performers, 3.00 overall. Partners at top firms log lower utilization (52.9% against 58.1%) because they delegate.
- Pricing model. Hourly billing (63% of firms) and per-form fees (40%) still dominate, but value billing reached 30% and fixed pricing 29%, and top performers’ fixed-pricing use rose 18.4% since the prior survey.
- Client selection. 56% of firms culled clients in fiscal 2024. Fewer, better-fit clients is how firms raise fees per partner without adding partners; a clear niche helps, as in how to niche and position an accounting firm.
- Service mix. CAS was the most common growth source in the Top 100, with 75 firms expanding it, per Accounting Today. If advisory is your growth bet, see how accounting firms market advisory services.
Growth itself costs money. If you are setting a budget to get from one size band to the next, start with how much accounting firms should spend on marketing and the revenue growth playbook for accounting firms. In my view, the per-partner numbers above are the right scoreboard for any growth plan: adding revenue that lowers fees per partner is usually a step backward. If you want a second pair of eyes on your own numbers against these benchmarks, you can book a consultation.
How to read these numbers without fooling yourself
- Mean vs median. Census and Accounting Today figures here are means (totals divided by counts). AICPA MAP figures are medians. Do not subtract one from the other.
- Receipts vs net client fees. Census “receipts” are total revenue. MAP “net client fees” are billings after write-downs. Accounting Today reports net revenue, except the Big Four, which report gross.
- Who counts as staff. Census employment excludes partners and proprietors who are not on payroll; Accounting Today’s total employees include partners. Revenue per employee is therefore higher in the Census data for partnership-heavy firms.
- Coverage. SUSB excludes firms with no employees; IRS Schedule C data includes them but excludes partnerships and corporations. 81% of MAP respondents had under $5 million in fees, so it describes small and mid-sized firms best.
- Years. Census: calendar 2022 (the latest Economic Census year with receipts). IRS: tax year 2023. MAP: fiscal 2024. Accounting Today Top 100: fiscal 2025.
Ready to scale your revenue?
Book a free 30-min consultation. We’ll diagnose your growth bottleneck and map out the 3 highest-leverage moves for your business.
Frequently asked questions
What is the average revenue of an accounting firm?
Census SUSB 2022 data shows 50,885 US CPA firms (NAICS 541211) with $151.1 billion in receipts, an average of $2.97 million per firm. Excluding the 88 firms with 500 or more employees, the average falls to about $1.0 million. The typical firm is smaller still: 62% of CPA firms earned under $500,000, and the AICPA MAP Survey median was $1.22 million in net client fees.
What is the average revenue per partner at a CPA firm?
The AICPA 2025 National MAP Survey reports a median of $711,784 in net client fees per partner or owner for fiscal 2024, and $1,664,009 at top-performing firms. It rises with firm size, from $747,204 at firms with $750,000 to $1.5 million in fees to $2,146,760 at firms above $10 million. The Accounting Today Top 100 averaged $4.06 million per partner.
What is the average profit margin for an accounting firm?
Measured before partner pay, the median CPA firm in the AICPA 2025 MAP Survey kept 36.9% of net client fees as net remaining, and top performers kept 38.4%. Solo CPAs filing Schedule C reported net income equal to 44.8% of receipts in tax year 2023, according to IRS data. After paying owners a market salary, the true margin is much lower.
Is owning an accounting firm profitable?
Usually, yes. Median compensation per equity partner in AICPA MAP Survey firms was $202,521 in fiscal 2024, and $508,234 at top-performing firms. The Rosenberg survey puts average income per equity partner at $615,000. At the small end, IRS data shows solo CPA offices averaged $65,773 in net income, and 18.3% of them reported no net income in 2023.
What is the typical revenue per employee for a CPA firm?
Census 2022 data shows $144,000 to $181,000 of receipts per employee for CPA firms with 5 to 99 employees, and $263,807 across all CPA firms. The AICPA MAP Survey median is $208,128 in net client fees per full-time professional, with top performers at $259,444. Accounting Today Top 100 firms averaged $253,055 per employee.
How much revenue does a small CPA firm make?
Census 2022 data shows CPA firms with fewer than 5 employees averaged $300,013 in receipts, and firms with 5 to 9 employees averaged $944,405. By revenue band, 44.1% of CPA firms earned $100,000 to $499,999 and 18.2% earned under $100,000. Solo CPAs without employees who file Schedule C averaged $146,840 in receipts in 2023.
Practice economics benchmarks