

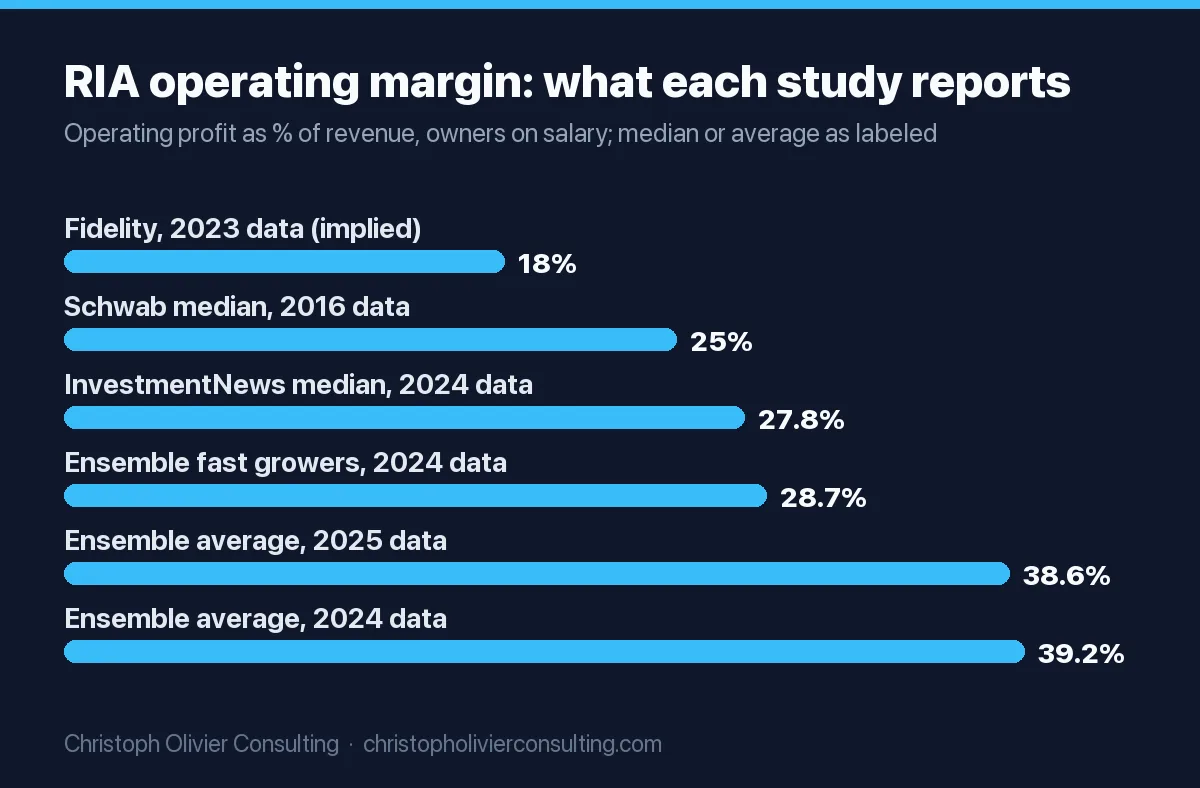
The average RIA keeps somewhere between 18 and 39 cents of operating profit from each dollar of revenue, depending on whose benchmark you read. The most recent medians and averages: InvestmentNews found a median operating margin of 27.8% for 2024, The Ensemble Practice reported an average of 38.6% for 2025, and Fidelity’s 2024 study put expenses at a record 82% of revenue in 2023, which leaves 18%. Publicly traded wealth firms report less once acquisition costs and partner pay are expensed: Silvercrest earned a 7.4% operating margin in 2025.
Short answer: A typical independent RIA runs a 25% to 30% operating margin after paying its owners a market salary for their advisory work. Earnings before owner’s compensation (EBOC) is much higher, often 50% to 70% for small firms. Below 20% usually signals an overhead or pricing problem. Above 35% is excellent, but Ensemble’s data shows the most profitable firms tend to grow the slowest.
The spread between those numbers is not noise. It comes from three choices: whether the owner’s pay is treated as an expense or as profit, whether the figure is a median or an average, and which firms answered the survey. This page puts every published figure side by side with its definition, then shows how RIA revenue is built from fee schedules and what a normal P&L looks like, so you can benchmark your own firm against the right number.
Average RIA profit margin: what each benchmark actually reports
There is no government statistic for RIA profitability. Form ADV, which every SEC-registered adviser files, reports assets, clients and fee types but not revenue or profit. Every margin figure you see comes from either a custodian or consultant survey (self-reported, voluntary samples) or a public company’s audited filings. Here is what each source says, with the exact measure it uses.
| Source | Data year | Figure | What it measures | Sample |
|---|---|---|---|---|
| Ensemble Practice, True Ensemble Growth and Profitability study (2026) | 2025 | 38.6% | Average operating profit margin | 173 firms |
| Ensemble Practice, 2025 study | 2024 | 39.2% (36.4% in 2023) | Average operating profit margin; medium firms 47.2% | Not stated in coverage |
| Ensemble Practice, 2025 study | 2024 | 28.7% vs 40.9% | Margin of the fastest growers vs slower growers | Subset of above |
| InvestmentNews Advisor Benchmarking Study 2025 | 2024 | 27.8% | Median operating profit margin; larger firms close to 29% | 77 firms |
| Fidelity RIA Benchmarking Study 2024 | 2023 | 18% (implied) | Expenses were a record 82% of revenue; a 2026 Oasis Group paper cites this as an 18% operating margin for smaller RIAs | Not stated in coverage |
| Schwab RIA Benchmarking Study 2019, via Mercer Capital | 2018 | 26.4% to 30.0% | Standardized operating margin by AUM band; $100M to $250M firms 28.9% | 1,300+ Schwab custodial clients |
| Schwab RIA Benchmarking Study 2017 | 2016 | 25% | Median operating margin (median firm AUM $593M) | Schwab custodial clients |
| Ensemble Practice, long-run series | 2015 | 24% | Average operating profit margin a decade earlier | Ensemble study firms |
Three things explain most of the gap. First, averages run above medians when a few very profitable firms sit in the sample, so Ensemble’s average and InvestmentNews’ median are not the same statistic. Second, benchmark studies typically treat an owner’s pay for advisory work as an expense, while a solo owner’s tax return does not. Third, every survey sample is self-selected: firms that track their numbers closely enough to submit them are not a random draw of the roughly 17,000 SEC-registered advisers.
The useful planning range: 25% to 30% is the middle of the market for an established firm with owners on salary, and the high 30s is the top of the market. If you are sizing a business plan, use the median, not the record.
What public RIAs report in their 10-Ks
Survey margins are self-reported. Audited numbers exist only for the handful of wealth firms that file with the SEC. Two are useful because their filings break out what independent firms normally hide: how much of revenue goes to the partners who produce it.
| Company and year | Revenue | Operating margin (GAAP) | Adjusted EBITDA margin | Partner pay as % of revenue | Operating profit plus partner pay |
|---|---|---|---|---|---|
| Silvercrest 2025 | $125.3M | 7.4% | 15.7% | 24.6% (partner incentive payments) | 32.1% |
| Silvercrest 2024 | $123.7M | 14.3% | 21.1% | 25.2% | 39.4% |
| Silvercrest 2023 | $117.4M | 16.0% | 22.9% | 26.6% | 42.7% |
| Focus Financial Partners 2022 | $2,143.3M | 13.7% | 25.1% | 24.7% (management fees to partner firm principals) | 49.8% (Adjusted EBITDA plus management fees) |
| Focus Financial Partners 2021 | $1,798.0M | 5.7% | 25.1% | 27.3% | 52.4% |
Sources: Silvercrest Asset Management Group 10-K for 2025 (revenue, income before other income, Adjusted EBITDA margin, partner incentive payments of $30.9M, $31.1M and $31.3M included in compensation) and Focus Financial Partners 10-K for 2022 (revenue, income from operations, Adjusted EBITDA of $537.5M and $451.3M, management fees of $530.3M and $491.4M). Percentages are our calculations from the reported dollar figures. Fiscal 2022 is the last 10-K Focus filed on EDGAR.
Two lessons come out of the filings. GAAP operating margins at acquisitive firms look thin because they carry costs a founder-owned RIA never has: Focus booked $261.8M of intangible amortization in 2022, 12.2% of revenue. And once you add back what the producing partners take home, both companies land in the same zone as the surveys: roughly 32% to 50% of revenue is available to the people who own and run the advice business.
Focus also published the cleanest description of RIA economics anywhere. Its 10-K walks through an illustrative partner firm with $5.0M of revenue, $2.0M of operating expenses excluding management fees, and $3.0M of “earnings before partner compensation” (EBPC), a 60% EBPC margin. Focus bought a preferred claim on 60% of that ($1.8M of “Base Earnings”) and the principals kept the rest as management fees. That structure is why aggregators quote EBPC or EBOC, not operating margin, when they price a deal.
Silvercrest is a useful reality check for a different reason: it serves ultra-high-net-worth families plus institutions, its 10-K lists a basic fee schedule of 1% on the first $10 million of an equity or balanced account and 0.60% above that, and its realized average management fee was only 0.34% in 2025. Large clients and institutional mandates pull realized fees far below the headline rate.
Operating margin vs EBOC: the definition that changes the answer
Before you compare your firm to any number above, decide which of these you are measuring. When a solo owner says the margin is 70%, that is almost always EBOC. When a headline says the industry is at 28%, that is operating margin after owner salaries.
| Measure | Formula | Who uses it | Typical range in the sources above |
|---|---|---|---|
| EBOC (earnings before owner’s compensation) | Revenue minus all expenses except what owners take home | Solo and small firm owners, valuation work | About 70% for a well-run solo in the Kitces 2026 FPA deck model; Kitces has cited top solos at 80% to 90% |
| EBPC (earnings before partner compensation) | Same idea, used by aggregators | Focus Financial and similar buyers | 60% in Focus’s illustrative example |
| Operating (standardized) margin | Revenue minus all expenses, including a market salary for owners’ advisory and management work | Schwab, Fidelity, InvestmentNews, Ensemble studies | 18% to 39% |
| Adjusted EBITDA margin | Operating profit plus depreciation, amortization and one-off items | Public companies, private equity | 15.7% to 25.1% at Silvercrest and Focus |
| GAAP operating margin | Audited operating income divided by revenue | Public companies | 5.7% to 16.0% at Silvercrest and Focus |
Kitces’ August 2026 deck lays out the conversion in one slide. A traditional firm spends about 40% of revenue on direct expenses (the advisers who serve clients), 30% on overhead and keeps 30% as profit. A solo owner who pays no other adviser shows 0% direct expense, 30% overhead and a 70% EBOC. Charge the solo a market cost for the advisory work they do themselves, about 40%, and the “real” margin drops back to 30%. The same deck notes that margins are “messy” to compare until a firm standardizes owner’s compensation, usually after the first non-founder partner joins.
Kitces explains why growth does not automatically fix a thin margin in this short video, using a reader’s firm with 65% overhead and a 35% EBOC.
How RIAs make money: fee types from 17,263 Form ADV filings
RIAs make money mainly by charging a percentage of the assets they manage. We counted the compensation boxes checked in Item 5.E of every firm in the SEC’s November 2026 registered adviser file (download). A firm can check several boxes. “Wealth RIAs” are the 9,242 firms that report at least half of their regulatory assets from individual and high-net-worth clients (Item 5.D).
| Compensation type (Form ADV Item 5.E) | All SEC-registered RIAs (17,263) | Wealth RIAs (9,242) |
|---|---|---|
| Percentage of assets under management | 95.4% | 97.8% |
| Fixed fees (other than subscription) | 45.1% | 65.7% |
| Hourly charges | 28.7% | 48.4% |
| Performance-based fees | 35.7% | 8.2% |
| Other | 13.9% | 9.2% |
| Commissions | 1.9% | 3.0% |
| Subscription fees | 1.0% | 1.1% |
| Percentage of AUM and nothing else | 17.8% | 21.1% |
| Median regulatory AUM | $414.7M | $296.8M |
| Median employees (advisory function) | 8 (5) | 6 (4) |
| Median AUM per individual and HNW client | $1.21M | $1.19M |
Source: our count from the SEC Form ADV registered adviser file dated November 2026. Performance fees are common among the private fund managers in the “all RIAs” group, which is why they drop to 8.2% for wealth firms. Checking a box does not tell you how much revenue each fee type brings in.
Revenue mix data confirms that the AUM fee dominates. In Kitces Research’s advisor productivity study, more than 90% of advisors earn at least some revenue from AUM fees, 86% say it is their primary revenue source, and 58% of teams use graduated fee schedules. Hourly, fixed and planning fees are widespread as add-ons, but they are rarely the main engine.
The AUM fee math, with breakpoints
The best public data on fee schedules is still Bob Veres’ Inside Information survey of nearly 1,000 advisors, summarized by Kitces in 2017. The median marginal fee was 1% up to $1M (almost 1.25% under $250k), 0.85% above $1M, 0.75% above $2M, 0.65% above $3M and 0.50% above $5M. Applied as a tiered schedule, that produces these annual fees:
| Client assets | Calculation (tiered) | Annual fee | Blended rate |
|---|---|---|---|
| $500,000 | $500,000 x 1.00% | $5,000 | 1.00% |
| $1,000,000 | $1,000,000 x 1.00% | $10,000 | 1.00% |
| $2,000,000 | $10,000 + ($1M x 0.85%) | $18,500 | 0.93% |
| $3,000,000 | $18,500 + ($1M x 0.75%) | $26,000 | 0.87% |
| $5,000,000 | $26,000 + ($2M x 0.65%) | $39,000 | 0.78% |
| $10,000,000 | $39,000 + ($5M x 0.50%) | $64,000 | 0.64% |
Illustrative schedule built from the 2017 median marginal rates. Your firm’s realized rate will be lower if you discount, cap fees or hold institutional assets.
The firm-wide number is lower than the schedule. Fidelity’s 2024 benchmarking study found an average revenue yield of 68 basis points in 2023, down from 71. That is the figure to use when you convert AUM into revenue for a whole firm.
Is a 1.5% fee high for a financial advisor?
As an advisory fee alone, yes. 1.5% is above the median marginal rate at every asset level in the Veres data, including the under-$250k tier where the median was close to 1.25%. As an all-in cost, no: the same survey found the median total cost (advisory fee plus fund expenses, trading and platform fees) was 1.65% for portfolios up to $1M, 1.5% above $1M and 1.2% above $5M. Ask which number the 1.5% is.
How much does the average RIA make?
Nobody publishes an audited average. You can build a defensible estimate from public data, as long as you label it as one.
- Assets. The median wealth RIA in the SEC file manages $296.8M (middle half: $157.7M to $692.8M).
- Revenue. At Fidelity’s 68 basis point revenue yield, $296.8M of AUM produces about $2.0M of revenue a year (estimate).
- Operating profit. At InvestmentNews’ 27.8% median margin, that is about $561,000 of operating profit after owners are paid a salary for their work (estimate).
- Owner take-home. Owner salary plus that profit. In the Kitces model, a firm this size pays 35% to 40% of revenue to the people who serve clients, so an owner-adviser’s total take-home can exceed the profit line by several hundred thousand dollars.
Two reference points keep the estimate honest. The median unsupported solo adviser generates just $182,500 of revenue, per Kitces Research, while supported solos reach $500,000 or more. And employees earn far less than owners: the BLS median annual wage for personal financial advisors was $105,070 in May 2025, across about 299,400 jobs. The BLS figure is wages, not business profit.
RIA revenue per advisor and average financial advisor revenue
Revenue per advisor is the productivity number that drives margin, because advisers’ pay is the biggest single cost line. Here is what the recent studies report.
| Firm type or segment | Revenue per advisor or professional | Source |
|---|---|---|
| Unsupported solo adviser (median) | $182,500 | Kitces Research, 2024 survey data |
| Teams serving clients under $250k (median) | About $180,000 | Kitces Research |
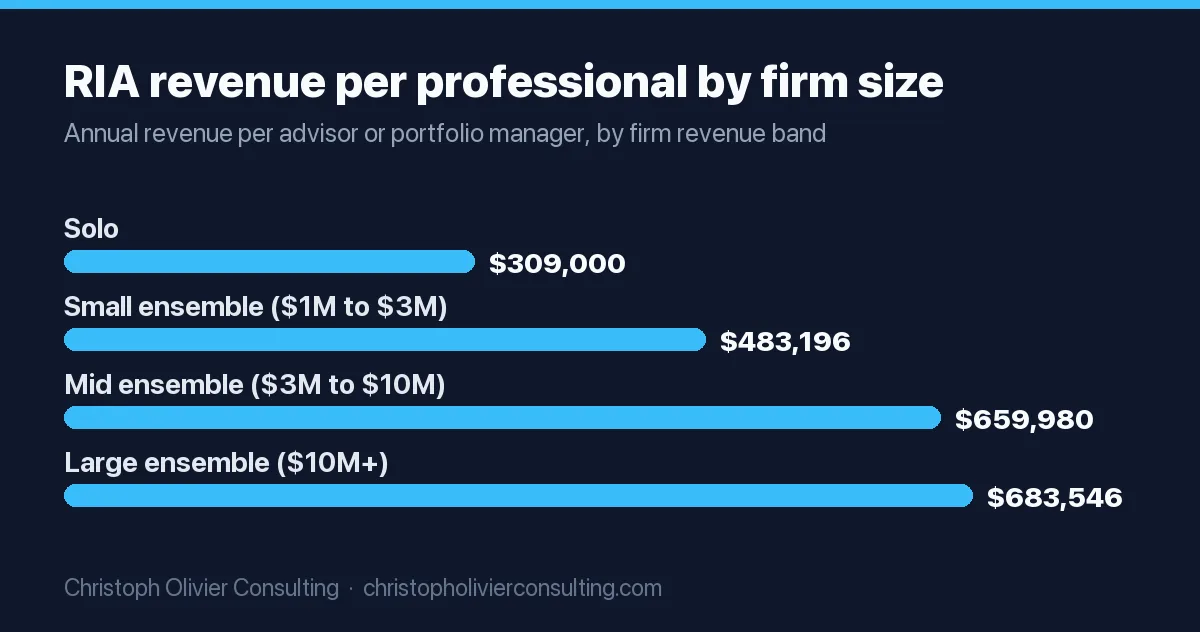
| Solo firm | $309,000 | Kitces, FPA deck, Aug 2026 |
| Small ensemble ($1M to $3M revenue) | $483,196 | Kitces, FPA deck |
| Supported solo adviser (median) | $500,000+ | Kitces Research |
| Mid ensemble ($3M to $10M revenue) | $659,980 | Kitces, FPA deck |
| Large ensemble ($10M+ revenue) | $683,546 | Kitces, FPA deck |
| All professionals, InvestmentNews sample | Above $1 million (first time) | InvestmentNews 2025 study, 2024 data |
| Teams serving clients with $5M+ (median) | $1,212,500 | Kitces Research |
| One lead adviser plus two support staff | $1,237,000 | Kitces Research |
| Relationship managers, Ensemble sample (average) | $1.28M; $459,655 per team member | Ensemble 2025 study, 2024 data |
The same Kitces deck shows why bigger firms are not simply more efficient. Revenue per client rises from $3,640 at solo firms to $13,395 at large ensembles, while clients per professional fall from 84 to 46. Larger firms earn more per adviser by serving wealthier households with more service, not by spreading one adviser across more clients. That is why margins barely move with size: Schwab’s 2018 data showed 28.9% for $100M to $250M firms and 26.4% for firms above $2.5B.
If your revenue per adviser is low, the fix is usually client mix, which is a positioning decision before it is a sales one. Our guide to choosing a profitable niche as a financial advisor covers that step, and the RIA industry statistics page has the full size distribution from the same SEC file.
Copy-ready RIA P&L model
Paste this into a spreadsheet. Column B holds your numbers, column C the benchmark from the Kitces 2026 deck (current typical firm: 35% direct expense, 40% overhead, 25% profit), column D the formula for your percentage.
| Row | Line item | Your figure (B) | Benchmark % (C) | Your % (D) |
|---|---|---|---|---|
| 1 | Gross revenue (AUM fees + planning + hourly + other, including platform fees passed through) | $ | 100% | =B1/B1 |
| 2 | Direct expense: pay for everyone who serves clients or manages money, including a market salary for owner-advisers | $ | 35% (traditional 40%) | =B2/B1 |
| 3 | Gross profit (row 1 minus row 2) | =B1-B2 | 65% | =B3/B1 |
| 4 | Overhead staff: operations, compliance, admin, marketing staff | $ | 20% | =B4/B1 |
| 5 | Overhead non-staff: rent, technology, custody and platform, compliance, insurance, marketing spend | $ | 20% | =B5/B1 |
| 6 | Operating profit (row 3 minus rows 4 and 5) | =B3-B4-B5 | 25% (traditional 30%) | =B6/B1 |
| 7 | EBOC: operating profit plus owners’ salaries from row 2 | =B6+[owner salaries] | About 70% for a solo with no other advisers | =B7/B1 |
| 8 | Revenue per adviser: row 1 divided by number of advisers | =B1/[advisers] | $309,000 to $683,546 by firm size | n/a |
| 9 | Revenue per employee: row 1 divided by total FTEs | =B1/[FTEs] | $174,500 to $380,807 by firm size | n/a |
Benchmarks from the Kitces “Is My Advisory Firm Normal?” deck, August 2026, which also shows staff costs at 55% of revenue and 73% of total costs for the typical firm. The overhead split in rows 4 and 5 follows that deck’s 20% staff overhead; the remaining 20% is non-staff.
The one judgment call is row 2. Ask what you would pay an experienced adviser to serve your clients the way you do. Put that number in, even if you pay yourself through distributions. Without it you are comparing an EBOC to other firms’ operating margins, and you will conclude you are far more profitable than you are.
Is 20% operating margin good? Is 30% too high?
Use the margin you calculated in row 6 above, with owners on a market salary, and read it against this scale.
| Operating margin (owners on salary) | What it means for an RIA | Evidence | First thing to check |
|---|---|---|---|
| Below 10% | Weak for an independent firm. Normal only for acquirers carrying amortization or a firm mid-investment. | Focus 2021 GAAP 5.7%, Silvercrest 2025 GAAP 7.4% | Overhead above 45% of revenue, or too many small clients |
| 10% to 20% | Below the industry middle. Fidelity’s implied 18% for 2023 was a record low. | Fidelity 2024 study | Revenue per client vs your minimum; fee discounts |
| 20% to 30% | Normal. The median zone for most of the past decade. | Schwab 25% (2016), 26.4% to 30.0% (2018); InvestmentNews 27.8% (2024) | Whether growth is funded: Ensemble’s fast growers ran 28.7% |
| 30% to 40% | Strong. Top half to top quartile. | Ensemble averages 36.4% (2023), 39.2% (2024), 38.6% (2025) | Organic growth: Ensemble found 3.7% new-client growth in 2025 |
| Above 40% | Excellent, or under-investing. Not “too high” in itself. | Ensemble slower growers 40.9%; medium firms 47.2% (2024) | Capacity, succession and marketing spend |
What does a 30% operating margin mean? It means $0.30 of every revenue dollar is left after paying every adviser, owner salary, staff member and bill. On $2M of revenue, that is $600,000 a year for owners’ profit distributions, reinvestment or debt service on an acquisition.
Is 10% a good operating profit margin? Across all US public companies, roughly. The NYU Stern (Damodaran) January 2026 dataset shows a pre-tax operating margin of 12.82% for 5,994 US companies, and 25.50% for 283 investment and asset management companies. For an RIA, 10% is less than half the industry middle.
Is 30% profit margin too high? Not for this industry. The concern is the trade-off, not the number. Ensemble’s 2025 study found a negative 43% correlation between profitability and growth, and its 2026 study found that profitability in one year explains 47.7% of the variation (R-squared) in organic growth the next. The same coverage reports that Ensemble firms put 2.3% of revenue into marketing staff and spend combined, while the fastest growers in the 2025 study spent 3.8% versus 2.2% for the slowest. If your margin is above 35% and new-client growth is under 5%, the gap is usually a budget decision. Our breakdown of how much a financial advisor should spend on marketing shows how to size that line, and how to measure marketing ROI for financial advisors covers proving it pays back.
Five levers that move an RIA’s margin
- Raise revenue per client before adding clients. Kitces’ deck warns that charging less than 75% of your average revenue per client loses money unless those clients are served at lower cost. Set a minimum fee that covers your team hours.
- Add the first support hire. Supported solos produce $500,000+ per adviser vs $182,500 for unsupported solos in Kitces Research. The 1+2 team (lead adviser, associate, service associate) produced the most revenue per adviser at $1,237,000.
- Protect client meeting time. Kitces Research found revenue per adviser peaks at about $775,000 when advisers spend around 40% of their week in client meetings, vs a 17% median for senior advisers.
- Do not grow your way out of high overhead. In Kitces’ 2019 analysis of InvestmentNews benchmarking data, overhead ran about 35% of revenue at $500,000, 34% at $1M, 39% at $2M and 40% at $10M and above. Fix overhead at your current size first.
- Move upmarket on purpose. Teams serving clients with $5M+ produced $1,212,500 per adviser vs about $180,000 for those serving under-$250k clients. That shift is a positioning and acquisition project. If you want to work through it for your own firm, you can book a consultation and bring your P&L.
In my view the most common mistake is benchmarking EBOC against someone else’s operating margin. Fix row 2 of the model first, then compare. The second most common is treating a 40% margin as the goal when the firm has stopped adding clients.
Ready to scale your revenue?
Book a free 30-min consultation. We’ll diagnose your growth bottleneck and map out the 3 highest-leverage moves for your business.
Frequently asked questions
What is the average RIA profit margin?
Recent studies put it between 18% and 39%. InvestmentNews found a 27.8% median operating margin for 2024, The Ensemble Practice reported a 38.6% average for 2025, and Fidelity's 2024 study implied about 18% for 2023 as expenses hit 82% of revenue. These figures pay owners a market salary first. Earnings before owner's compensation (EBOC) is much higher, often 50% to 70% at small firms.
How much does the average RIA make?
No audited average exists. A public-data estimate: the median wealth-focused RIA in the SEC's November 2026 Form ADV file manages $296.8 million. At Fidelity's 68 basis point revenue yield that is about $2.0 million of revenue, and at a 27.8% median margin about $561,000 of operating profit after owner salaries. Unsupported solo advisers have median revenue of only $182,500, per Kitces Research.
Is 20% profit margin high for an RIA?
No, it is slightly below the middle. Schwab's median was 25% for 2016, InvestmentNews' median was 27.8% for 2024, and Ensemble's averages have been above 36% since 2023. Fidelity called its implied 18% for 2023 a record low. A firm at 20% with owners on a market salary should check overhead, fee discounts and revenue per client before adding more clients.
Is 30% profit margin too high for a financial advisory firm?
No. Thirty percent is a normal to strong operating margin for an RIA and sits close to the industry median. The risk appears higher up: Ensemble found a negative 43% correlation between profitability and growth, and its fastest-growing firms ran 28.7% margins versus 40.9% for slower growers. A margin above 35% with weak new-client growth usually means the firm is under-investing in marketing or capacity.
Is a 1.5% fee high for a financial advisor?
As an advisory fee alone, yes. In the Veres survey summarized by Kitces, the median fee was 1% up to $1 million, about 1.25% under $250,000 and 0.50% above $5 million. As an all-in cost including fund expenses, trading and platform fees, 1.5% is typical: the median all-in cost was 1.65% up to $1 million and 1.5% above $1 million.
What is a good operating margin ratio for an RIA vs other businesses?
For an RIA with owners on salary, 25% to 30% is normal and above 35% is strong. For comparison, NYU Stern's January 2026 data shows a 12.82% pre-tax operating margin across 5,994 US public companies and 25.50% for 283 investment and asset management companies. A 10% margin is fine for the average company but weak for an advisory firm.
Practice economics benchmarks