
The median landing page converts at 6.6% across all industries, and the top 25% of pages convert at 11.4% or higher, according to the Unbounce Conversion Benchmark Report (41,000 landing pages, 464 million visitors, 57 million conversions). SaaS is the lowest of Unbounce’s industries at a 3.8% median; entertainment is the highest at 12.3%. For paid traffic, the median Google Ads search campaign converts 8.18% of clicks into leads and the median Facebook lead campaign converts 8.54% (WordStream by LocaliQ, 2026).
Those numbers are not interchangeable. Each publisher divides a different thing by a different thing, and some report medians while others report averages. The table below puts every major benchmark side by side with its exact definition, so you compare your rate to the right one.
Conversion rate benchmarks at a glance, with each source’s definition of “conversion”
Read the “counts as a conversion” and “divided by” columns before you read the percentage. A form fill per landing page visitor, a lead per ad click, and a qualified lead per website session are three different metrics that happen to share a name.
| Benchmark | Headline figure | Counts as a conversion | Divided by | Statistic and data period | Source type |
|---|---|---|---|---|---|
| Landing pages, all industries | 6.6% median; 11.4%+ is top quartile | Click or form conversion events on the page (sign-ups, trials, purchases) | Page visitors (Unbounce does not publish the formula; the dataset is counted in unique visitors) | Medians (some channel figures are averages), July 23, 2023 to July 23, 2024 | Unbounce, landing page platform data |
| Google Ads and Microsoft Ads search | 8.18% | Leads (calls, forms, chats, emails tracked as conversions) | Ad clicks | Median of 13,474 US campaigns, April 1, 2025 to March 31, 2026 | WordStream by LocaliQ, ad agency client data |
| Facebook lead campaigns | 8.54% | Leads from the leads objective (Lead Ads forms, messages, calls) | Ad clicks | Median of 452 US campaigns, from April 1, 2025 | WordStream by LocaliQ |
| LinkedIn Lead Gen Forms | 13% | Lead Gen Form submissions | Not stated (LinkedIn’s reporting divides conversions by clicks) | Average; sample and year not disclosed | LinkedIn, platform’s own claim |
| Whole website, 13 industries | 5.13% | “A qualified lead or sale,” including phone calls and offline sales | Sessions (formula not published) | Average, 110M+ sessions, published May 2026 | Ruler Analytics, vendor data |
| B2B website, 24 industries | 1.1% (B2B SaaS) to 7.4% (legal) | Visitor becomes a known lead | Unique website visitors | Average, January 2022 to August 2025, sample size not disclosed | First Page Sage, vendor data (SEO agency clients) |
| Your own site vs peers in GA4 | Live 25th, 50th, 75th percentiles | Whatever events you marked as key events | Sessions (session key event rate) or users (user key event rate) | Percentiles, refreshed every 24 hours, data from May 30, 2024 | Google Analytics, platform data |
The practical rule: a benchmark is only usable if your numerator, denominator and statistic match it. A median is the middle campaign or page, so roughly half of advertisers sit below it. An average gets pulled up by a few very high performers.
Landing page conversion rate benchmarks by industry
Unbounce’s figures are the most specific public landing page data: per-industry medians plus the conversion rate that puts a page in the top 25% of its industry. The data covers July 23, 2023 to July 23, 2024. Unbounce excluded industries and subcategories with fewer than 400 pages and pages with fewer than 50 visitors or zero conversions, and it assigned industries with a machine-learning topic model (methodology). Unbounce updated its summary page in July 2025 with the same 2024 data; I could not find a newer official edition, so treat any “2025” or “2026 Unbounce report” figure quoted elsewhere with suspicion until you see it on unbounce.com.
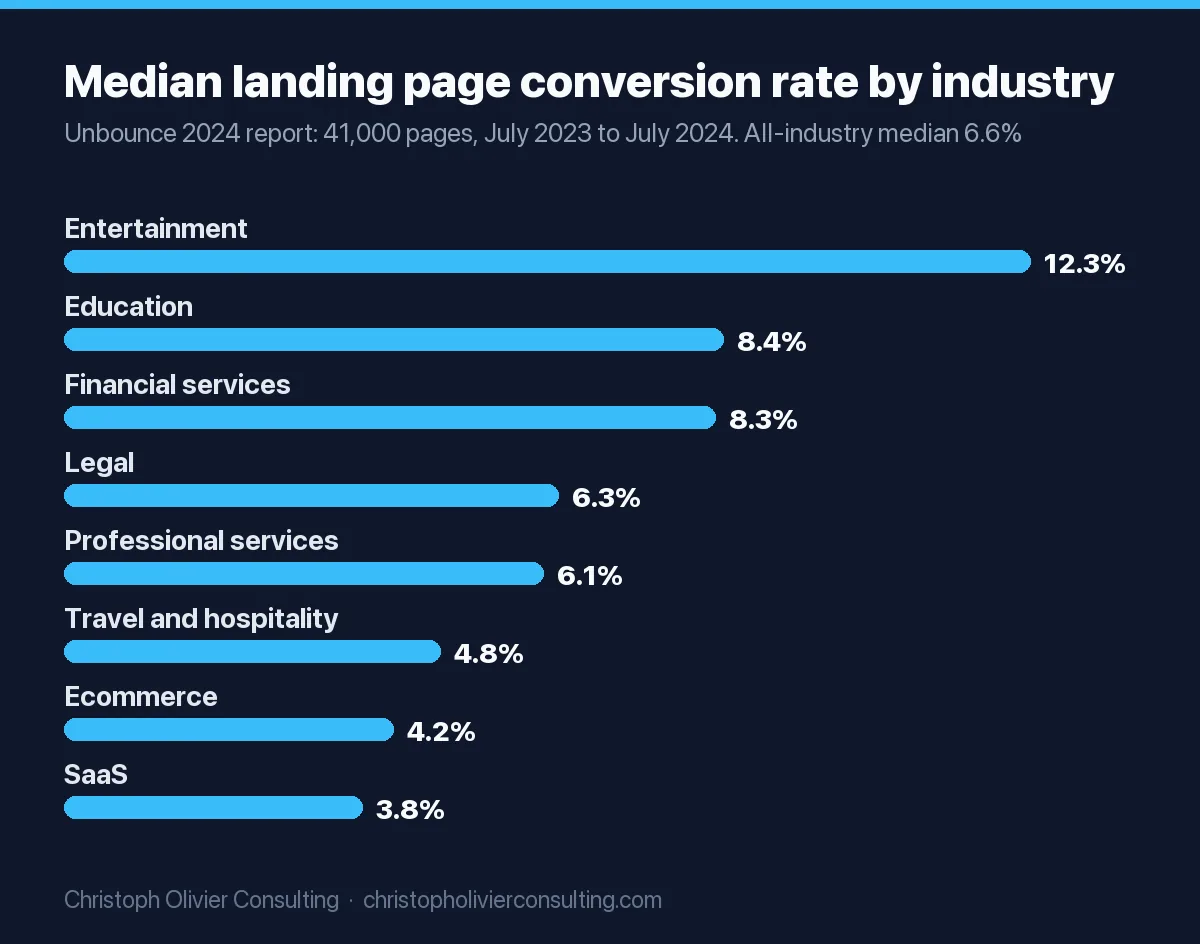
| Industry | Median landing page conversion rate | Top 25% starts at | Subcategory detail from Unbounce |
|---|---|---|---|
| All industries | 6.6% | 11.4% | 464M visitors, 41,000 pages |
| Entertainment | 12.3% | 40.8% | Sweepstakes 47.5%, publishing 9.8%, streaming media 6.8% |
| Education | 8.4% | 20% | Online courses 18.3%, higher education 6.3%, tutoring 4.9% |
| Financial services | 8.3% | 26.1% | Insurance 18.2%, investing 3.9% |
| Legal | 6.3% | 13.1% | Disability and family law 6.3%, immigration law 5.6% |
| Professional services | 6.1% | 14.1% | Repair and maintenance pages convert almost 3x home and renovation pages |
| Travel and hospitality | 4.8% | 15.6% | Transportation and travel services 14.8%, accommodations 3.7% |
| Ecommerce | 4.2% | 11.4% | Food and beverage 7.1%, fashion and beauty 1.3% |
| SaaS | 3.8% | 11.6% | Hardware 4.1%, data and infrastructure 3.3% |
Source: Unbounce, “What’s a good conversion rate?” and the professional services industry page. Unbounce also reports health and wellness as a ninth industry, but its figure appears only in a chart image, so it is left out here.
SaaS landing page conversion rate benchmarks
The SaaS median of 3.8% is 42% below the all-industry baseline, per Unbounce’s SaaS breakdown. Traffic source matters more than the industry average: SaaS pages fed by email convert at a 16.9% median, Google search ads at 5.1%, Facebook ads at 3.5% and display ads at 0.3%. So a demo page at 4% that runs mostly on paid social is doing fine; the same 4% on an email-driven page is weak. For the step after the landing page, trial to paid, see our free trial conversion framework.
Landing page conversion rates by traffic source
| Traffic source | All industries | SaaS (median) | Professional services (median) |
|---|---|---|---|
| 19.3% | 16.9% | 13.9% | |
| Paid search | 10.9% (Google 11.3%) | 4.1% (Google 5.1%, Bing 1.9%) | 7.8% |
| Paid social | 12% (Instagram 17.9%, Facebook 13%) | 2.9% (Instagram 9.2%, Facebook 3.5%) | 4.4% (Instagram 11.7%) |
| Display / YouTube | Not reported | Display 0.3% | YouTube 1.2% |
Sources: Unbounce 2024 report highlights (all-industry column, reported as averages), SaaS page and professional services page (medians). Because the all-industry column is an average and the industry columns are medians, do not compare across columns. Unbounce also notes 83% of landing page visits were on mobile and desktop converted 8% better on average; in professional services the gap was about 40% (desktop 11.6% vs mobile 8.3%).
If your page sits below its industry median, our landing page CRO checklist covers the fixes in order of impact. Unbounce’s own professional services data points to two cheap ones: pages written at a 5th to 7th grade reading level had a 12.9% median versus 6.6% for 8th to 9th grade, and 275 to 745 words produced the highest median.
Google Ads (PPC) conversion rate benchmarks by industry
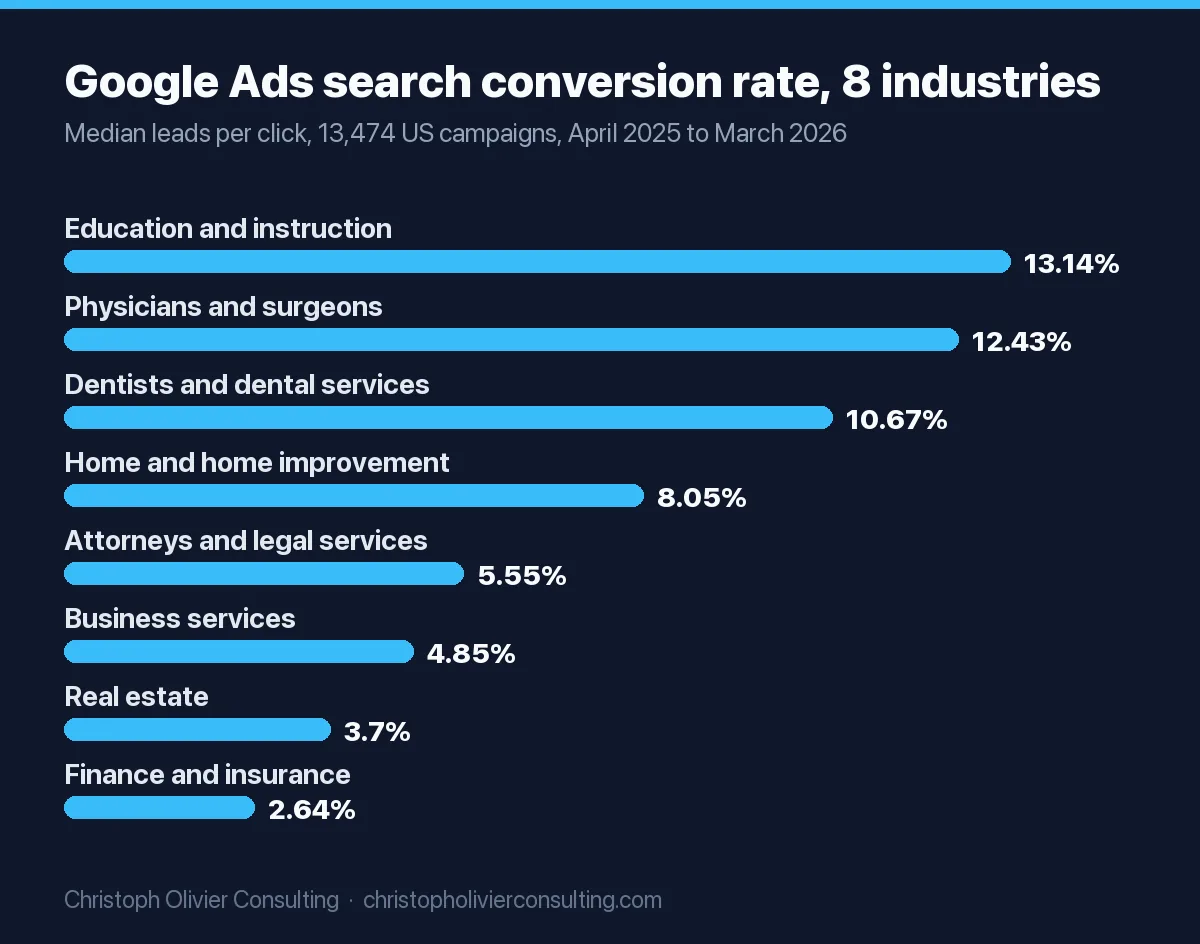
WordStream by LocaliQ analyzed 13,474 US search campaigns on Google Ads and Microsoft Ads that ran from April 1, 2025 to March 31, 2026, with at least 52 campaigns per category. Its “averages” are medians, and conversion rate is leads divided by clicks (2026 Google Ads Benchmarks). The all-industry median rose to 8.18% from 7.52% in the 2025 edition, while median cost per lead fell to $66.69, the first decline in five years.
Google Ads itself defines conversion rate as conversions divided by ad interactions that can be tracked to a conversion in the same period, and warns that if you track several conversion actions or count “Every” conversion, the rate can exceed 100% (Google Ads Help). Before you compare to the table, filter your account to primary lead actions counted as “One”.
| Industry | Median conversion rate | Median cost per lead |
|---|---|---|
| Animals and pets | 16.22% | $31.50 |
| Automotive: repair, service and parts | 15.51% | $29.96 |
| Education and instruction | 13.14% | $77.48 |
| Physicians and surgeons | 12.43% | $40.04 |
| Personal services | 12.34% | $54.60 |
| Dentists and dental services | 10.67% | $72.97 |
| Beauty and personal care | 10.35% | $39.25 |
| Industrial and commercial | 8.20% | $75.19 |
| Home and home improvement | 8.05% | $90.92 |
| Restaurants and food | 8.05% | $30.57 |
| Sports and recreation | 7.69% | $44.26 |
| Health and fitness | 6.94% | $67.36 |
| Automotive: for sale | 6.01% | $44.26 |
| Arts and entertainment | 5.91% | $26.84 |
| Travel | 5.83% | $44.70 |
| Attorneys and legal services | 5.55% | $131.63 |
| Business services | 4.85% | $93.69 |
| Apparel, fashion and jewelry | 4.50% | $97.51 |
| Shopping, collectibles and gifts | 4.01% | $49.40 |
| Real estate | 3.70% | $102.51 |
| Career and employment | 3.05% | $67.36 |
| Furniture | 2.99% | $106.70 |
| Finance and insurance | 2.64% | $74.44 |
Source: LocaliQ Search Advertising Benchmarks, updated June 2026. Attorneys pay the most per lead because they combine a below-median 5.55% conversion rate with the highest median cost per click of the 23 categories, $9.87; our Google Ads CPC by industry breakdown shows the click side.
Facebook lead ads conversion rate by industry
For Facebook campaigns using the leads objective, WordStream by LocaliQ reports a 2026 median conversion rate of 8.54%, up from 7.72% the year before, and a median cost per lead of $27.39 (LocaliQ Facebook ads benchmarks, updated September 2026). Conversion rate here is leads divided by clicks. The sample is small: 452 US lead campaigns, with as few as 4 campaigns in some categories (methodology), so read single-industry rows as rough.
| Industry | Median conversion rate | Median cost per lead |
|---|---|---|
| Education and instruction | 15.87% | $26.31 |
| Arts and entertainment | 15.31% | $14.59 |
| Real estate | 9.95% | $13.74 |
| Health and fitness | 7.98% | $27.11 |
| Sports and recreation | 6.75% | $15.49 |
| Personal services | 6.61% | $38.09 |
| Physicians and surgeons | 6.41% | $32.14 |
| Dentists and dental services | 6.07% | $61.56 |
| Furniture | 5.66% | $39.25 |
| Beauty and personal care | 5.63% | $50.91 |
| Career and employment | 5.38% | $12.30 |
| Home and home improvement | 5.32% | $42.95 |
| Industrial and commercial | 4.50% | $35.87 |
| Automotive: for sale | 4.15% | $35.52 |
Facebook’s in-platform lead form conversion and a Facebook click to your own landing page are different funnels. Unbounce’s data on Facebook traffic landing on external pages shows 3.5% for SaaS, far below the 8.54% Lead Ads median.
LinkedIn conversion rate benchmark: what LinkedIn publishes and how it counts
LinkedIn’s own marketing blog states that “the average LinkedIn Lead Gen Form conversion rate is 13%” and compares it with a 4.02% landing page average from an older Unbounce study (LinkedIn Marketing Blog, dated August 19, 2025). LinkedIn does not disclose the sample, period or industry mix behind the 13%, so treat it as a platform claim, not an audited benchmark. Most “LinkedIn benchmark” pages you will find repeat this one number.
The bigger issue is how Campaign Manager calculates your own rate. Per LinkedIn Help:
- Conversion rate is “total conversions divided by clicks.”
- Conversions include actions taken “after clicking on or seeing your ad,” so view-through conversions sit in the numerator while only clicks sit in the denominator.
- Where conversions cannot be attributed to individual users, LinkedIn “may use modeled conversions.”
- The default conversion window is 90 days after a click and 90 days after a view; you can set 1, 7, 30 or 90 days, and LinkedIn uses last-touch attribution and counts multiple conversions by one member within the window once (LinkedIn conversion window help).
So a LinkedIn “conversion rate” with a 90-day view window can look far better than a Google Ads rate that counts clicks only. To compare like for like, add the Click Conversions column in Campaign Manager and divide it by clicks yourself, and shorten the view window to match your other channels. For campaign structure and budgets, see our LinkedIn ads strategy guide.
Google Analytics benchmarks by industry (GA4 benchmarking)
GA4 has a built-in benchmarking feature that shows your metric against a peer group’s 25th percentile, median and 75th percentile. It is the only free source here built from sites like yours rather than a vendor’s customer base. What Google’s documentation (Benchmarking overview and benchmarking details) says:
- Eligibility: the “Modeling contributions & business insights” setting must be on (Admin, then Account Settings), your property must meet minimum user and data thresholds, and a peer group needs a minimum number of properties. Google does not publish the thresholds.
- Peer groups: assigned from the industry category you chose at setup plus signals like your URL. There are 25 top-level categories (for example Business & Industrial, Finance, Law & Government, Real Estate, Health) with subcategories, and you can switch your peer group.
- Conversion metrics available: session key event rate and user key event rate, alongside engagement rate, bounce rate, new user rate, ARPU and others.
- Timing: refreshed every 24 hours, available from May 30, 2024, and not shown when the date range is “today.”
- Limit: custom metrics are excluded, and benchmarks are aggregates, not competitor-level data.
The definitions decide whether the comparison is fair. Google defines session key event rate as “the number of sessions in which a key event happened / total number of sessions,” and user key event rate as users who performed a key event divided by total users (GA4 dimensions and metrics). Your peers marked their own key events. If you flag file downloads or scroll depth as key events and they flag only purchases, your rate will look inflated. Engagement benchmarks live in our bounce rate and engagement benchmarks by industry.
Build a conversion rate dashboard in GA4 in 6 steps
- Decide the one key event that equals a lead or sale (for example
generate_lead) and unmark anything that is not a business outcome. Our GA4 setup guide covers the event naming. - Open Reports, then Acquisition, then Traffic acquisition. Its default dimension is session default channel grouping, and it already shows Sessions, Key events and Session key event rate (Google’s report reference).
- In the Key events and Session key event rate columns, switch from all key events to your single lead event so the rate counts only real leads.
- Add a secondary dimension of Landing page to get a per-page rate you can hold against Unbounce’s landing page medians.
- On the Home page overview card, turn on the benchmarking badge for session key event rate and confirm the peer group category is right.
- Save the customized report to your library and review it monthly, not weekly; small monthly samples swing too much to act on (see the margin of error in the worked example below).
Average website conversion rate by industry (sitewide)
Sitewide rates blend every visit, including people reading a blog post with no intent to buy, so they run lower than landing page rates in most industries. Two vendor datasets publish them. Both are vendor data from their own customers, not neutral samples, and neither discloses the sample size by industry.
Ruler Analytics: conversion rate by industry and channel
Ruler Analytics, an attribution software vendor, reports a 5.13% average across 110 million-plus sessions in 13 industries (published May 26, 2026). Ruler counts “a qualified lead or sale,” including phone calls and offline sales from its multi-touch attribution tracking. That matters: in its data, calls are 56.3% of legal conversions and 52.6% of professional services conversions. If you do not track calls, you are comparing half your leads to all of theirs.
| Industry | All channels | Organic search | Paid search | AI referral | Social paid | |
|---|---|---|---|---|---|---|
| Automotive | 7.9% | 5.7% | 8.6% | 4.8% | 8.5% | 1.7% |
| Legal | 7.9% | 7.3% | 7.8% | 7.3% | 8.4% | 2.2% |
| Software | 7.6% | 7.9% | 8.2% | 4.0% | 7.9% | 1.7% |
| Education | 6.3% | 7.4% | 5.7% | 8.5% | 8.7% | 8.3% |
| Finance | 6.3% | 5.4% | 6.3% | 7.1% | 5.6% | 3.7% |
| Marketing and advertising | 6.2% | 5.8% | 8.9% | 4.0% | 4.7% | 0.6% |
| Professional services | 6.1% | 8.1% | 6.7% | 3.1% | 6.0% | 1.1% |
| Construction and engineering | 4.9% | 4.8% | 5.1% | 7.1% | 6.3% | 1.8% |
| Beauty and cosmetic | 3.5% | 3.2% | 4.2% | 4.1% | 5.3% | 0.2% |
| Real estate | 2.8% | 2.4% | 3.7% | 2.6% | 2.5% | 1.3% |
| Retail and ecommerce | 2.4% | 2.0% | 2.1% | 2.3% | 4.4% | 2.3% |
| Health and social care | 2.3% | 1.8% | 1.2% | 7.6% | 4.3% | 0.4% |
| Travel | 1.9% | 1.8% | 2.2% | 0.6% | 2.8% | 1.7% |
| All industries | 5.13% | 4.9% | 5.4% | 4.9% | 5.8% | 2.11% |
This is the table to use for “SEO conversion rate” and “email conversion rate” questions about a whole site: organic search converts at 4.9% and email at 4.9% on average across Ruler’s industries. Compare that with Unbounce’s 19.3% average for email traffic landing on a dedicated page. Same channel, a 4x difference, purely because one measures a focused page and the other a whole site. Ruler defines AI referral as visits from tools such as ChatGPT, Perplexity, Gemini and Claude.
B2B conversion rate by industry: First Page Sage visitor-to-lead data
First Page Sage, an SEO agency, publishes visitor-to-lead rates from its client data, January 2022 to August 2025: conversions divided by unique website visitors. It does not state the sample size. Its numbers sit well below Ruler’s because the denominator is unique visitors and the population skews to long-cycle B2B sectors.
| B2B industry | Visitor-to-lead rate | B2B industry | Visitor-to-lead rate |
|---|---|---|---|
| Legal services | 7.4% | Pharmaceutical | 1.9% |
| HVAC services | 3.1% | Financial services | 1.9% |
| Staffing and recruiting | 2.9% | Construction | 1.9% |
| Higher education | 2.8% | Biotech | 1.8% |
| Real estate | 2.7% | Solar energy | 1.8% |
| Industrial IoT | 2.6% | Commercial insurance | 1.7% |
| Oil and gas | 2.5% | Medical device | 1.6% |
| PCB design and manufacturing | 2.4% | IT and managed services | 1.5% |
| Manufacturing | 2.2% | Engineering | 1.2% |
| Addiction treatment | 2.1% | B2B SaaS and software development | 1.1% |
How to compare your conversion rate to a benchmark (worked example)
Here is the full method on one month of hypothetical numbers for a professional services firm. The figures are illustrative, not a client result; the benchmarks are the sourced ones above.
| What you measured | Your math | Your rate | Matching benchmark | Verdict |
|---|---|---|---|---|
| GA4 session key event rate, all key events | 246 converting sessions / 6,000 sessions | 4.1% | None yet: key events include PDF downloads | Not comparable |
| Same, filtered to form fills and tracked calls only | 132 / 6,000 | 2.2% | Ruler professional services, 6.1% (counts calls, qualified leads) | Well below, if your call tracking is complete |
| Google Ads search campaign, primary lead action counted “One” | 71 leads / 1,520 clicks | 4.67% | WordStream business services median, 4.85% | At median (margin of error below) |
| Landing page that receives only Google search traffic | 62 form fills / 1,400 visitors | 4.43% | Unbounce professional services, paid search median 7.8%; all-source median 6.1% | Below median |
Check the margin of error before you act. At these volumes a monthly rate is fuzzy. The 95% margin of error for a rate is 1.96 x the square root of (rate x (1 minus rate) / sample size):
- Google Ads: 1.96 x √(0.0467 x 0.9533 / 1,520) = 1.06 points, so the true rate is somewhere between 3.6% and 5.7%. The 4.85% median sits inside that range. You cannot claim you are below median.
- Landing page: 1.96 x √(0.0443 x 0.9557 / 1,400) = 1.08 points, so 3.4% to 5.5%. Both the 6.1% all-source median and the 7.8% paid search median sit above that range. This gap is real.
The conclusion for this firm: the campaign is not the problem, the page is. Fix the page (message match, shorter form, simpler copy) before raising bids, and measure it against the 14.1% top-quartile line, not just the median. If you would rather have someone run this comparison on your own GA4 and ad accounts, you can book a consultation.
Like-for-like checklist: pass all six before quoting a benchmark
| Check | Pass | Fail |
|---|---|---|
| 1. Same conversion | You count the same outcome as the source (lead, qualified lead, sale) | Your number includes downloads, newsletter sign-ups or view-through conversions the benchmark excludes |
| 2. Same denominator | Clicks vs clicks, sessions vs sessions, unique visitors vs unique visitors | GA4 user rate vs a session-based benchmark, or LinkedIn total conversions vs clicks |
| 3. Same scope | One page vs a page benchmark, whole site vs a sitewide benchmark | Sitewide 2% judged against Unbounce’s 6.6% page median |
| 4. Same statistic | Your median campaign or page vs a median | Your blended account average vs a median of campaigns |
| 5. Same traffic source | Paid search page vs paid search benchmark | An email-fed page judged against the all-source median |
| 6. Enough data | Benchmark falls outside your 95% margin of error | Benchmark falls inside it: you cannot call it above or below |
Where to get conversion rate benchmark data, ranked by what it is good for
- GA4 benchmarking: best for your own sitewide session key event rate against real peers. Free, live, but only as clean as everyone’s key event setup.
- Unbounce Conversion Benchmark Report: best for a single landing page, with industry medians, top-quartile lines and traffic-source splits. Data ends July 2024.
- WordStream by LocaliQ Google Ads and Facebook benchmarks: best for paid campaigns, with medians by 23 (search) and 14 (Facebook leads) industries and cost per lead. US campaigns only, from LocaliQ’s client base.
- Ruler Analytics: best for sitewide lead rates by channel when you track calls. Vendor data, averages, sample per industry not disclosed.
- First Page Sage: best for long-cycle B2B visitor-to-lead rates. Vendor data from agency clients, sample size not disclosed.
- LinkedIn: only a single 13% Lead Gen Form figure with no published method. Use your own click conversions per click instead.
For email-specific metrics such as open and click rates, use our email marketing benchmarks; the conversion figures above cover what happens after the click.
Frequently asked questions
What is the average landing page conversion rate across all industries?
The median landing page converts at 6.6% across all industries, based on Unbounce's analysis of 41,000 landing pages, 464 million visitors and 57 million conversions from July 2023 to July 2024. A page needs 11.4% or higher to sit in the top 25%. Medians range from 3.8% in SaaS to 12.3% in entertainment, so compare against your own industry's median.
What is a good landing page conversion rate for SaaS?
Unbounce puts the SaaS median at 3.8%, the lowest of its industries, and the top quartile starts at 11.6%. Traffic source changes the picture: SaaS pages fed by email convert at a 16.9% median, Google search ads at 5.1%, Facebook ads at 3.5% and display at 0.3%. Judge a SaaS page against the median for its main traffic source, not the overall figure.
What is the LinkedIn conversion rate benchmark?
LinkedIn's own marketing blog says the average Lead Gen Form conversion rate is 13%, but it does not publish the sample or period. Campaign Manager calculates conversion rate as total conversions divided by clicks, and total conversions include view-through conversions with a default 90-day window. Divide click conversions by clicks to compare LinkedIn fairly with other channels.
Does Google Analytics have benchmarks by industry?
Yes. GA4 benchmarking compares your metrics with a peer group's 25th percentile, median and 75th percentile across 25 industry categories, refreshed every 24 hours. It includes session key event rate and user key event rate. You must enable the Modeling contributions and business insights setting under Admin, Account Settings, and meet minimum data thresholds that Google does not publish.
What is a good email conversion rate benchmark?
It depends on what you measure. Visitors arriving from email on a dedicated landing page converted at a 19.3% average in Unbounce's 2024 data, 16.9% median for SaaS and 13.9% for professional services. Measured sitewide, email traffic converted at 4.9% on average across Ruler Analytics' 13 industries, ranging from 0.6% in travel to 8.5% in education.
What is the average PPC conversion rate?
WordStream by LocaliQ reports a median Google Ads and Microsoft Ads search conversion rate of 8.18% for 13,474 US campaigns from April 2025 to March 2026, with a $66.69 median cost per lead. It ranges from 2.64% in finance and insurance to 16.22% in animals and pets. Facebook lead campaigns converted at an 8.54% median.
What is the average B2B conversion rate by industry?
First Page Sage, an SEO agency, reports B2B visitor-to-lead rates from its client data between January 2022 and August 2025: 1.1% for B2B SaaS, 1.5% for IT and managed services, 2.2% for manufacturing and 7.4% for legal services. Ruler Analytics, counting qualified leads and calls per session, reports 6.1% for professional services and 7.6% for software.