

The demand generation statistics that matter most in 2026: 94% of B2B buying groups rank their preferred vendors before they contact anyone, and they buy from that early favorite 77% of the time (6sense 2025 Buyer Experience Report, 4,000+ buyers). Only about 5% of business buyers are in the market in a given quarter (Dawes for the LinkedIn B2B Institute). And only 29% of demand marketers run a fully integrated brand and demand program (Demand Gen Report, July 2025).
Put together, most of the demand that decides a deal is created months before a lead form or a sales call shows up in your CRM. Every number below carries its publisher, sample and fieldwork date. Vendor studies are labeled as vendor studies. Where a famous number is older or narrower than it sounds, the page says so.
Demand generation statistics: the most-cited numbers, checked
| Statistic | Figure | Source, sample and date |
|---|---|---|
| Buying groups that ranked vendors before first contact | 94%; the favorite won 77% of the time | 6sense 2025 Buyer Experience Report, 4,000+ buyers in North America, EMEA and APAC (vendor study) |
| Point in the journey when buyers first contact a seller | 61% through, down from 69% | 6sense 2025 vs earlier 6sense studies |
| Average B2B buying cycle | 10.1 months globally (11.3 in 2024); North America 11.1 | 6sense 2025, via CustomerThink’s summary |
| Buyers who prefer a rep-free buying experience | 67%, up from 61% a year earlier | Gartner, 646 buyers, Aug to Sep 2025 (released March 2026); prior wave 632 buyers, Aug to Sep 2024 |
| Buyers who avoid suppliers sending irrelevant outreach | 73% | Gartner, 632 buyers, Aug to Sep 2024 |
| People in a typical buying decision | 13 internal stakeholders plus 9 external influencers | Forrester, State of Business Buying 2026 (January 21, 2026) |
| B2B purchases that stall | 86%; 81% of buyers dissatisfied with the provider they chose | Forrester, December 4, 2024. Not repeated in the 2026 release |
| Business buyers in market | About 20% in a year, about 5% in a quarter (for a five-year purchase cycle) | Professor John Dawes, LinkedIn B2B Institute paper (PDF created May 2021). A heuristic, not a measured rate |
| Best-performing brand to activation budget split | About 46% brand, 54% activation | Binet and Field, The 5 Principles of Growth in B2B Marketing (October 2019), fewer than 50 IPA B2B cases |
| Demand teams with a fully integrated brand and demand approach | 29% | Demand Gen Report 2025 Demand Generation Benchmark Survey (July 8, 2025) |
| Buyers who said vendor content was too generic or irrelevant | 51% in 2024, up from 38% in 2023 | Demand Gen Report 2024 Content Preferences Benchmark Survey |
| Marketing budget as a share of company revenue | 7.8% in 2026 (7.7% in 2025) | Gartner CMO Spend Survey, 401 CMOs, Jan to Mar 2026, mostly $1B+ revenue |
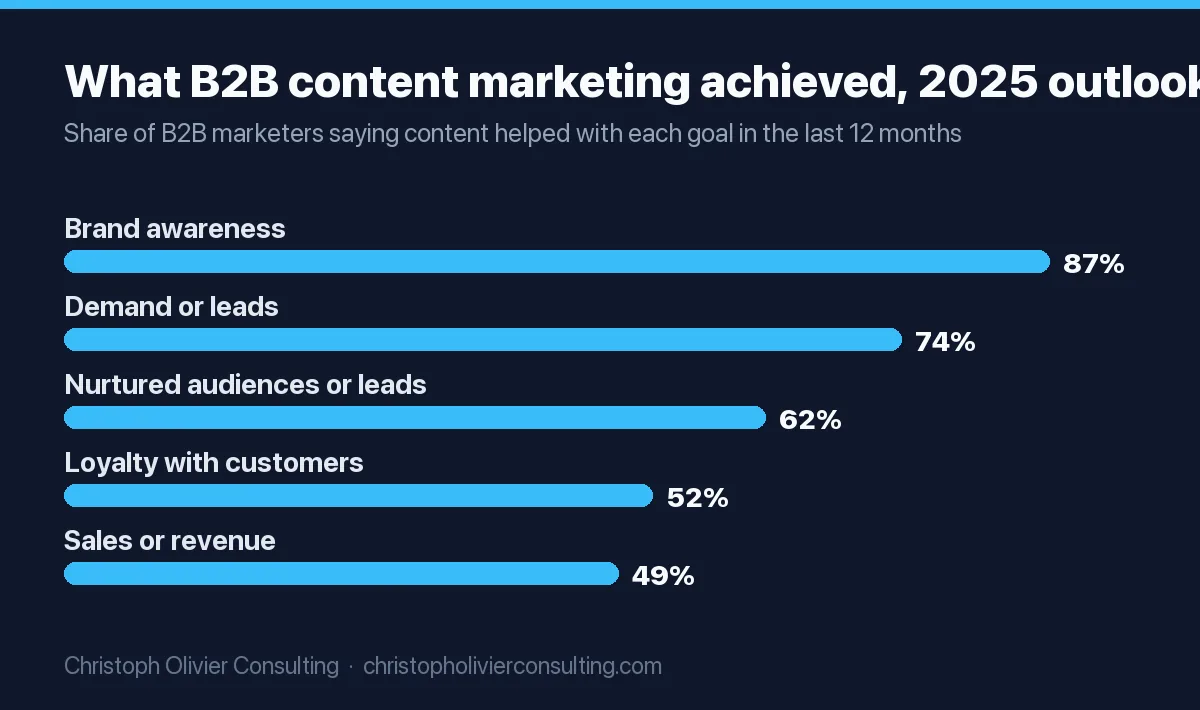
| B2B marketers who say content generated demand or leads | 74% (87% brand awareness, 49% sales or revenue) | Content Marketing Institute, 980 B2B marketers, fielded June 25 to Aug 16, 2024 |
| Touchpoints in a B2B customer journey | 88, up from 76 | Dreamdata 2026 LinkedIn Ads Benchmarks, Dreamdata customer data (vendor study, March 10, 2026) |
The buyer side of these numbers, including quota and sales cycle data, is covered in more depth on our B2B sales statistics page. The figures shared between the two pages are identical.
Demand generation vs lead generation: what each number measures
Half the confusion in demand generation data comes from mixing two different jobs. Here is how the terms are used on this page.
- Demand generation is everything that makes buyers want what you sell and remember you when they enter the market. Binet and Field describe brand activity as the work that creates demand and fills the top of the funnel, and activation as the work that converts it efficiently into revenue.
- Lead generation is the subset that captures contact details or meetings from people who are already looking. It is measurable this month. Demand creation mostly is not.
- Demand capture is paid search, review sites and inbound forms: harvesting intent that already exists. Our explainer on demand capture vs demand creation shows how to budget for each.
| If the statistic measures… | It is about | Example on this page |
|---|---|---|
| What buyers decide before contact | Demand creation | 94% rank vendors before first contact (6sense) |
| Who is in market and when | Demand creation and timing | About 5% in market per quarter (Dawes) |
| Form fills, MQLs, touchpoints to MQL | Lead generation | 71 touchpoints to an MQL (HockeyStack) |
| Return on ad spend, closed revenue by channel | Demand capture plus attribution | LinkedIn ROAS of 121% (Dreamdata) |
| Budget split between brand and activation | Both | 46% brand, 54% activation (Binet and Field) |
Demand Gen Report surveys: what the 2024 and 2025 editions actually published
Demand Gen Report (published by Emerald X) runs the best-known practitioner surveys in this field. Several searches look for specific Demand Gen Report figures, so here is what its public pages contain, edition by edition.
2025 Demand Generation Benchmark Survey (published July 8, 2025)
- 35% said their budgets increased slightly.
- 28% projected total revenue growth of 11% to 20%.
- 57% chose case studies as their top content format.
- 29% have a fully integrated approach to brand and demand marketing.
The report page lists its themes as a renewed emphasis on account-based and content marketing, a growing commitment to marketing operations, and a push for stronger revenue attribution. The public pages do not state a sample size.
Other Demand Gen Report surveys from 2025
Demand Gen Report’s 2025 year in review (December 23, 2025) lists four surveys published that year:
- 2025 ABM Benchmark Survey: 71% of practitioners use an ABM strategy and 40% integrate it directly with demand generation. Email (92%) and in-person events (72%) led the channels. Top challenges: proving ROI (47%), aligning sales and marketing (43%), scaling programs (40%). 45% see AI’s promise for personalization, but nearly 70% find its current effectiveness limited.
- AI pulse check (more than 100 respondents): 53% use AI for market research, 32% for personalization, 21% for social media management.
- Event pulse check: nearly 75% said their budget to attend in-person events increased or stayed the same; 43% planned to attend more events in 2025.
If you searched for a Demand Gen Report 2025 list of the “top 5 growth marketers on LinkedIn”: none of the four 2025 surveys, and none of the reports in its 2025 special reports roundup, is a ranking of individual marketers. The LinkedIn data in its 2025 research is about channels, not people. The 2026 Demand Generation Benchmark Survey was still collecting responses in August 2026, per MarketScale’s August 14, 2026 report, and I found no published 2026 results as of November 1, 2026.
2024 B2B Buyer Behavior Benchmark Survey
This is the latest edition of Demand Gen Report’s buyer survey that I could find. Its public summary gives two numbers: the two biggest market effects on buying habits were purchase delays due to budget freezes (34%) and a need for more hands-on attention from solution providers (26%). The rest is gated.
2024 Content Preferences Benchmark Survey
The latest Content Preferences edition I could find. Buyer behavior over the prior 12 months:
- 89% downloaded and consumed assets they found themselves.
- 72% shared content with team members; of colleagues who received it, 57% consumed it.
- 46% reviewed more content on social media.
- Most valuable formats: short-form content (67%) and webinars or digital events (65%, up from 52% in 2023). Interactive content’s appeal fell to 38% from 49%.
- 51% said content was too generic and irrelevant (38% in 2023). Another 51% said there were too many steps to access content (30% in 2023).
- Top complaints: too much content available (56%), not objective or too salesy (54%), uninformative or boring (39%).
Demand generation trends for 2026, with the data behind each
- Shortlists form earlier, and buyers reach out a little sooner. First contact moved from 69% to 61% of the journey, and 79% of buyers initiated contact themselves (6sense 2025). 58% engaged earlier because they needed to understand vendors’ AI features. If those answers are missing from your website, you lose the early conversation.
- AI answers start the research, but people still verify. Forrester’s 2026 study calls genAI searches “the starting point for B2B buyers,” with buyers then checking with colleagues and outside influencers. 6sense found 94% of buyers used LLMs, yet they still averaged 16 interactions per person with the winning vendor, unchanged from the prior year.
- Buying committees keep growing. 13 internal stakeholders plus 9 external influencers, with procurement a decision maker in 53% of cycles and more than 60% of buyers using a trial (78% for purchases of $10 million or more), per Forrester 2026. Demand programs that reach one champion miss most of the committee. Our account-based marketing statistics cover programs built for that.
- Paid search is getting more expensive, and LinkedIn’s share is growing. In Dreamdata’s customer data, LinkedIn took 41% of B2B ad budgets, non-branded search fell from 37% to 33% of budgets, and non-branded CPCs rose 29% while CTRs fell 26%.
- More of the journey happens before the pipeline. Dreamdata puts 81% of the B2B customer journey outside the sales pipeline, up from 70%. HockeyStack found touchpoints needed to create an MQL rose 31%, from 54 to 71.
- Budgets are flat, so growth comes from reallocation. Gartner’s 2026 survey has marketing at 7.8% of revenue, 56% of CMOs short of the budget for their strategy and 15.3% of budgets already going to AI. The industry breakdown is on our B2B marketing statistics page.
B2B content marketing benchmarks, budgets and trends: the CMI numbers
The Content Marketing Institute’s annual report used to be called “B2B Content Marketing Benchmarks, Budgets, and Trends.” The last edition with that title is the Outlook for 2025 (980 B2B respondents, mostly North America, fielded June 25 to August 16, 2024). The next edition was renamed B2B Content and Marketing Trends: Insights for 2026 (more than 1,000 B2B marketers, released October 8, 2025). It is the latest edition I could find.
| Finding | Outlook for 2025 | Insights for 2026 |
|---|---|---|
| Content helped generate demand or leads | 74% | Not in the public release |
| Rate content marketing extremely or very successful | 22% | Not in the public release |
| Top investment increase | n/a | 45% name AI-powered marketing tools among their top three; human resources last at 9% |
| AI use | 54% ad hoc; 19% integrated into daily workflows | 9 in 10 use AI for content; fewer than 4 in 10 say it improved performance |
| Personalization | n/a | 89% personalize; nearly 60% in only one or two channels; 85% via email |
| Thought leadership | n/a | 96% create it; in many companies fewer than 5% of employees contribute |
| Measurement | 56% struggle to attribute ROI to content; 56% struggle to track journeys | Not in the public release |
Is it normal for a marketing team our size to struggle to produce enough content?
Yes. In CMI’s Outlook for 2025, 54% of B2B marketers with a dedicated content team said it has two to five people. Lack of resources was the top non-creation challenge at 54% (58% the year before). 39% said creating enough content is a challenge, 37% struggled with repurposing, and only 26% think they have the right technology to manage content. Gartner’s 2026 survey shows the same strain at the top: 54% of CMOs report insufficient resources.
Is it worth investing in specialized demand generation content software?
The survey data says tools alone rarely fix output. CMI’s 2026 research found 9 in 10 marketers use AI to produce content, but fewer than 4 in 10 say it improved performance. Gartner found CMOs put 15.3% of budgets into AI while only 30% report mature AI readiness. My view: buy software only after you can name the bottleneck it removes (for example, briefs, repurposing or approvals) and the hours it saves each month. If you cannot name both, the money is better spent on one more experienced writer or editor.
ROI of B2B case studies: what the surveys show
No public survey reports a revenue ROI ratio for case studies, so be wary of any page that quotes one. What the data does show is consistent: practitioners rate case studies among their best formats.
- 57% of demand marketers chose case studies as their top content format (Demand Gen Report, 2025).
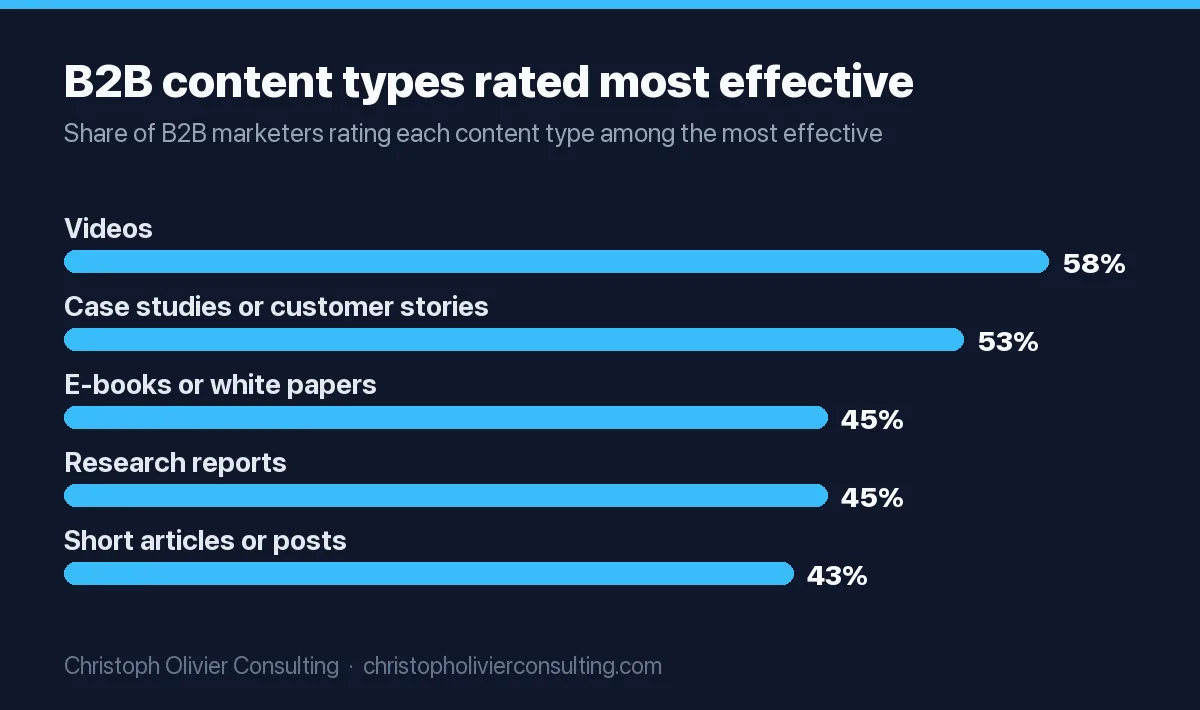
- 75% of B2B marketers used case studies or customer stories, and 53% rated them among the most effective types, second only to video at 58% (CMI Outlook for 2025). The year before, case studies ranked first.
- Case studies and e-books were named among the most effective ABM content formats (Demand Gen Report ABM Benchmark Survey, 2025).
To measure your own return, tag every opportunity where a case study was sent or viewed and compare its win rate and cycle length with deals that had none. Twenty closed deals in each group gives a first read.
The 95-5 rule and the 46/54 split, traced to the source
The 95-5 rule
The source is a paper by Professor John Dawes, Advertising effectiveness and the 95-5 rule, published by the LinkedIn B2B Institute (PDF created May 2021). The math is a worked example, not a survey: corporations change providers like their principal bank or law firm “around once every five years on average,” so about 20% of buyers are in the market in a year and about 5% in a quarter. Dawes writes: “The 95% figure is not meant to be a precise rule. We’re using it as a heuristic.”
His paper also shows the recalculation: with a two-year purchase cycle, about 50% are in market over a year and about 13% in a quarter. Use your own category’s purchase frequency, not the 95% headline.
The 46% brand, 54% activation split
Les Binet and Peter Field’s The 5 Principles of Growth in B2B Marketing (B2B Institute, October 2019) found efficiency “appears to be maximised when around 46% of the budget is allocated to brand, with around 54% allocated to activation.” Three caveats from the report itself: fewer than 50 B2B cases, a sample skewed to the UK, and cases drawn from IPA Effectiveness Awards entries, which skew toward effective campaigns. The authors say the ratio “should not be followed too precisely.” LinkedIn’s own summary page rounds it to a 50/50 split. The guidance is the same either way: about half your budget should reach the 95% who are not buying yet. Our guide to brand awareness vs demand gen turns that split into a plan.
Pipeline math: turning the buyer data into a forecast
Here is how the 95-5 rule and the 6sense shortlist data combine for one firm. The inputs in italics are assumptions you replace with your own. The arithmetic is mine.
| Step | Input or rule | Math | Result |
|---|---|---|---|
| 1. Target accounts | 400 accounts that fit your ideal customer profile | 400 | |
| 2. In market this year | Five-year purchase cycle (Dawes): 20% a year | 400 x 20% | 80 purchases |
| 3. Purchases where you make the shortlist | 1 in 4 | 80 x 25% | 20 evaluations |
| 4. Win rate when you are the pre-contact favorite | 77% (6sense 2025) | 77% | |
| 5. Win rate when you are not | The other 23% split across about 4 rivals (6sense: about five vendors evaluated) | 23% / 4 | About 5.75% |
| 6. Scenario A: favorite in 4 of 20 | 4 x 0.77 + 16 x 0.0575 | 4.0 wins | |
| 7. Scenario B: favorite in 8 of 20 | 8 x 0.77 + 12 x 0.0575 | 6.85 wins | |
| 8. Revenue at a $50,000 average deal | A: 4.0 x $50,000; B: 6.85 x $50,000 | $200,000 vs $342,500 |
Same market, same 20 shortlists, 71% more revenue, all from being the favorite more often before anyone calls you. That is the business case for demand creation. Timing matters too. A 10.1-month cycle with first contact at 61% means about 6.2 months of buyer research (10.1 x 0.61) before your CRM sees an opportunity. Work done this quarter shows up as pipeline next half year, which is why a 90-day test of demand creation tells you very little.
Two limits: the 77% is an average across 6sense’s sample, and splitting the remaining 23% evenly is a simplification. Use your own win rates by source once you have 30 or more closed deals.
B2B attribution benchmarks: Dreamdata and HockeyStack (vendor data)
Both companies sell attribution software and publish benchmarks from their customers’ data. The data is useful, but it is not a random sample of B2B companies, and they measure different customer bases. Do not compare their totals with each other.
| Metric | Figure | Source and dataset |
|---|---|---|
| Touchpoints in a B2B customer journey | 88 (up from 76) | Dreamdata 2026 LinkedIn Ads Benchmarks, 66M+ sessions and 3.5M+ journeys from Dreamdata customers |
| Share of the journey outside the sales pipeline | 81% (up from 70%) | Dreamdata 2026 |
| LinkedIn Ads return on ad spend | 121% in 2025 (113% in 2024); 279% for top-performing customers | Dreamdata, its own data-driven attribution model |
| LinkedIn share of B2B ad budgets | 41% | Dreamdata 2026 |
| First LinkedIn ad impression to revenue | 281 days | Dreamdata 2026 |
| Touchpoints and impressions to close a B2B SaaS deal | 266 touchpoints; 2,879 impressions | HockeyStack Labs, 150 B2B SaaS companies ($8M to $2B ARR, 90% North America), Jan to Aug 2024 data |
| Same, for deals of $100K+ ACV | 417 touchpoints; nearly 5,500 impressions | HockeyStack |
| Touchpoints to create an MQL | 71, up from 54 (31%) | HockeyStack, 2024 vs 2023 |
Why 88 and 266 can both be right: HockeyStack counts every interaction between stages, including organic visits, ad clicks, email opens and webinar registrations, for SaaS companies only. Dreamdata’s public post does not define its touchpoint count. Our marketing attribution statistics page covers the model choices that drive these gaps.
What demand generation agencies cost: a total cost of ownership worksheet
How much does a buyer-centric demand gen service cost for mid-market firms?
There is no independent public rate card for demand generation agencies. The ranges you will find online mostly come from agencies pricing their own category. The most neutral figure I found is Clutch’s: content marketing agencies reviewed on Clutch average $100 to $149 an hour (2026 pricing guide). For example, at 60 hours a month that works out to $6,000 to $8,940 a month in fees. At 100 hours, $10,000 to $14,900. Ad spend, tools and your own team’s time come on top.
How do demand generation agencies compare on total cost of ownership?
Compare 12-month totals, not monthly retainers. Ask each agency to fill in this worksheet in writing.
| Cost line | What to ask | Formula |
|---|---|---|
| Retainer | Hours included, and the rate for extra hours | Monthly fee x 12 |
| Setup or onboarding | One-time fee for strategy, tracking and creative setup? | One-time amount |
| Media spend | Minimum ad budget they require; do they mark it up? | Monthly media x 12 x (1 + markup %) |
| Content production | Which assets are in scope; price per extra piece | Pieces outside scope x price |
| Tools you must license | Intent data, ABM platform, attribution, automation seats | Annual licences you pay |
| Your team’s time | Hours a week they need from you for approvals and sales handoff | Hours a week x 52 x loaded hourly cost |
| Exit cost | Notice period; who owns ad accounts, data and creative | Notice months x fee, plus rebuild cost if you do not own assets |
Then divide the total by the qualified pipeline each agency commits to measuring (not leads). Two rules of thumb, both my opinion: first, the minimum contract should be long enough to see pipeline. With 6.2 months of buyer research before first contact, a 3-month exit clause judges demand creation on lead volume alone. Second, if you will never own the ad accounts and the data, add the cost of rebuilding them to the exit line. For comparison with hiring senior leadership instead, see our breakdown of fractional CMO cost in 2026. If you want a second opinion on two agency proposals, you can book a consultation.
Which number to cite
Use this when you write a deck, a board memo or a blog post. Each row gives the claim people usually make, the number to use now and the trap to avoid.
| Claim | Cite | Avoid |
|---|---|---|
| Most buyers are not ready to buy | About 5% in market per quarter for a five-year purchase cycle (Dawes, B2B Institute, 2021) | “95% of buyers” without the purchase frequency; Dawes calls it a heuristic |
| How to split brand and demand budgets | About 46% brand, 54% activation (Binet and Field, 2019, fewer than 50 IPA cases) | Presenting it as a precise law; the authors say it should not be followed too precisely |
| Buyers decide before talking to sales | 94% rank vendors before first contact; favorite wins 77% (6sense 2025) | Older “X% through the process” figures; 6sense’s newer reading is 61%, down from 69% |
| Buyers want to buy without reps | 67% prefer rep-free (Gartner, 646 buyers, Aug to Sep 2025) | Calling it “2026 data” without the fieldwork date |
| Buying groups are large | 13 internal stakeholders plus 9 external influencers (Forrester 2026) | Quoting 13 without the source; other studies define the buying group differently |
| Deals stall | 86% of purchases stall (Forrester, December 2024) | Citing it as a 2026 figure; the 2026 release does not repeat it |
| Brand and demand teams are siloed | 29% fully integrated (Demand Gen Report, 2025) | Treating 71% as “not integrated at all”; the survey measures full integration only |
| Buyers find vendor content generic | 51% in 2024, up from 38% (Demand Gen Report) | Dropping the year; this is the 2024 edition |
| B2B journeys take many touches | 88 touchpoints (Dreamdata) or 266 (HockeyStack, SaaS only) | Averaging the two; their definitions differ |
| Marketing budget benchmark | 7.8% of revenue (Gartner 2026, mostly $1B+ companies) | Applying it to a $10M firm without a size adjustment |
Three habits keep you out of trouble: put the fieldwork date next to the number, name who was asked, and say when the publisher sells to the audience it surveyed. 6sense, Dreamdata and HockeyStack all do. That does not make their data wrong. It means you say so.
Frequently asked questions
What are the most important demand generation statistics for 2026?
Start with buyer timing. 6sense's 2025 study of more than 4,000 buyers found 94% of buying groups rank vendors before first contact and buy from that favorite 77% of the time. Dawes estimates only about 5% of business buyers are in market in a quarter. Demand Gen Report found just 29% of demand teams fully integrate brand and demand. Gartner puts 2026 marketing budgets at 7.8% of revenue.
What are the biggest demand generation trends?
Shortlists form earlier: buyers first contact sellers 61% through the journey, down from 69% (6sense). GenAI search is the starting point for research, but buyers still verify with people (Forrester 2026). Buying decisions involve 13 internal stakeholders and 9 external influencers. Dreamdata data shows LinkedIn at 41% of B2B ad budgets while non-branded search costs rose 29%. Budgets are flat, so growth comes from reallocation.
What did the Demand Gen Report 2025 demand generation benchmark survey find?
The July 8, 2025 report found 35% of respondents saw budgets increase slightly, 28% projected revenue growth of 11% to 20%, 57% chose case studies as their top content format, and 29% have a fully integrated brand and demand approach. Its themes were account-based and content marketing, marketing operations and revenue attribution. The public pages do not state a sample size.
What is the 95-5 rule in B2B marketing?
It comes from Professor John Dawes in a LinkedIn B2B Institute paper. If companies switch providers such as a bank or law firm about once every five years, about 20% are in market in a year and about 5% in a quarter, so roughly 95% are not buying now. Dawes calls it a heuristic, not a precise rule. With a two-year cycle the quarterly figure is about 13%.
What is the difference between demand generation and lead generation?
Demand generation makes buyers want what you sell and remember you when they enter the market, including the roughly 95% who are not buying yet. Lead generation captures contact details or meetings from people already looking. Lead metrics such as MQLs show up this month. Demand creation shows up later: with a 10.1-month cycle and first contact at 61%, buyers research for about six months first.
How much does a demand generation agency cost?
No independent public rate card exists. Clutch reports content marketing agencies average $100 to $149 an hour in its 2026 pricing guide, so a 60-hour monthly retainer works out to roughly $6,000 to $8,940 in fees. Total cost of ownership also includes setup fees, media spend and markups, tool licences, your team's time and exit costs. Compare 12-month totals against committed pipeline, not monthly retainers.
What is the ROI of B2B case studies?
No public survey reports a revenue ROI ratio for case studies. Practitioners rate them highly: 57% of demand marketers chose case studies as their top format (Demand Gen Report, 2025), and 53% of B2B marketers rated them among the most effective content types, second to video at 58% (CMI). To measure your own return, compare win rates and cycle length for deals where a case study was used.