
Last reviewed: October 2026
US charitable donors skew older, higher income, more educated, married and religious, and there are fewer of them every year. The share of US households that give fell from about two-thirds in 2000 to 46.9% in 2020, according to the Philanthropy Panel Study, while total giving still hit a record $617.2 billion in 2025, per Giving USA 2026. Fewer donors are giving more dollars.
This page pulls the latest primary data on who gives to charity in the US, broken down by age, income, education, gender, religion, race and region. Then it translates each pattern into a marketing decision for nonprofit leaders: which channels, which asks, and where retention breaks.
What donor demographics means (and what it excludes)
Donor demographics are the age, income, education, gender, household, religious, racial and regional traits of people who give money to charities. This page covers charitable giving to nonprofits and congregations only. It does not cover blood, plasma or organ donors, and it excludes political contributions, which most surveys measure separately.
That scope matters because the phrase “donor demographics” pulls up medical research on blood donors in search results. If you market a nonprofit, you need household giving data, and the numbers you see quoted online often come from different surveys with different definitions. Before you compare any two figures, check which source produced them.
| Source | What it measures | Latest period | Headline figure |
|---|---|---|---|
| Philanthropy Panel Study (Indiana University Lilly Family School of Philanthropy) | Households giving more than $25 to religious or charitable organizations | 2020 | 46.9% of households gave |
| Gallup | Adults who gave money to a religious or other nonprofit in the past year | December 2025 | 76% of adults |
| AmeriCorps and Census Volunteering and Civic Life survey | People who gave more than $25 to a non-political group | Sept 2022 to Sept 2023 | Almost 49%, at least 121.8 million people |
| AP-NORC | Adults who donated to any charitable, religious, educational, cultural or political group | March 2025 | 73% of adults |
| Giving USA | Total dollars by source and recipient type | 2025 | $617.2 billion total, $394.2 billion from individuals |
| Fundraising Effectiveness Project (FEP) | Donor counts, dollars and retention at participating nonprofits | Q1 2026 | Donors down 0.8%, dollars up 4.3% year over year |
How many Americans give to charity?
Roughly half to three-quarters of Americans give to charity in a given year, depending on how the question is asked. Surveys that require a gift above $25 and count households land near half. Surveys that ask individuals whether they gave anything at all land closer to three-quarters. Every major series shows participation trending down.
The longest-running measure is the Philanthropy Panel Study (PPS), which follows more than 9,000 US households. Its 2021 report, The Giving Environment: Understanding Pre-Pandemic Trends in Charitable Giving, found that 66.2% of households gave in 2000 and 49.6% in 2018, the first time the rate dropped to half. The 2024 follow-up put participation at 50.9% in 2018 and 46.9% in 2020, while the average amount given rose 11.6% to $3,116.
Individual-level polls tell the same story from a higher starting point. Gallup’s December 2025 poll found 76% of adults gave money to a religious or other nonprofit in the past year, five points lower than in 2021, even as volunteering rose to 63%. The federal Volunteering and Civic Life in America survey found almost 49% of Americans gave more than $25 to a non-political group between September 2022 and 2023, a donor base of at least 121.8 million people. It also noted a small 0.4 point rise since 2021, the first uptick the survey had ever recorded.
The practical takeaway: when someone quotes “the percentage of Americans who donate,” ask whether it counts households or individuals, and whether a $25 floor applies. Both matter more than the year.
Dollars up, donors down: where the money comes from
Total giving keeps setting records while the number of donors shrinks, a pattern researchers call “dollars up, donors down.” Larger gifts from fewer, wealthier donors cover the gap left by lost small donors. For most nonprofits, that means revenue concentration risk is rising even in years when totals look healthy.
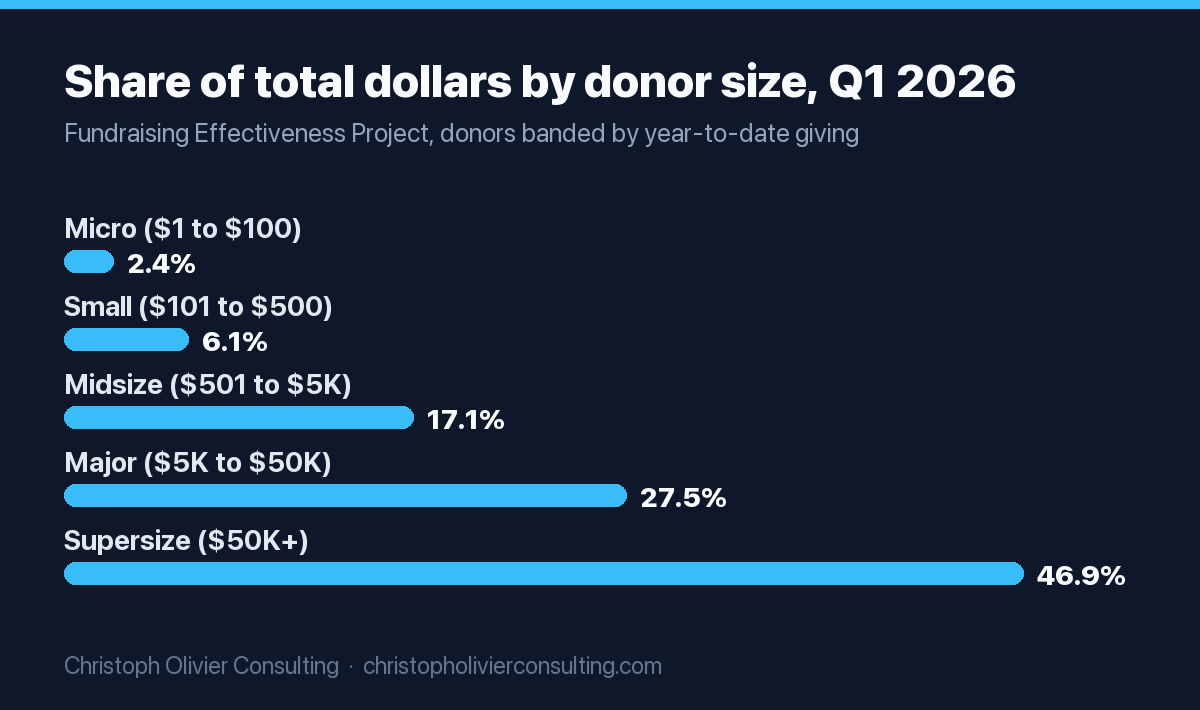
Giving USA estimates individuals gave $394.2 billion in 2025, 64% of all US giving, up 4.1% in current dollars and 1.4% after inflation. Bequests grew faster, rising 19.7% to $62.19 billion. On the donor side, the Fundraising Effectiveness Project’s 2025 year-end report found dollars grew an estimated 5.0% while donor counts fell 3.6%, a decline streak that began in 2021. Overall retention edged up to 43.3% from 43.1%, and growth was driven almost entirely by Major and Supersize donors.
The FEP’s Q1 2026 report, produced under a revised methodology, shows the decline slowing: donors fell 0.8% year over year and dollars rose 4.3%. The size breakdown shows how concentrated giving has become.
| Donor size (year-to-date giving) | Share of donors | Share of dollars | Donor count change, YoY |
|---|---|---|---|
| Micro ($1 to $100) | 57.0% | 2.4% | -2.5% |
| Small ($101 to $500) | 28.9% | 6.1% | +1.3% |
| Midsize ($501 to $5K) | 11.8% | 17.1% | +1.8% |
| Major ($5K to $50K) | 2.0% | 27.5% | +4.2% |
| Supersize ($50K+) | 0.3% | 46.9% | +3.4% |
Source: FEP donors by size and dollars by donor size, Q1 2026. Major and Supersize donors together are 2.3% of donors and 74.4% of dollars. Micro donors are the only segment still shrinking.
Donor demographics by age and generation
Older Americans are the most likely to give and give the largest share of dollars. Gallup, AP-NORC and the Philanthropy Panel Study all find giving rises with age. Younger donors still give, but they give smaller amounts, retain at lower rates and respond to different channels, so treat them as a pipeline rather than a revenue base.
Gallup reports that 2025 donations were more common among older adults. AP-NORC’s March 2025 survey found people age 60 and older were generally more likely to make charitable contributions, and the gap between adults under 60 and those 60 or older was “particularly large.” Earlier General Social Survey data analyzed by the Lilly Family School showed giving among Americans 30 or younger slipping from 84.5% in 2002 to 78.9% in 2014, a steeper drop than among older adults.
Share of dollars by generation
Generational dollar shares come mostly from vendor research, so treat them as directional. The Blackbaud Institute’s Next Generation of American Giving study (2018) found Baby Boomers gave 41% of all money donated by individuals, nearly $60 billion, while about 34 million Millennials gave 14%. A 2019 Lilly Family School report found Greatest Generation donor households contributed 8.8% of their income, compared with 0.9% for Millennial households.
Newer data on generations and retention
The Blackbaud Institute and GivingTuesday report (October 2025) gives a current snapshot of GivingTuesday donors:
- Baby Boomers were 41% of all GivingTuesday donors, with 54% retention.
- The Silent Generation had the highest retention, 58%.
- Millennials were 18% of first-time donors, with 48% retention.
- Gen Z was 7% of first-time donors, and its median gift doubled since 2019 to $50.
- Gen X’s median gift nearly doubled since 2019, to $100.
You will often see “the average donor is 64” quoted without a primary source. I could not trace that figure to a public dataset, so I would not build a plan on it. Your own CRM, appended with age data, is a better guide. For cross-channel generational behavior beyond giving, see our generational marketing statistics.
Donor demographics by income, wealth and education
Higher-income and college-educated Americans are more likely to give and give more dollars. But income explains only part of the participation decline. Indiana University researchers found that roughly a third of the drop in household giving traces to changes in income, wealth and home values. The rest reflects trust, religious attendance and other non-financial shifts.
Gallup’s 2025 data shows donations are more common among higher-income adults and those with more education. AP-NORC found people with household incomes of $50,000 or more and college graduates are generally more likely to give, and that households above $50,000 tend to donate more. Among donors, AP-NORC found 50% gave at least $101 in the past year and 3 in 10 gave $500 or more.
The 2021 Giving Environment report estimated that 36% of the decline in overall household giving rates could be explained by declines in income, wealth and home values, and 44% of the decline in secular giving. The 2019 Lilly Family School analysis found significant declines in the share of income given only among households with less than a high school education, under $50,000 in income, or under $50,000 in wealth.
The 2026 tax change that affects most donors
Starting in tax year 2026, the One Big Beautiful Bill Act created a permanent charitable deduction of $1,000 per filer for people who take the standard deduction, according to the Tax Foundation. Itemizers now face a floor: gifts below 0.5% of adjusted gross income are not deductible, and the top bracket’s itemized deductions are capped at 35 cents per dollar. The Tax Foundation estimates nearly 86% of taxpayers will take the standard deduction in 2026. For the first time in years, a tax message can reach your mid-income, non-itemizing donors. Point them to their own tax adviser rather than giving advice yourself.
Donor demographics by gender and household type
Married couples are the most likely households to give, and single women are more likely to give than single men. Philanthropy Panel Study data shows every household type gave less often in 2020 than in 2000, but the decline started later and was smaller for single women than for single men or married couples.
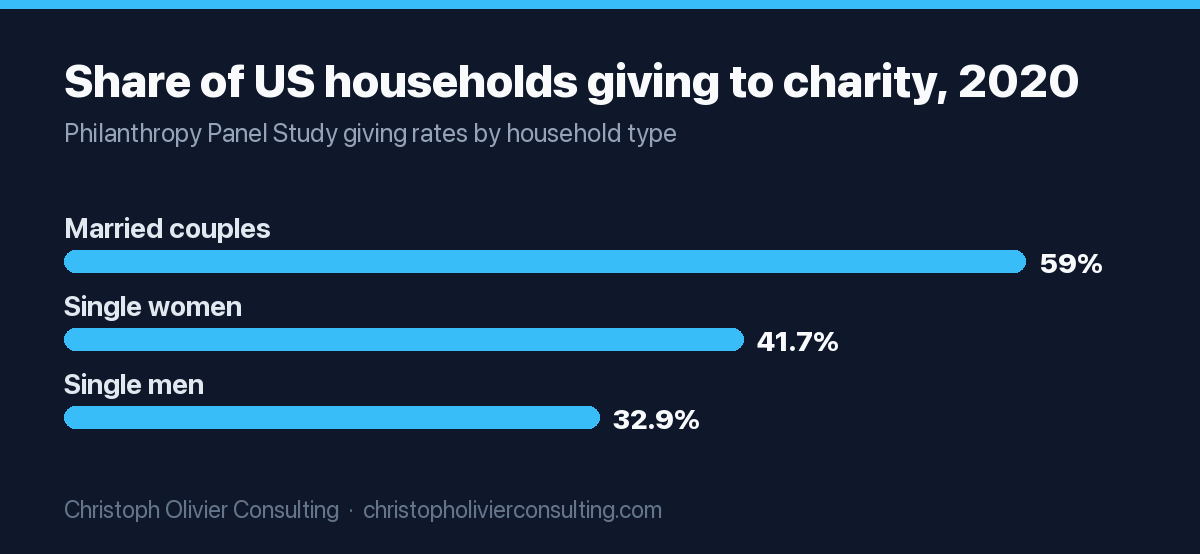
The Women’s Philanthropy Institute’s Women Give 2024 report tracked 20 years of PPS data. From 2000 to 2020, married couples’ giving rate fell from 79.1% to 59.0%, single men’s from 53.2% to 32.9%, and single women’s from 56.4% to 41.7%. Single women’s 14.7 point drop was significantly smaller than the declines for other household types.
The pandemic widened one gap. Single women who kept giving during COVID-19 donated 40.0% more on average than before the pandemic, compared with increases of 4.2% for single men and 9.1% for married couples, driven mainly by secular giving. For fundraisers, that supports building cases and stewardship that speak to women donors directly instead of defaulting to the household or the male head of household in your database.
Religion, race and region
Religious giving is falling faster than secular giving, but religion is still the largest recipient category. Giving rates declined across every racial and ethnic group the Philanthropy Panel Study tracks. Region makes surprisingly little difference: researchers found giving incidence does not vary greatly across the Northeast, Midwest, South and West.
Religion
Gallup found 41% of adults donated to a religious organization in 2025, the lowest on record and down 21 points since 2001, while 69% gave to a secular nonprofit. PPS data shows the same split over a longer span: households giving to religious causes fell from 46.5% in 2000 to 29.0% in 2018, while secular giving fell from 55.2% to 41.6%. Religion still received $151.58 billion in 2025, the largest share of any subsector in Giving USA, but it slipped 0.2% after inflation while most other categories grew.
Race and ethnicity
Between 2000 and 2018, PPS giving rates declined for Black households (48.7% to 32.8%), white households (71.2% to 57.9%), Hispanic households (44.0% to 25.5%) and households of other races (60.4% to 51.0%). These are raw summary figures that do not control for income, age or education. The same report notes that in the 1974 National Study of Philanthropy, initial differences by race nearly disappeared once age, education, marital status and income were controlled. Treat race gaps as a signal about access and outreach, not about generosity.
Region
The Giving Environment report checked three datasets and found giving incidence rates do not vary greatly by region, with no consistent regional differences in amounts. Local factors such as your cause area, community ties and donor proximity usually matter more than which part of the country your donors live in.
What the demographics mean for your marketing
Use demographics to choose channels, asks and stewardship, not to decide who deserves attention. Older donors fund today’s budget and future bequests. Younger donors are your acquisition pipeline and respond to social and engagement-first paths. Small donors need a second gift fast. The table below turns the data into decisions.
| Segment | What the data shows | Marketing move |
|---|---|---|
| Silent Generation and Boomers | Most likely to give; 58% and 54% GivingTuesday retention; bequests up 19.7% in 2025 | Personal stewardship, mail and phone, legacy and planned-gift conversations |
| Gen X | GivingTuesday median gift nearly doubled since 2019 to $100 | Mid-level upgrade paths, monthly giving asks, board and committee roles |
| Millennials | 18% of first-time GivingTuesday donors, 48% retention; 22% give through social campaigns | Strong website giving, peer-to-peer and social fundraising, monthly at first gift |
| Gen Z | 7% of first-time donors, $50 median gift; 24% give through social campaigns; twice as likely as Gen X or Millennials to give by direct mail | Volunteer and event on-ramps, creator and social campaigns, a welcome mail piece |
| Micro donors ($1 to $100) | 57.0% of donors, 2.4% of dollars, the only segment still shrinking | Second-gift conversion sequence, sustainer offer on the thank-you page |
| Non-itemizers (most households) | Nearly 86% take the standard deduction; new $1,000 per filer deduction from 2026 | Plain-language year-end messaging that the gift may now be deductible, with a “consult your tax adviser” note |
Channel data supports these moves. Bloomerang’s survey of 1,000 US donors found donation sites (42%) and nonprofit websites (41%) are the top giving channels, social campaigns drive Gen Z (24%) and Millennials (22%) far more than Gen X (9%) or Boomers (2%), and 70% of respondents have given on a recurring basis. Gen Z was also twice as likely as Boomers to give after a positive engagement with a nonprofit (20% vs. 11%).
Monthly giving is the retention lever. The M+R Benchmarks 2026 study found monthly gifts were 27% of online revenue in 2025, and 71% of sustainers were still active after a full year. Compare that with FEP’s Q1 2026 year-to-date retention by donor type: 7.1% for new donors and 25.8% for repeat donors so far in the year. Getting a first-time donor to a second gift, or onto a monthly plan, is where most files leak.
Email remains the workhorse for that second gift; check your results against our email marketing benchmarks. For younger donors who research causes on search, a Google Ad Grants account can put your mission in front of them at no media cost. The broader playbook sits in our nonprofit marketing guide.
How to build your own donor demographic profile
National data tells you the shape of the market. Your own file tells you where your revenue and risk actually sit. A useful donor demographic profile takes a few hours with a CRM export and a spreadsheet, and it should answer three questions: who gives, who stays, and which segments drive dollars.
- Export 24 months of gifts. Pull donor ID, gift date, amount, channel, recurring flag, ZIP code and any age or birth-year field.
- Band donors by annual giving. Use the FEP size bands (Micro, Small, Midsize, Major, Supersize) so you can compare your mix with the national table above.
- Calculate share of donors and share of dollars per band. If your top two bands carry far more than three-quarters of revenue, you have concentration risk.
- Split retention by new versus repeat. Retention equals donors who gave in both years divided by donors who gave last year. Run it for first-time donors and repeat donors separately.
- Append age where you can. Use data donors give you (event forms, surveys) or a reputable append service. Group into generations only once you have enough records per group to be meaningful.
- Map channel by segment. Note which channel produced each first gift and each second gift.
- Pick two moves. Choose one acquisition fix and one retention fix from the table in the previous section, and set a 90-day test.
Worked example (hypothetical numbers)
Suppose a regional nonprofit has 4,000 donors who gave $1.2 million last year. If 2,300 donors gave $100 or less and together gave $30,000, micro donors are 57.5% of donors but 2.5% of dollars, almost exactly the FEP national pattern. If 1,500 of those 4,000 were first-time donors and 300 of them gave again this year, first-year retention is 300 divided by 1,500, or 20%. The fix in that case is rarely more acquisition. It is a welcome series and a monthly-giving offer that turns more of those 1,500 into second-gift donors.
Limits of donor demographic data
Donor demographic data is useful for direction, not precision. Surveys use different thresholds, units and question wording, so figures rarely line up. The best panel data on demographics runs through 2020, vendor studies reflect their own client bases, and FEP figures cover participating nonprofits rather than every US donor.
- Thresholds differ. The PPS and Census survey count only gifts above $25, so very small donors show up as non-donors.
- Households versus individuals. Household rates run lower than individual poll results.
- Lag. The detailed PPS breakdowns stop at 2020; newer polls give direction but fewer demographic splits.
- Methodology changes. The FEP revised its methodology starting with Q1 2026, and it publishes quarterly retention on a year-to-date basis, so do not compare a Q1 figure with a full-year one.
- Correlation, not cause. Raw gaps by race, gender or region shrink once income, age and education are controlled.
In my experience, the organizations that use this data well pair one national benchmark with their own file and test one change at a time. For more sector benchmarks, see our nonprofit marketing statistics. If you want a second set of eyes on your donor file and the channel plan that follows from it, you can book a consultation.
Frequently asked questions
What percentage of Americans donate to charity?
It depends on the survey. Gallup found 76% of US adults gave money to a religious or other nonprofit in 2025. The federal Volunteering and Civic Life survey found almost 49% gave more than $25 to a non-political group in 2022 to 2023. The Philanthropy Panel Study, which counts households giving over $25, found 46.9% gave in 2020, down from about two-thirds in 2000.
Which generation gives the most to charity?
Baby Boomers give the largest share of dollars. Blackbaud Institute research from 2018 found Boomers gave 41% of all money donated by individuals, versus 14% for Millennials. Older donors also retain best: in an October 2025 Blackbaud Institute and GivingTuesday report, the Silent Generation had 58% retention and Boomers 54%, compared with 48% for Millennials. Younger donors give smaller amounts but are growing their median gifts.
Do women give more to charity than men?
Among single-headed households, yes. The Women's Philanthropy Institute's Women Give 2024 report found 41.7% of single women gave in 2020, compared with 32.9% of single men, while married couples were highest at 59.0%. Single women who gave during the pandemic also increased their average gift by 40.0%, far more than single men (4.2%) or married couples (9.1%).
Why are fewer Americans donating to charity?
Researchers point to several causes. Indiana University's Lilly Family School found only about a third of the decline in household giving rates is explained by changes in income, wealth and home values. Falling religious attendance and giving, lower interpersonal trust (especially among younger adults), and economic shocks like the Great Recession and COVID-19 also contributed. Total dollars keep rising because remaining donors give larger gifts.
What is a good donor retention rate for a nonprofit?
The Fundraising Effectiveness Project reported overall retention of 43.3% for 2025, meaning about 43 of every 100 prior-year donors gave again. Retention is much lower for first-time donors than repeat donors, so measure them separately. Monthly donors retain far better: M+R Benchmarks 2026 found 71% of sustainers were still active after one full year.
Does income determine who donates to charity?
Income matters but does not decide it. Gallup and AP-NORC both find higher-income and college-educated adults are more likely to give, and AP-NORC found households earning $50,000 or more tend to donate more. Yet giving happens at every income level, and only about a third of the long-term drop in giving participation is explained by income and wealth changes, according to Indiana University research.
More Growth Consulting guides
- Nonprofit Marketing: A Small-Budget Playbook That Wins Donors
- Insurance Agency Marketing: A Channel-by-Line Playbook
- Auto Repair Shop Marketing: The Cost-Per-Customer and LTV Math That Sets Your Priorities
- 7 Marketing Strategy Examples & Frameworks
- Inbound vs Outbound Marketing: When Each Wins
- Online Marketing Consultants: 2026 Costs, Comparisons and How to Choose
- All Growth Consulting guides →