

U.S. charitable giving totaled $617.20 billion in 2025, up 5.7% in current dollars and 3.0% after inflation, according to Giving USA 2026. The latest Fundraising Effectiveness Project report (Q2 2026) shows the same split that has defined the sector since 2021: dollars up 6.6% year to date, donors down 1.6%. Major and supersize donors now give 76.4% of all dollars while making up 2.9% of donors.
The rest of this page gives you the 2026 fundraising benchmarks by channel (email, text, ads, web, direct mail, social) and by organization size, the numbers on nonprofit marketing team size, what nonprofits actually pay per click and per donation, and a scorecard you can fill in with your own data. Every figure links to the study it comes from.
The nonprofit fundraising statistics people ask for most
If you only need one number, start here. Each row names the data period, because mixing a 2024 total with a 2026 quarterly figure is the most common error in fundraising articles.
| Question | Answer | Source and period |
|---|---|---|
| How much did Americans give to charity? | $617.20 billion | Giving USA 2026, calendar 2025 |
| How much came from individuals? | $394.2 billion, 64% of the total | Giving USA 2026, calendar 2025 |
| Are donor numbers growing? | No. Donors down 1.6%, dollars up 6.6% | FEP, year to date through Q2 2026 |
| What is the donor retention rate? | 43.3% for full year 2025 | FEP, Q4 2025 report |
| How many new donors give a second time? | 11.3% of 2025 first time donors had given again by mid 2026 | FEP, Q2 2026 |
| How fast is online giving growing? | 15% median growth (M+R); about 11% (Blackbaud) | M+R Benchmarks 2026 and Blackbaud Institute, calendar 2025 |
| What does a fundraising email raise? | $54 per 1,000 fundraising emails sent | M+R Benchmarks 2026, calendar 2025 |
| How many website visitors donate? | 1.6%, at $1.33 revenue per visitor | M+R Benchmarks 2026, calendar 2025 |
| How much online revenue arrives in December? | 37% (M+R online); about 18% of all giving (Blackbaud) | Calendar 2025 |
| How big is a nonprofit digital team? | Median of 6 people | M+R Benchmarks 2026 |
U.S. charitable giving in 2025: $617.20 billion by source and cause
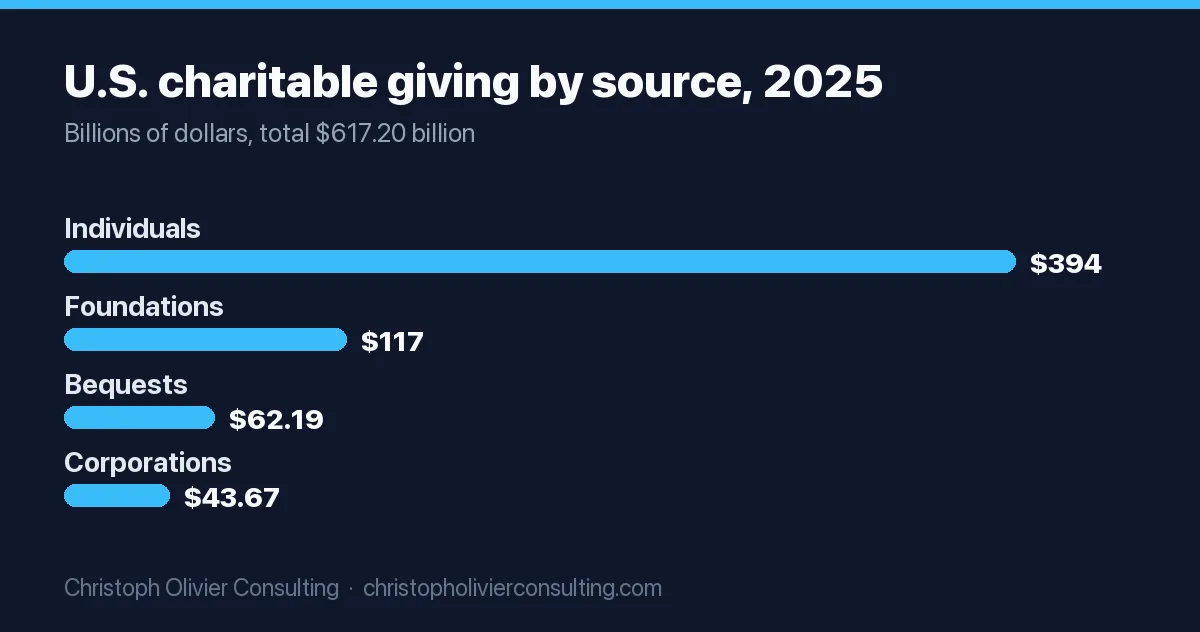
Giving USA, researched by the Indiana University Lilly Family School of Philanthropy, is the standard estimate of total U.S. giving across every channel. The 2026 edition is the first year the total passed $600 billion. Bequests were the standout, up 19.7%, while corporate giving was roughly flat after inflation.
| Source of giving | 2025 amount | Change, current dollars | Change, inflation adjusted |
|---|---|---|---|
| Individuals | $394.2 billion | +4.1% | +1.4% |
| Foundations | $117.15 billion | +5.7% | +3.0% |
| Bequests | $62.19 billion | +19.7% | +16.6% |
| Corporations | $43.67 billion | +3.1% | +0.5% |
| Total | $617.20 billion | +5.7% | +3.0% |
By recipient, religion still receives the most ($151.58 billion, +2.4%), followed by human services ($99.50 billion, +5.3%) and education ($92.01 billion, +11.7%). Public society benefit grew 11.6% to $72.06 billion, health 6.1% to $61.43 billion, arts and culture 7.5% to $27.31 billion, and environment and animals 11.0% to $24.57 billion. Gifts to foundations fell 16.2% to $79.05 billion.
Fundraising Effectiveness Project 2026: dollars up, donors down
The FEP, a project of the Association of Fundraising Professionals and GivingTuesday, tracks transaction data from donor management platforms. The Q2 2026 panel covers 17,000 organizations, 5.7 million donors and $8.1 billion. It is the best source for donor counts and retention, which Giving USA does not measure.
| FEP metric | Full year 2025 | Q1 2026 | Q2 2026 (year to date) |
|---|---|---|---|
| Dollars, year over year | +5.0% | +4.3% | +6.6% |
| Donors, year over year | −3.6% | −0.8% | −1.6% |
| Retention rate | 43.3% (from 43.1%) | 18.0% (Q1 only) | 26.4% (down 0.4 points) |
Sources: FEP Q4 2025 release (April 21, 2026), FEP Q1 2026 release (July 29, 2026), and the Q2 2026 report. Quarterly retention is year to date, so it climbs through the year toward the annual figure. Do not compare 26.4% with 43.3%.
What sits under the headline:
- Concentration. Micro donors ($1 to $100) are 51.6% of all donors and were the only size band to shrink, down 4.2% in donors and 4.4% in dollars. Major and supersize donors grew 6.4% and 6.2%.
- The second gift is the leak. Only 11.3% of donors acquired in 2025 had given again by the end of Q2 2026. Repeat donors were retained at 37.5%, and the recapture rate for lapsed donors was 1.5%.
- Frequency predicts loyalty. Donors who gave seven or more times last year were retained at 90%, against 14.4% for one time donors.
- Smaller organizations are losing donors fastest. Organizations in the $100,000 to $250,000 band lost a median 4.2% of donors.
Two cautions. FEP changed its methodology starting with the Q1 2026 report (new panel rules, late data adjustment and weighting by cause area), so 2026 figures are not strictly comparable with older FEP reports. And FEP flagged that some late 2025 giving may have been pulled forward ahead of tax changes. Beginning in 2026, taxpayers who take the standard deduction can deduct up to $1,000 in cash gifts ($2,000 for married couples filing jointly), which the FEP suggests mentioning in small donor appeals.
Nonprofit donor demographics 2026: who is actually giving
Fundraising data describes donors by behavior, not by age or income. The behavioral picture for 2026 is consistent across sources: fewer, larger, more frequent donors carry the sector.
- Major and supersize donors, FEP’s top two size bands, are 2.9% of donors and give 76.4% of dollars (FEP, Q2 2026).
- New donors produced 31% of online revenue in 2025; new donor online retention was 24% and prior donor retention 66% (M+R Benchmarks 2026).
- Monthly donors are sticky: 81% remain after seven months and 71% after one year (M+R).
- Donor advised fund revenue grew 44%, with an average DAF gift of $1,430 (M+R).
- Blackbaud’s average gift across all channels nearly doubled from $727 in 2016 to $1,346 in 2025 (Blackbaud Institute).
For the breakdown by age, generation, income, gender and religion, use our donor demographics data guide, which covers who gives in depth.
Nonprofit fundraising benchmarks 2026 by channel
The channel numbers below come from M+R Benchmarks 2026, which covers calendar 2025 for 180 participating nonprofits. M+R reports medians and warns against comparing this edition with earlier ones, because its participant pool, size bands and some metric definitions changed.
Online giving: overall growth, gift size and seasonality
- Median online revenue grew 15% in 2025 after two flat years. One time revenue grew 17% and monthly revenue 12%.
- Hunger and poverty and public media nonprofits grew about 37%, partly as donors responded to federal funding cuts. Two thirds of participants that received government funding got less in 2025 than in 2024.
- Average one time online gift: $139. Average monthly gift: $28.40. Monthly giving was 27% of online revenue.
- December produced 37% of online revenue, the last week of the year 10%, and December 31 alone 4%. Giving Tuesday revenue rose only 2%.
- Blackbaud’s wider dataset (7,500+ organizations, $66 billion) puts 2025 digital fundraising growth at about 11% and typical total revenue growth at about 4.3%, with more than 36% of revenue raised in Q4.
Email fundraising benchmarks
M+R stopped reporting open rates, which privacy features inflate. The metrics that matter are clicks, responses and revenue per send.
| Email metric (2025) | Benchmark |
|---|---|
| Fundraising email click through rate | 0.59% |
| Fundraising email response rate (gifts per recipient) | 0.05% |
| Donation page completion from a fundraising email click | 10.3% |
| Revenue per 1,000 fundraising emails | $54 (hunger and poverty $153; public media $309; cultural $19) |
| Advocacy email click through and response rate | 2.3% and 1.4% |
| Newsletter click through rate | 1.2% |
| Unsubscribe rate per fundraising email | 0.23% |
| Emails per subscriber per year | 50, of which 31 are fundraising appeals |
| Email list growth | 5%, with 19% annual churn (4% bounces, 12% unsubscribes) |
| Revenue per subscriber | $2.40 |
| Email share of online revenue | 11% |
M+R’s own illustration: one fundraising email to 100,000 people yields about 50 gifts and $5,400. For more email data across industries, see our email marketing benchmarks.
Text messaging (SMS) benchmarks
Nonprofits sent 40% more texts in 2025, and mobile revenue grew 48%, but texting still produced only 0.9% of online revenue. Fundraising texts averaged a 3.7% click through rate and a 0.17% response rate. The typical program has 176 mobile subscribers per 1,000 email subscribers and raises $0.09 by text for every $1 raised by email. Small nonprofits are the exception: texting produced 3.1% of their online revenue and $0.20 per email dollar (M+R mobile messaging).
Digital advertising benchmarks: return and cost per donation by channel
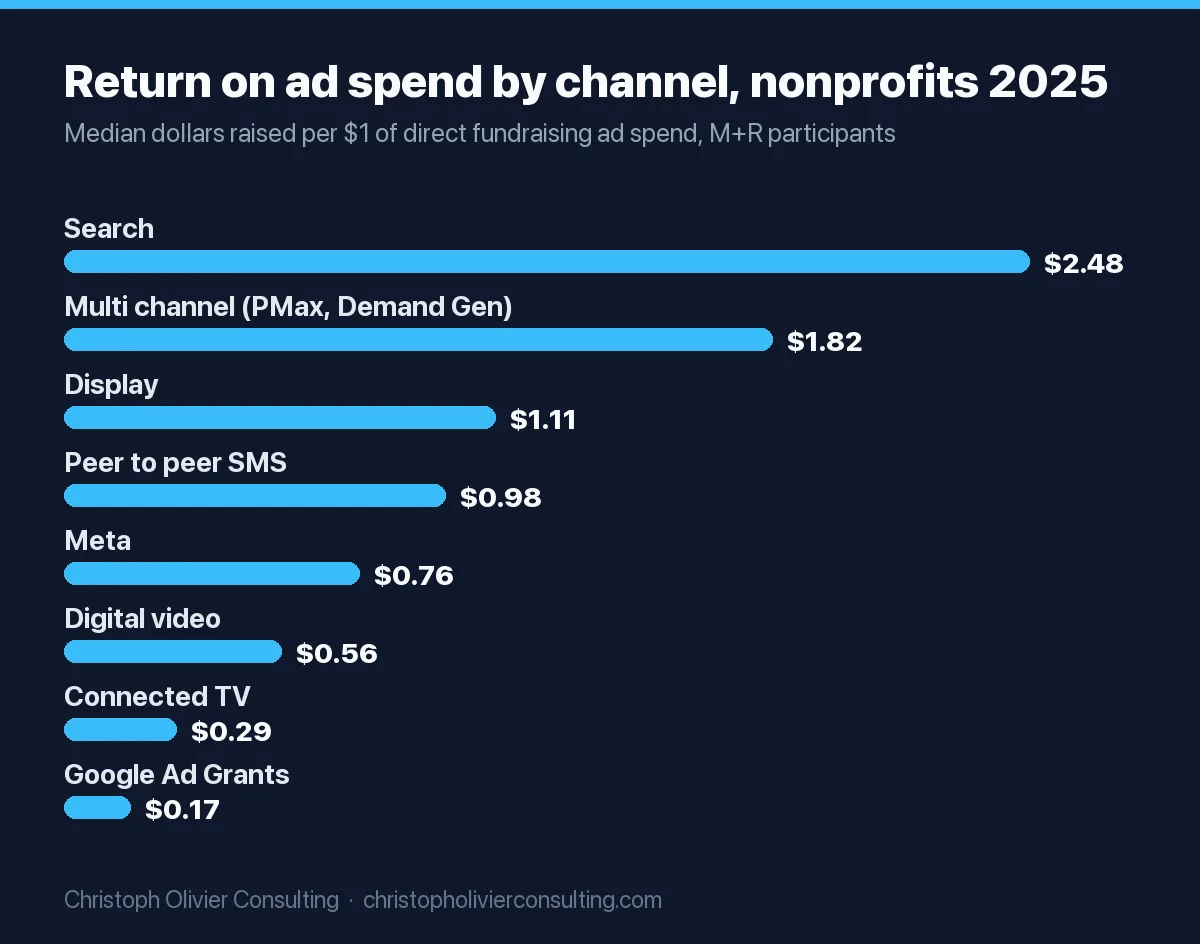
Nonprofits spent a median $0.10 on digital ads for every $1 raised online, and ad spend rose 18% in 2025. Direct fundraising took 58% of ad budgets. Search was the strongest channel for immediate return. The figures below are medians for ads aimed at direct fundraising (M+R advertising).
| Channel | Return on ad spend | Cost per donation | Change in spend, 2025 |
|---|---|---|---|
| Search (paid) | $2.48 | $69.69 | +10% |
| Multi channel (Performance Max, Demand Gen) | $1.82 | $67.38 | +131% |
| Display | $1.11 | $112.80 | −4% |
| Peer to peer SMS | $0.98 | $41.62 | +104% |
| Meta (Facebook, Instagram) | $0.76 | $74.50 | +16% |
| Digital video | $0.56 | $169.60 | −5% |
| Connected TV | $0.29 | $386.70 | +3% |
| TikTok | $0.04 | $590.30 | −19% |
| Google Ad Grants (free) | $0.17 | $793 | n/a |
Return on ad spend counts only the first gift, so a figure under $1 is not automatically a loss: donors who give again (24% of new online donors, per M+R) or convert to monthly giving add value later. For list building, Meta is cheap: a median $3.64 per lead, against $2.81 across all ad channels and $54.28 on search.
Website and donation page benchmarks
- 1.6% of website visitors donated, producing $1.33 per visitor. Hunger and poverty sites converted 3.3% of visitors at $5.58 each (M+R website performance).
- Main donation page conversion: 11% on desktop and 8% on mobile.
- Mobile delivered 52% of traffic and 43% of gifts but only 28% of revenue. The average desktop gift was $168, the average mobile gift $88.
- Organic search brought 39% of site visits, and M+R reports the organic share fell month by month through 2025.
- Payment options on donation pages: PayPal 79%, bank transfer 79%, Google Pay 58%, Apple Pay 57%, DAF giving 46%, Venmo 44%.
Compare with commercial sites in our conversion rate benchmarks.
Direct mail benchmarks
Mail still raises two thirds as much as every online channel combined: participants raised $0.66 by mail for every $1 raised online. The average mail gift was $120, mail revenue grew 9%, and active donor mailings returned $4.51 per $1 spent at $21 per donation. Lapsed donor mailings returned $0.90 and prospect (acquisition) mailings $0.41, at $121.50 per donation (M+R direct mail).
Social media benchmarks for nonprofits
Almost every M+R participant is on Facebook (98%) and Instagram (97%), followed by LinkedIn (90%), YouTube (74%), X (54%), TikTok (43%), Bluesky (37%) and Threads (32%). Follower growth in 2025: TikTok +34%, LinkedIn +21%, Instagram +14%, Facebook +3%, X −3%. 58% of participants worked with influencers (M+R social media).
For engagement, the Rival IQ 2025 Social Media Industry Benchmark Report measured 2024 posts from 150 randomly selected nonprofits (national and international, not U.S. only), as median engagements per post divided by followers:
| Platform (2024 data) | Nonprofit engagement rate per post | All industry median | Nonprofit posts per week |
|---|---|---|---|
| 0.046% | 0.046% | 5.51 | |
| 0.561% | 0.36% | 4.18 | |
| TikTok | 3.04% | 1.73% | 1.42 |
| X (Twitter) | 0.023% | 0.015% | 5.68 |
Rival IQ found photos drove the most Facebook engagement for nonprofits and carousels the most on Instagram. More platform data is in our social media marketing statistics.
Nonprofit fundraising benchmarks by organization size
Large nonprofits do invest more in outreach in absolute terms, with bigger teams and full agency support, but not always as a share of revenue: small participants spend more per dollar raised on ads than medium or large ones. M+R sizes organizations by annual online revenue, so its “small” group still raises up to $1 million online.
| M+R 2026 metric (2025 data) | Small (<$1M online) | Medium ($1M to $5M) | Large ($5M to $10M) | Extra large (>$10M) |
|---|---|---|---|---|
| Online revenue growth (median) | 14.5% | 16.2% | 19.7% | 13.8% |
| Monthly giving share of online revenue | 22% | 26% | 29% | 37% |
| Average one time gift | $145 | $148 | $135 | $116 |
| Email share of online revenue | 13.6% | 13.8% | 12.0% | 8.1% |
| Text share of online revenue | 3.1% | 0.5% | 1.6% | 0.5% |
| Ad spend per $1 raised online (median) | $0.15 | $0.05 | $0.07 | $0.19 |
| Share of ad budget on direct fundraising | 38% | 64% | 78% | 75% |
| Share of ad budget on brand awareness | 37% | 17% | 11% | 14% |
| Main donation page conversion | 5.8% | 8.5% | 9.8% | 11.6% |
| Mobile donation page conversion | 4.0% | 8.5% | 11.5% | 8.2% |
| Average direct mail gift | $163 | $119 | $112 | $95 |
| Digital team size (median) | 5 | 6 | 9 | 13 |
| Work with a digital agency | 62% | 75% | 81% | 100% |
| Google Ad Grants cost per donation | $2,765 | $610 | $305 | $520 |
Blackbaud uses total annual revenue instead and shows a sharper size gap for 2025: large organizations ($10 million and up) grew about 11.7%, midsize ($1 million to $10 million) about 2%, and small (under $1 million) fell about 6.4%. Large organizations got 84.5% of revenue from major gifts, small ones 51.7%.
Average marketing department size at a nonprofit
The best current figure is M+R’s: the median nonprofit digital team (fundraising, marketing, advocacy and content staff doing digital work) is 6 people, with a middle range of 4 to 12. By size, the median is 5 at small participants, 6 at medium, 9 at large and 13 at extra large (middle range 7 to 33). By sector, cultural organizations run the largest teams (median 15) and hunger and poverty and public media the smallest (4). In 2025, 48% of teams stayed the same size, 29% grew and 23% shrank (M+R, The Big Story).
Remember who M+R measures: mostly larger organizations, where even the small band runs up to $1 million in online revenue. Most of the sector is far smaller. The Nonprofit Marketing Guide, which surveys communications staff every year, found that communications effectiveness rises sharply once a team reaches three full time equivalents (its 2019 Trends Report). In my view that three person mark is the practical target for a sub $5 million nonprofit: one strategist, one content producer and one person owning email, ads and data, often with agency or fractional marketing help instead of a fourth hire.
Non-profit organizations average CPC in 2026, and what nonprofits really pay per donation
No major paid search benchmark publishes a nonprofit category. LocaliQ’s 2026 Search Advertising Benchmarks put the all industry average cost per click at $5.42, with a 6.64% click through rate. The closest categories to nonprofit causes are Arts and Entertainment ($1.63 CPC) and Animals and Pets ($4.06). Our Google Ads CPC by industry page has the full table.
For nonprofits, cost per donation is the more useful number. M+R’s median paid search cost per donation was $69.69, with $2.48 back per $1 spent.
Google Ad Grants rules in 2026
Google offers eligible nonprofits up to $10,000 per month in search ads. The Ad Grants account management policy requires:
- A 5% click through rate each month, measured at the account level. Miss it two months in a row and the account is temporarily deactivated.
- Conversion based Smart Bidding (Maximize conversions, Maximize conversion value, Target CPA or Target ROAS) for accounts created on or after April 22, 2019, unless using Smart campaigns.
- Valid conversion tracking with at least one conversion recorded per month.
- At least two unique sitelink assets and geotargeting that matches where you actually serve.
- Responses to Google’s periodic program surveys.
The math on what the grant delivers: M+R participants got 229 site visits per $1,000 of grant spend, about $4.37 of grant budget per visit. At the median $793 cost per donation, a fully spent $10,000 month buys roughly 13 donations. For small participants the cost per donation was $2,765, or 3 to 4 donations a month. Ad Grants is a traffic and awareness program first. Our Google Ad Grants guide covers setup.
How important is checkout speed for nonprofit fundraising?
M+R now measures Google PageSpeed Speed Index on donation pages. The median donation page scored 2.9 seconds on desktop and 11.7 seconds on mobile, against 2.0 and 8.6 seconds for home pages. Medium participants had the slowest mobile donation pages (14.3 seconds). The same study shows mobile donation pages converting at 8% against 11% on desktop, and just 4% for small nonprofits. M+R does not claim speed causes the gap, but the FEP’s Q2 2026 advice is direct: test your donation form on a phone, because a slow or confusing form loses the donors with the least patience.
Score your program: a 2026 nonprofit benchmark scorecard
Pull last calendar year’s numbers from your CRM, email platform and analytics, then compare each to the benchmark. Use the size column above if you fall into an M+R band. If your online revenue is far below $1 million, treat these as direction, not pass or fail.
| Metric | How to calculate it | 2026 benchmark | Investigate if |
|---|---|---|---|
| Online revenue growth | (2025 online revenue / 2024 online revenue) − 1 | 15% median; 25% of participants grew under 3.5% | Below 3.5% |
| Donor count change | Unique donors this year / last year − 1 | −1.6% (FEP) | Falling faster than 2% |
| First year donor repeat rate | Last year’s new donors who gave again / all last year’s new donors | 24% online (M+R) | Below 20% |
| Monthly giving share | Recurring online revenue / total online revenue | 27% (22% small) | Below 15% |
| Revenue per 1,000 fundraising emails | Email revenue / fundraising emails delivered × 1,000 | $54 | Below $35 |
| Fundraising emails per subscriber | Fundraising sends / average list size | 31 a year | Fewer than 15 |
| Main donation page conversion | Completed gifts / donation page sessions | 8.4% (5.8% small) | Mobile under 5% |
| Ad spend per $1 raised online | Digital ad spend / online revenue | $0.10 median | No spend, or ROAS not tracked |
| December share of online revenue | December online revenue / annual online revenue | 37% | Above 50% (over reliance) or below 25% |
The “investigate if” thresholds are my rules of thumb, built from the published medians and quartiles, not from M+R or FEP. They flag where to look first, not a verdict.
Worked example. A nonprofit with a 20,000 person email list sends 31 fundraising emails per subscriber a year, or 620,000 fundraising sends. At the $54 benchmark that should produce about $33,480 (620,000 / 1,000 × $54). If the program actually raised $18,600, it is earning $30 per 1,000 sends, 44% under the benchmark. Before sending more, check donation page conversion from email clicks against the 10.3% benchmark and list churn against 19%. Sending more email to a list that does not convert usually raises unsubscribes faster than revenue.
If you want a second pair of eyes on your scorecard, you can book a consultation. For the strategy side, our small budget nonprofit marketing playbook turns these benchmarks into a channel plan.
How to read these numbers without fooling yourself
- Giving USA is an estimate for all U.S. giving and is revised in later editions. Cite it as “Giving USA 2026, 2025 giving.”
- FEP is a panel of about 17,000 organizations using participating software, weighted by cause area. It is not a random sample, it applies a $25 million ceiling to limit the pull of very large organizations, and it misses DAF, crowdfunding and payment app giving.
- M+R covers 180 mostly larger nonprofits, reports medians, and says not to compare its 2026 edition with earlier ones.
- Blackbaud Institute covers 7,500+ organizations on Blackbaud software and sizes them by total revenue, so its size bands do not match M+R’s.
- Rival IQ samples organizations with 25,000 to 1,000,000 Facebook fans, so small local nonprofits are not represented.
Frequently asked questions
What are the key nonprofit fundraising statistics for 2026?
U.S. charitable giving reached $617.20 billion in 2025, up 5.7%, per Giving USA 2026. Individuals gave $394.2 billion, 64% of the total. The Fundraising Effectiveness Project's Q2 2026 report shows dollars up 6.6% year to date while donors fell 1.6%, and major and supersize donors supply 76.4% of dollars while making up 2.9% of donors.
What are the nonprofit fundraising benchmarks for 2026?
M+R Benchmarks 2026, covering 2025, reports median online revenue growth of 15%, $54 raised per 1,000 fundraising emails, a 0.59% fundraising email click rate, 1.6% of website visitors donating, donation page conversion of 11% on desktop and 8% on mobile, and $0.10 spent on digital ads per $1 raised online. December produced 37% of online revenue.
What is the nonprofit donor retention rate?
The Fundraising Effectiveness Project reported overall donor retention of 43.3% for full year 2025, up from 43.1%. First year donors are the weak point: only 11.3% of donors acquired in 2025 had given again by the end of Q2 2026. M+R's 2026 study puts new online donor retention at 24% and prior donor retention at 66%.
What is the average marketing department size at a nonprofit?
M+R Benchmarks 2026 puts the median nonprofit digital team at 6 people, ranging from a median of 5 at organizations raising under $1 million online to 13 at those raising over $10 million. M+R participants are mostly larger nonprofits. The Nonprofit Marketing Guide found communications effectiveness rises sharply once a team reaches three full time staff.
What is the average CPC for non-profit organizations in 2026?
No major benchmark publishes a nonprofit CPC. LocaliQ's 2026 benchmarks put the all industry average at $5.42, with Arts and Entertainment at $1.63. For nonprofits, cost per donation is more useful: M+R found a median $69.69 per donation from paid search and $793 from Google Ad Grants, which delivered about 229 visits per $1,000 of grant spend.
How much does Google Ad Grants give nonprofits?
Google Ad Grants gives eligible nonprofits up to $10,000 per month in search ads on Google.com. Accounts must keep a 5% account level click through rate (two missed months triggers temporary deactivation), use conversion based Smart Bidding, record at least one conversion a month, run at least two sitelinks, and answer Google's program surveys.
Do large nonprofits invest more in outreach than smaller organizations?
In absolute terms, yes. M+R 2026 shows median digital teams of 13 at extra large participants versus 5 at small ones, and 100% versus 62% agency use. As a share of revenue it is mixed: small participants spent $0.15 on ads per $1 raised online, medium $0.05, large $0.07 and extra large $0.19.
Business & economy data