

Emerging sports league team sponsorship rates are still a fraction of big-league rates. NWSL teams averaged about $170,000 per sponsorship deal in 2024 ($75 million across the league), and WNBA teams averaged $6.3 million in total sponsorship revenue per team. Compare that with $731,000 per deal for NBA teams and $529,000 for NHL teams in 2025-26. Newer properties such as the PWHL, Unrivaled and Major League Pickleball do not publish rates. What they do publish is partner counts and growth: 81 PWHL partners (up 35%), and MLP sponsor revenue more than doubled in 2025.
Every figure below names its publisher and date, and links to the page it came from. Definitions matter in sponsorship data. Some sources count only the rights fees brands pay properties, some count team-level deals only, and others model the whole sports industry. Where two numbers look like they conflict, it is almost always a definition difference, so each one is labeled. Anything measured before 2023 is marked historical.
Emerging sports league team sponsorship rates, 2024 to 2026
This table puts the leagues people ask about side by side. Most figures come from SponsorUnited, which tracks team deals from in-venue signage, broadcasts, team sites and announcements. Its pricing tool is trained on more than $29.5 billion in sponsorship deal transactions. Where a league publishes no dollar figure, the table says so instead of guessing.
| League | Season | Team sponsorship revenue | Deals | Average per deal | Source and date |
|---|---|---|---|---|---|
| NWSL | 2024 | $75M | 401 deals (SponsorUnited’s report page counts 441 through Aug 2025) | About $170K (reported) | Marketing Brew, Aug 13, 2025, citing SponsorUnited |
| WNBA | 2024 | $76M (13 teams, $6.3M per team) | 531 | About $143K (our math: $76M / 531) | Marketing Brew, Aug 2025, citing SponsorUnited |
| PWHL | 2025-26 | Not disclosed | 81 corporate partners, portfolio up 35% YoY | Not disclosed | SVG, Apr 30, 2026 (league-reported) |
| Unrivaled | 2025 and 2026 seasons | Total league revenue about $30M (season 1), $45M (season 2); sponsorship share not disclosed | Not disclosed | Not disclosed | ESPN, Sep 8, 2025 (league source); AfroTech, Mar 13, 2026 |
| Major League Pickleball | 2025 | Sponsor revenue “more than doubled” 2024; no dollar figure | Not disclosed | Not disclosed | PPA Tour and MLP release, Jan 8, 2026 |
| MLS (benchmark) | 2025 | $716M (estimate), up 8% | Not reported | Not reported | SponsorUnited, Dec 3, 2025 |
| NHL (benchmark) | 2025-26 | $1.7B, up 9.7% | 3,162 | $529K (reported, up 11.4% from $475K) | SponsorUnited NHL report, 2026 |
| NBA (benchmark) | 2025-26 | $1.80B, up 11.1% | 2,452 | $731K (reported) | SponsorUnited NBA report, 2026 |
Two quick reads from the table. First, an average NBA team deal ($731K) is about 4.3 times an average NWSL deal (about $170K). Second, averages hide the shape. Ten NWSL deals were each worth more than $1 million in 2024, and three clubs (Angel City, the Current and San Diego Wave) took 46% of league sponsorship revenue, per Marketing Brew’s summary of the SponsorUnited report. Most NWSL deals are far below the average.
NWSL: the best-documented emerging league
Healthcare and finance brands put more than $25 million combined into NWSL teams in 2024, ahead of transportation, consumer services and alcohol. Deal count grew 16% from 2023, and teams added more than 200 new brands. Racing Louisville led the league with 94 sponsors. Angel City earned $29 in sponsorship per social follower, against $13 for the Dodgers and $8 for the Yankees (all Marketing Brew, Aug 2025). Audience is rising with it: 2025 regular-season ESPN games averaged 228,000 viewers, up from 141,000, and the championship on CBS averaged 1.18 million, per Nielsen (March 2026).
WNBA: one sponsor can move the whole league total
Finance, healthcare, insurance and gaming brands supplied more than $50 million of the WNBA’s $76 million in 2024 team sponsorship. Ally alone accounted for 23% of all WNBA brand spend, and the Phoenix Mercury’s Bally Bet deal was the largest team deal (Marketing Brew). That concentration is the main pricing lesson for emerging leagues: one anchor partner can set the market for a whole category.
PWHL, Unrivaled and pickleball: growth figures, not price lists
- PWHL. 81 corporate partners in 2025-26, a 35% larger partnership portfolio, average attendance of 9,304 across 120 regular-season games, and in-arena merchandise sales that doubled (SVG, Apr 2026). Kilmer Sports Ventures reportedly invested US$100 million directly in the league (TSN citing The Canadian Press, Jun 22, 2026). In its first season the league mixed one-year and three-year partner agreements (SponsorUnited, Feb 2024).
- Unrivaled. Ally signed as the first founding partner in 2024. The deal value was not disclosed. Ally later said it reached equal spend on men’s and women’s sports media a year early, up from 10% women’s share in 2022 (Ally release, Apr 14, 2026). Unrivaled was valued at $340 million after its Series B, and Sephora, Ally and Under Armour were named sponsors (ESPN, Sep 2025).
- PPA Tour and Major League Pickleball. DoorDash is MLP’s title sponsor and Carvana presents the PPA Tour. MLP ticket revenue rose 94% in 2025, and MLP team stakes changed hands at $13 million (LA Mad Drops majority stake) and $16 million (Palm Beach Royals expansion), per the leagues’ January 2026 release. Those are team valuations, not sponsorship fees.
- League One Volleyball, Athletes Unlimited and MLS NEXT Pro. We found no publicly reported sponsorship deal values for these properties in this research pass. Treat any “rate” you see quoted for them as an estimate unless it names the deal and the reporter.
How sponsorship rates are priced: the rate-card inputs
A sponsorship rate is a price for a bundle of rights, not a media buy. IEG describes its valuation work as appraising a property’s assets, likeness and exclusivity to set rate-card values, then pricing custom deals off those. Nielsen’s Sponsorship Media Value Benchmarking Report values the media portion: it tracks each logo exposure in live TV broadcasts, weights it with a proprietary Quality Index (QI) score, then combines it with audience data and ad rates. Here is what goes into the number.
| Rate-card input | How it is measured | What moves the price up |
|---|---|---|
| Broadcast and stream exposure | Logo seconds on screen, discounted for size, clutter and position (Nielsen QI method), times audience, times a media rate | National TV windows, jersey and in-frame signage |
| Owned social and digital | Impressions and engagement on team or league posts. SponsorUnited uses a “Total Engagement” metric across Instagram, Facebook, X, TikTok and LinkedIn | Branded content series, athlete posts |
| In-venue impressions | Attendance times sightlines (LED, concourse, naming) | Sell-outs, naming rights |
| Hospitality and tickets | Face value of seats, suites and events included | Playoff access, client events |
| Activation rights | Use of marks and logos, category exclusivity, data and pass-through rights | Exclusivity across a whole category, option to invest |
| Intangibles | Brand fit, prestige, fan affinity, research-led | Scarcity of the property, growth trajectory |
The X Games League title deal shows how much activation rights carry. MoonPay’s three-year title sponsorship is category-exclusive across finance, banking and crypto. It lets MoonPay bring its own partners into the league, and Sportico reports it includes an option to invest and buy two teams. Sportico put the total at “mid-eight figures,” citing someone familiar with the deal.
Worked example: pricing an emerging-league team package
Use this worksheet to sanity-check a quote. Every input below is an assumption for illustration except the audience figure, which is the NWSL’s 2025 ESPN regular-season average from Nielsen. Swap in your own numbers and CPMs.
- Broadcast exposure. 10 national games at 228,000 average viewers = 2,280,000 viewer impressions. Apply a 30% quality factor (assumed: your logo is not on screen the whole game) = 684,000. At a $30 CPM (assumed) that is $20,520.
- Social. 2,000,000 branded-post impressions (assumed) at a $10 CPM (assumed) = $20,000.
- In-venue. 13 home games at 10,000 attendance (assumed) = 130,000 impressions at a $15 CPM (assumed) = $1,950.
- Hospitality. 8 tickets per home game at $75 face value (assumed), 13 games = $7,800.
- Tangible total: $50,270. The gap between that and the property’s ask is what you are paying for exclusivity, marks, B2B access and the property’s growth.
Hold the result against the market: about $170K per NWSL deal and about $143K per WNBA deal on average in 2024. If the tangible value covers less than a third of the fee, ask for more measurable assets or a performance kicker before you sign. That one-third threshold is my rule of thumb for negotiation, not an industry standard.
Action sports sponsorship market size and brand spend, 2025
No primary source publishes an “action sports sponsorship market size.” IEG, GlobalData and SponsorUnited report by league, sector or region, and the vendor reports that quote a single action sports figure do not show the deal data behind it. What you can verify is the spend of the brands and properties themselves.
| Data point | Figure | Type | Source and date |
|---|---|---|---|
| MoonPay X Games League title deal | “Mid-eight figures” over 3 years; called the largest sponsorship in action sports history | Reported, anonymous source | Sportico, Jan 26, 2026; MoonPay (value not disclosed) |
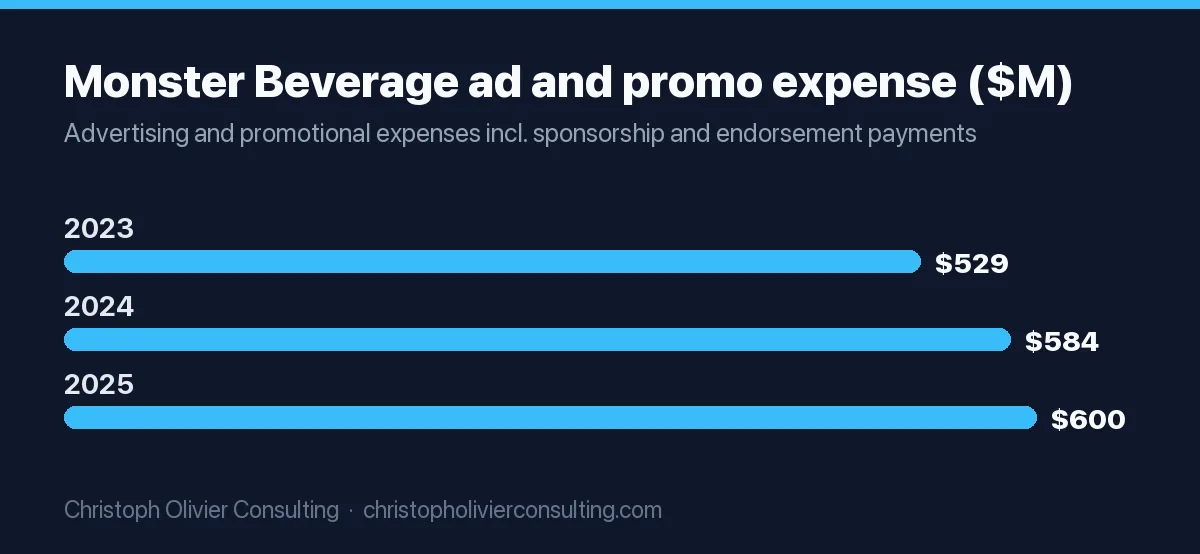
| Monster Beverage advertising and promotional expense | $599.9M in 2025 ($584.1M in 2024, $528.9M in 2023) | Audited filing | Monster 10-K, FY2025 |
| Monster sponsorship and marketing commitments | $570.2M outstanding at Dec 31, 2025; $318.0M due in 2026 | Audited filing | Same 10-K, Note 10 |
| Red Bull group turnover | EUR 12.196 billion in 2025, 13.969 billion cans sold; marketing spend not published | Company-reported | Red Bull company profile |
| Winter X Games Aspen 2026 | 17 new sponsors, Jeep as lead presenting partner, more than 50,000 fans | Analyst estimate | GlobalData, May 1, 2026 |
| World Surf League audience | 80M global audience in 2025, up 39%; 20.3M watch hours; 1.5B social impressions | League-reported, citing Nielsen data | Sports Destinations, Mar 24, 2026 |
| WSL 2025 partners | Global: Red Bull, YETI, Corona, Apple, I-SEA; Lexus as event title partner | League-reported | WSL, Jan 28, 2025 |
Monster’s ad and promo line was about 7.2% of its $8.29 billion in 2025 net sales (our math from the 10-K). The filing says a significant amount of that promotional expense is payments under sponsorship and endorsement contracts, but it does not split out action sports. Its marketing section lists sponsorship of athletes, teams, series, bands, esports and events. So the honest answer to “how much do brands spend on action sports” is this: the biggest spenders disclose totals, not sport-level splits, and the largest disclosed single action sports deal is the MoonPay XGL title at mid-eight figures over three years.
Global Sponsorship Spending: How Big Is the Market
Quote a market-size number only with its definition and date beside it. The table below lists every named source we could verify, with what each one actually measures.
| Source | Figure | Year | What it measures (method) | Where we read it |
|---|---|---|---|---|
| IEG (Sponsorship.com) | $97.5B | 2024 | Global sponsorship rights fees, all categories, not sports only | Cited by Lumency, Jan 22, 2025 |
| IEG (Sponsorship.com) | Over $8B | 2024-25 seasons | Sponsorship across MLB, MLS, NBA, NFL and NHL; NFL above $2.0B for the first time | IEG Big 5 report, Oct 21, 2025 |
| WFA with Lumency | $97.4B (2022), $189.5B forecast (2030) | 2022 to 2030 | Global brand sponsorship spend, citing a Research and Markets report; survey of 34 multinationals with $51.3B in combined ad spend | WFA, Nov 28, 2023 |
| SponsorUnited | $51M average per team | 2024-25 | Team deals across the NFL, NBA, NHL, MLB and MLS, up from $26M a decade earlier | SponsorUnited, Mar 25, 2025 |
| SponsorUnited | $4.5B | 2025 | Sponsorship spend in the 13 World Cup host markets, “nearly half” of North American sports sponsorship | 2025 Markets Report |
| GlobalData | $303.11M from 436 deals | 2025 | Hotel and accommodation brands’ sports sponsorship in North America, 50.1% of that sector’s global spend (sector reports, no public all-sports total) | GlobalData, Mar 26, 2026 |
| WARC (historical) | “Approaching $50bn” | 2020 forecast | Global sports sponsorship investment, 5.0% growth forecast; method not stated | WARC, Jan 28, 2020 |
| Nielsen Sports | No market total | 2024-25 seasons | Media value of sponsor exposures in live TV (QI Media Value) for NFL, NBA, NHL, MLB, WNBA, NWSL, NASCAR, PGA Tour | Nielsen benchmarking report page |
The defensible framing: global all-category sponsorship rights fees are near $97.5 billion (IEG, 2024), and the five biggest North American leagues alone draw more than $8 billion. Vendor forecasts for “sports sponsorship” spread too widely to quote as one number, so we leave them out.
Sports advertising statistics: Super Bowl rates and TV viewing share
Sponsorship and sports advertising buy the same audience in different ways. These are the sports advertising statistics with a named measurer behind them.
| Statistic | Figure | Source and date |
|---|---|---|
| Super Bowl LX (NBC, 2026) average 30-second price | About $8M; a handful sold above $10M | TVLine, Feb 3, 2026, citing the Financial Times and NBCUniversal’s Mark Marshall in Adweek |
| Super Bowl LX audience | 125.6M viewers (revised); halftime 128.2M; peak 137.8M | Nielsen, Feb 2026 |
| Cost per thousand Super Bowl viewers | About $63.69 ($8M / 125,603 thousand viewers) | Our math from the two rows above |
| Sports share of ad-supported TV viewing, adults 25-54 | Nearly 30%, Q4 2025 | TheWrap, Mar 12, 2026, citing Nielsen’s upfront planning guide |
| Ad-supported share of all US TV viewing | 74.2%, Q4 2025 (streaming 45.6%, broadcast 29.6%, cable 24.8% of ad-supported time) | Nielsen Ad Supported Gauge, Feb 4, 2026 |
| Sports viewing on broadcast, Q3 to Q4 2025 | Up 135%, to 34% of broadcast viewing | Same Nielsen release |
| Sports share of the year’s top 100 telecasts | 96 of 100 in 2025 (NFL projected at 84) | Barrett Media, Dec 31, 2025 (projected, citing Sports Business Journal) |
| Women’s sports minutes consumed, US | 46 billion minutes in 2025 | Nielsen, Mar 5, 2026 |
The practical takeaway: live sports is where most of the reach on ad-supported TV now sits, so in-game spots are priced like scarce inventory. Streaming already carries 45.6% of ad-supported viewing, which is why many sports buys now run through CTV. Our connected TV advertising statistics break down streaming ad spend and CPMs, and the US advertising industry statistics page covers the wider market.
Top Categories and Sports
Financial services is the top buying category in North American team sponsorship. In the NBA, financial brands spent an estimated $318 million in 2025-26, followed by technology at $173 million (SponsorUnited). In the NHL, financial led at $251 million and auto followed at $150 million (SponsorUnited). The same pattern shows up in women’s leagues: finance and healthcare led NWSL spend, and finance led the WNBA.
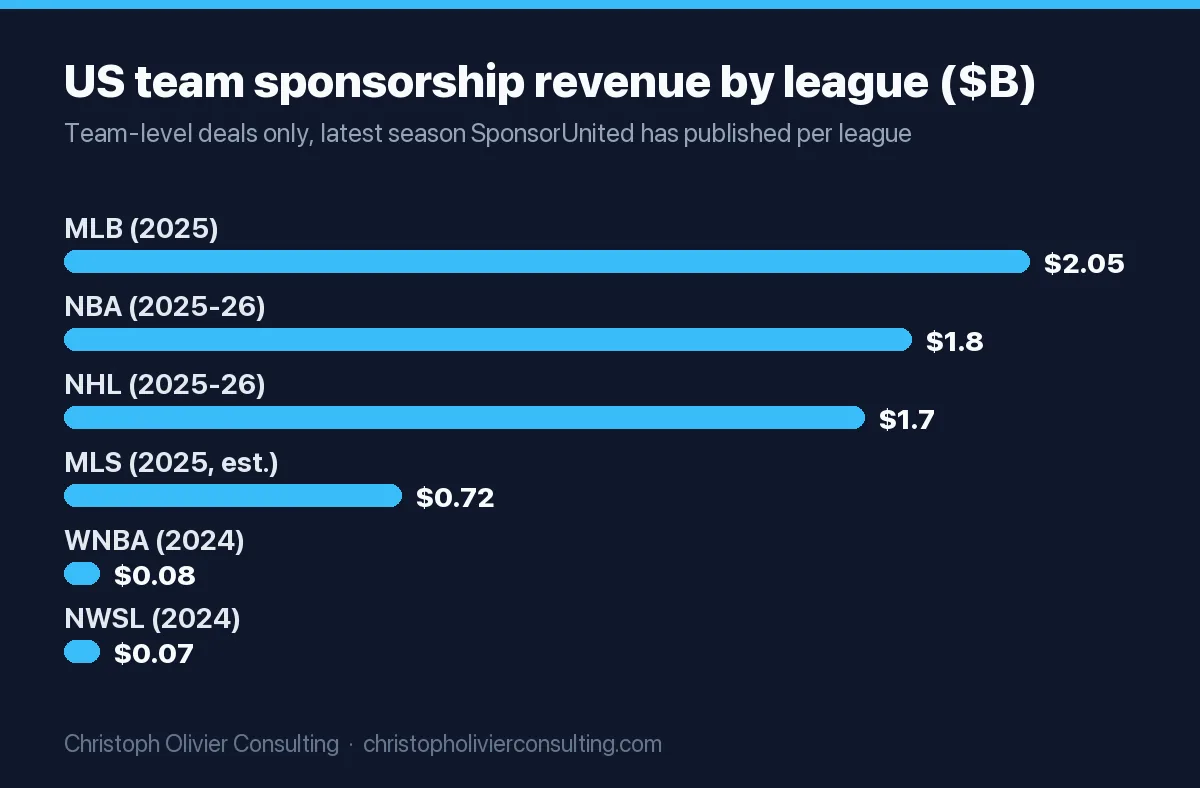
By league, MLB teams passed $2 billion for the first time, reaching $2.05 billion in 2025, up 9% (SponsorUnited, Oct 28, 2025). Over ten years, MLS posted the fastest per-team sponsorship growth of the big five at a 9.2% compound annual rate, against 6.5% for the NFL (SponsorUnited).
Women’s Sports Sponsorship
Women’s sports sponsorships rose 12% in 2024-25 across the WNBA, LPGA, WTA, NWSL and Liga MX Femenil, a dataset of more than 4,700 brands and 6,700 deals (SponsorUnited, Mar 4, 2025). Deloitte projected women’s elite sports revenue above $2.3 billion in 2025. Commercial revenue, which includes sponsorship, was forecast at $1.26 billion, or 54% of the total. Basketball was projected at $1.03 billion, up from $710 million in 2024 (Deloitte, Mar 2025).
The audience side is growing too. The 2025 WNBA season drew 220.12 million viewing hours, up 16% (Nielsen). Brands that tie a women’s sports buy to a stated commitment, as Ally did with its 50/50 media pledge, are running a version of cause marketing. That works only if the spend is real and published.
Sponsorship Return on Investment
Most brands barely measure it. In the WFA’s 2023 survey of 34 multinationals, brands spent 1% or less of their sponsorship budget on post-evaluation on average, and just over a fifth spent nothing. 43% did not know their activation spend, and only 5% were “very confident” their sponsorship investments reached the right audience with the right assets and spend (WFA, Nov 2023). On the effect side, Nielsen found an average 10% lift in purchase intent among exposed fans across 100 sponsorships in seven markets. That data is historical: it covers 2020 to 2021 (Nielsen, Mar 2022).
Renewal scorecard (pass/fail)
IEG’s renewal test asks six questions. Renewal is clearly justified only when every answer is yes (IEG, Oct 21, 2025). Score each one with evidence, not opinion:
| Question | Pass if you can show |
|---|---|
| Did it fulfill its stated objectives? | Pre-agreed KPIs hit, in writing |
| Did brand health and funnel metrics improve? | Exposed vs. unexposed fan research, before and after |
| Did it improve competitive position among fans? | Fan preference vs. your top two competitors |
| Did it match or beat other marketing investments? | Cost per outcome vs. your paid media benchmark |
| Was exposure in line with the fee? | Media value at or above fair market value |
| Will the property help optimize? | Agreed asset swaps for the next term |
Sponsorship Versus Advertising
Sponsorship is a real slice of the budget, not a side bet. WFA members put an average of 11% of their marketing budget into sponsorship, second only to media for many of them (WFA, 2023). It is also less accountable than media: 39% of those brands spent less on activation than on rights fees. If you treat a sponsorship as a partnership marketing program with shared goals, rather than as a logo buy, it is easier to fund activation and prove the result. For event-heavy deals, the event marketing statistics page collects trade show and event benchmarks.
Sports business and sponsorship trends for 2026
- Events are becoming leagues. X Games moved from standalone events to the MoonPay X Games League, with team owners holding licensing rights to sell their own sponsorship and merchandise (Sportico, Jan 2026). That creates team-level inventory where there was only event inventory.
- Bigger average deals, not more deals. NBA team deals grew by only 51 in 2025-26 while revenue rose 11.1%. NHL average deal size rose 11.4%. Properties are selling fewer, larger packages.
- Finance owns the category race. Financial brands top NBA, NHL, WNBA and NWSL spend, and crypto bought the biggest action sports title deal on record.
- Media parity pledges move money. Ally’s women’s sports media spend went from 10% to 50% of its sports media budget, a rise of more than 4.6 times (Ally, Apr 2026).
If you are deciding whether an emerging-league deal fits your budget, run the worksheet above first. If the numbers are close, book a consultation and we can pressure-test the package before you sign.
Data Limitations
- SponsorUnited counts team deals only. League-level deals are excluded or counted only when they include team signage, and each sub-brand counts as a separate deal.
- NWSL deal counts differ by source (401 in Marketing Brew’s coverage, 441 on SponsorUnited’s report page, which runs through August 2025).
- League-reported audience numbers (WSL, PWHL, MLP, Unrivaled) are not independently audited.
- The $97.5 billion IEG figure covers all sponsorship, not sports alone, and we read it through Lumency because the original report is paywalled.
Frequently asked questions
What are emerging sports league team sponsorship rates in 2024 and 2025?
Few emerging leagues publish rates. The best data: NWSL teams averaged about $170,000 per sponsorship deal in 2024 ($75 million league-wide), and WNBA teams averaged $6.3 million in total sponsorship each ($76 million across 531 deals, about $143,000 per deal). For comparison, NBA teams averaged $731,000 per deal and NHL teams $529,000 in 2025-26, per SponsorUnited.
How are sports sponsorship rates priced?
Properties price a rate card from measurable assets and rights. Measurable assets include broadcast logo exposure valued with audience and ad rates (Nielsen's QI Media Value method), social impressions, in-venue signage and hospitality. Rights include use of marks, category exclusivity and pass-through rights. IEG appraises these to set fair market value. The gap between tangible value and the fee is what you pay for exclusivity and growth.
How big is the action sports sponsorship market in 2025?
No primary source publishes a verified action sports sponsorship market size. The verifiable data points are brand and deal level: MoonPay's three-year X Games League title deal is reported at mid-eight figures, Monster Beverage spent $599.9 million on advertising and promotion in 2025, and the 2026 Winter X Games added 17 new sponsors, per GlobalData.
How big is the global sports sponsorship market?
IEG puts global sponsorship rights fees at $97.5 billion in 2024, across all categories, not sports alone. IEG also reports that the five biggest North American leagues (MLB, MLS, NBA, NFL, NHL) drew more than $8 billion in their most recent seasons. Vendor forecasts for sports-only sponsorship vary too widely to quote as one figure.
How much does a Super Bowl ad cost in 2026?
NBC sold Super Bowl LX 30-second spots for about $8 million on average, with a handful above $10 million, per the Financial Times and NBCUniversal's ad chief. Nielsen measured 125.6 million viewers, which works out to roughly $63.69 per thousand viewers for an average spot, before production costs.
What share of TV viewing is sports?
Sports made up nearly 30% of ad-supported TV viewing among adults 25 to 54 in Q4 2025, per Nielsen's upfront planning guide as reported by TheWrap. Ad-supported TV was 74.2% of all US TV viewing that quarter, and sports accounted for 96 of the 100 most-watched telecasts of 2025.
What are the biggest sports business and sponsorship trends?
Four stand out for 2026: events converting to team leagues (X Games League), fewer but larger deals (NHL average deal size up 11.4%), financial services leading category spend in the NBA, NHL, WNBA and NWSL, and parity pledges moving budgets to women's sports, such as Ally reaching equal men's and women's sports media spend in 2026.
Business & economy data