
Last reviewed: October 2026

Published July 23, 2026. Wage data reflect the May 2025 Occupational Employment and Wage Statistics release. Employment projections reflect the 2024 to 2034 cycle from the BLS Employment Projections program.
Executive summary
- Marketing managers earned a mean annual wage of $177,770 and a median of $166,790 in May 2025, with wage-and-salary employment of 395,240. Source: U.S. Bureau of Labor Statistics, Occupational Employment and Wage Statistics, May 2025.
- Market research analysts and marketing specialists is the largest occupation in this group, with 899,580 wage-and-salary jobs in May 2025 and a median wage of $78,760. Source: U.S. Bureau of Labor Statistics, Occupational Employment and Wage Statistics, May 2025.
- The seven marketing-relevant occupations in this analysis held about 1,836,410 wage-and-salary jobs in May 2025, a figure computed by summing the OEWS employment counts for each occupation.
- Marketing managers are projected to grow 6.6 percent from 2024 to 2034, adding 26,700 jobs, while advertising sales agents are projected to decline 6.4 percent. Source: U.S. Bureau of Labor Statistics, Employment Projections, National Employment Matrix, 2024 to 2034.
- Massachusetts posted the highest marketing-manager mean wage of any state at $213,230, and California held the most jobs at 54,660. Source: U.S. Bureau of Labor Statistics, Occupational Employment and Wage Statistics, May 2025.
- The San Jose-Sunnyvale-Santa Clara metro area paid marketing managers a mean of $255,360, 43.6 percent above the national mean. Source: U.S. Bureau of Labor Statistics, Occupational Employment and Wage Statistics, May 2025.
- Pay dispersion is wide. Advertising and promotions managers show a 90th-to-10th percentile wage ratio of 4.52, the widest in the group. Source: U.S. Bureau of Labor Statistics, Occupational Employment and Wage Statistics, May 2025.
- The manager premium is large. Marketing managers out-earn market research analysts by 98.6 percent at the mean, a gap derived from the two OEWS mean wages. Source: U.S. Bureau of Labor Statistics, Occupational Employment and Wage Statistics, May 2025.
Key findings
- Marketing managers (SOC 11-2021) recorded a median annual wage of $166,790 in May 2025, United States. Source: U.S. Bureau of Labor Statistics, Occupational Employment and Wage Statistics, May 2025.
- Marketing managers held 395,240 wage-and-salary jobs nationally in May 2025. Source: U.S. Bureau of Labor Statistics, Occupational Employment and Wage Statistics, May 2025.
- The top 10 percent of marketing managers earned at least $293,610 a year in May 2025, United States. Source: U.S. Bureau of Labor Statistics, Occupational Employment and Wage Statistics, May 2025.
- Market research analysts and marketing specialists (SOC 13-1161) numbered 899,580 in May 2025, the largest occupation in this analysis, with a median wage of $78,760. Source: U.S. Bureau of Labor Statistics, Occupational Employment and Wage Statistics, May 2025.
- Public relations managers (SOC 11-2032) earned a mean annual wage of $164,760 in May 2025 across 74,850 jobs, United States. Source: U.S. Bureau of Labor Statistics, Occupational Employment and Wage Statistics, May 2025.
- Public relations specialists (SOC 27-3031) earned a median wage of $74,750 in May 2025 across 283,380 jobs, United States. Source: U.S. Bureau of Labor Statistics, Occupational Employment and Wage Statistics, May 2025.
- Advertising and promotions managers (SOC 11-2011) is the smallest occupation here, with 21,470 wage-and-salary jobs and a mean wage of $154,280 in May 2025. Source: U.S. Bureau of Labor Statistics, Occupational Employment and Wage Statistics, May 2025.
- Advertising sales agents (SOC 41-3011) earned a median wage of $64,820 in May 2025 across 91,700 jobs, United States. Source: U.S. Bureau of Labor Statistics, Occupational Employment and Wage Statistics, May 2025.
- Web developers (SOC 15-1254) earned a median wage of $92,650 in May 2025 across 70,190 jobs, United States. Source: U.S. Bureau of Labor Statistics, Occupational Employment and Wage Statistics, May 2025.
- Marketing managers are projected to grow 6.6 percent from 2024 to 2034, adding 26,700 jobs (407,000 to 433,700). Source: U.S. Bureau of Labor Statistics, Employment Projections, National Employment Matrix, 2024 to 2034.
- Market research analysts and marketing specialists are projected to grow 6.7 percent from 2024 to 2034, adding 63,000 jobs (941,700 to 1,004,700). Source: U.S. Bureau of Labor Statistics, Employment Projections, National Employment Matrix, 2024 to 2034.
- Advertising sales agents are projected to decline 6.4 percent from 2024 to 2034, a loss of 6,600 jobs (103,700 to 97,100). Source: U.S. Bureau of Labor Statistics, Employment Projections, National Employment Matrix, 2024 to 2034.
- Advertising and promotions managers are projected to decline 2.2 percent from 2024 to 2034 (27,000 to 26,400), the group total pulled down by wage-and-salary losses despite rising self-employment. Source: U.S. Bureau of Labor Statistics, Employment Projections, National Employment Matrix, 2024 to 2034.
- Massachusetts led all states on marketing-manager mean wage at $213,230 in May 2025, followed by California at $207,860 and New York at $202,480. Source: U.S. Bureau of Labor Statistics, Occupational Employment and Wage Statistics, May 2025.
- California and New York together employed 108,660 marketing managers in May 2025, 27.5 percent of the national total, a share derived from the two state employment counts against the national figure. Source: U.S. Bureau of Labor Statistics, Occupational Employment and Wage Statistics, May 2025.
Employment levels by occupation
The occupations below are the marketing-relevant Standard Occupational Classification (SOC) codes tracked by the OEWS program. Employment counts in this section are wage-and-salary jobs only. The OEWS survey excludes self-employed workers, so counts for occupations with heavy freelance activity, such as advertising and promotions managers, understate the full workforce. Employment figures in the growth section that follows come from a different program and do include the self-employed.
| Occupation | SOC code | Employment | Share of group total | Source |
|---|---|---|---|---|
| Marketing Managers | 11-2021 | 395,240 | 21.5% | OEWS |
| Advertising and Promotions Managers | 11-2011 | 21,470 | 1.2% | OEWS |
| Public Relations Managers | 11-2032 | 74,850 | 4.1% | OEWS |
| Market Research Analysts and Marketing Specialists | 13-1161 | 899,580 | 49.0% | OEWS |
| Public Relations Specialists | 27-3031 | 283,380 | 15.4% | OEWS |
| Advertising Sales Agents | 41-3011 | 91,700 | 5.0% | OEWS |
| Web Developers | 15-1254 | 70,190 | 3.8% | OEWS |
| Group total (sum) | 1,836,410 | 100.0% | Derived sum |
Source: U.S. Bureau of Labor Statistics, Occupational Employment and Wage Statistics, May 2025. The group total is a derived sum of the seven occupation counts and is not a BLS-published aggregate. Market research analysts and marketing specialists alone account for 49.0 percent of the group.
Wages by occupation
The OEWS program publishes mean and median annual wages plus five wage percentiles for each occupation. The median is the 50th percentile, the wage at which half of workers earn more and half earn less. The mean sits above the median for every occupation here, which indicates that high earners pull the average upward. Wages are for wage-and-salary workers and do not include the self-employed or the value of bonuses paid on a non-production basis outside the reference period.
| Occupation | Mean | Median | 10th pct | 25th pct | 75th pct | 90th pct | Source |
|---|---|---|---|---|---|---|---|
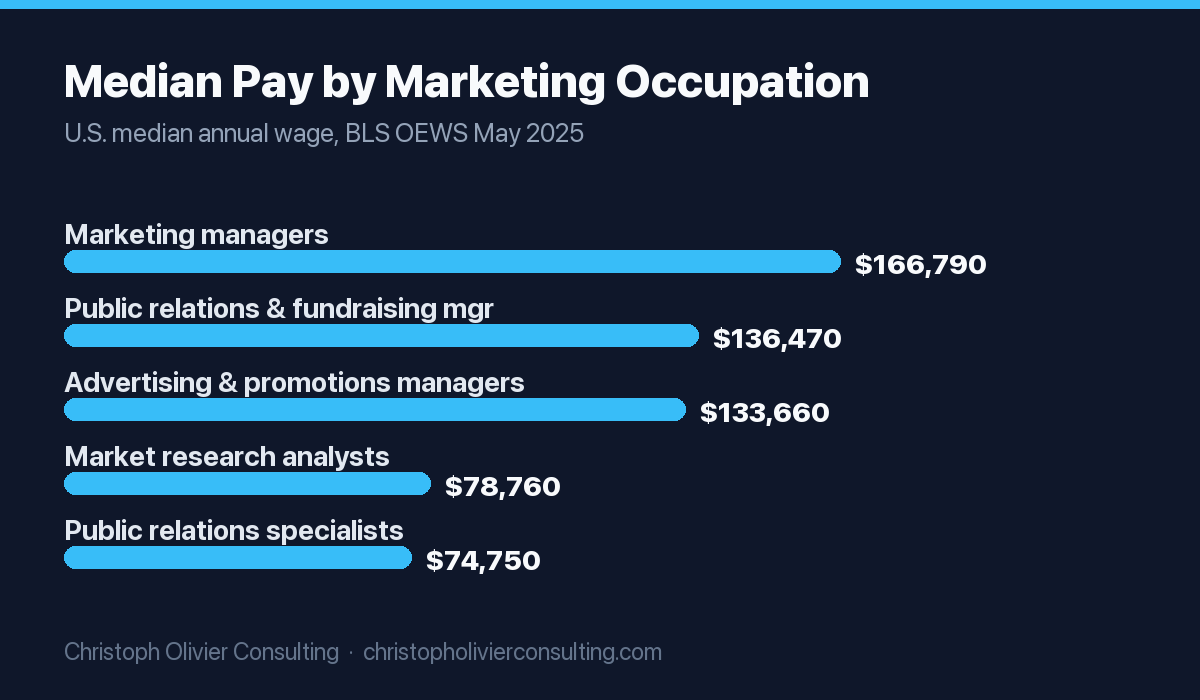
| Marketing Managers | $177,770 | $166,790 | $90,260 | $123,020 | $216,410 | $293,610 | OEWS |
| Advertising and Promotions Managers | $154,280 | $133,660 | $63,300 | $91,370 | $201,050 | $286,240 | OEWS |
| Public Relations Managers | $164,760 | $146,910 | $82,410 | $106,580 | $204,520 | $284,990 | OEWS |
| Market Research Analysts and Marketing Specialists | $89,490 | $78,760 | $43,390 | $58,350 | $108,310 | $155,480 | OEWS |
| Public Relations Specialists | $84,120 | $74,750 | $44,110 | $56,260 | $100,370 | $135,150 | OEWS |
| Advertising Sales Agents | $80,670 | $64,820 | $35,240 | $47,020 | $99,990 | $146,010 | OEWS |
| Web Developers | $98,770 | $92,650 | $48,100 | $64,230 | $126,230 | $162,290 | OEWS |
Source: U.S. Bureau of Labor Statistics, Occupational Employment and Wage Statistics, May 2025. Read each row as United States, May 2025. Marketing managers carry the highest median wage in the group at $166,790. Advertising sales agents carry the lowest median at $64,820.
Wages and employment by state and metro area
Geographic detail below covers marketing managers (SOC 11-2021), the flagship management occupation. State-level figures were retrieved for all 50 states and the District of Columbia. Three states (Delaware, Rhode Island, and Vermont) did not have a published marketing-manager mean wage in the May 2025 release and are excluded from the wage ranking. Metro figures cover a set of large metropolitan areas and are not a complete ranking of every metro.
| Rank | State | Mean annual wage | Employment |
|---|---|---|---|
| 1 | Massachusetts | $213,230 | 14,270 |
| 2 | California | $207,860 | 54,660 |
| 3 | New York | $202,480 | 54,000 |
| 4 | New Jersey | $198,400 | 13,510 |
| 5 | Colorado | $196,210 | 6,010 |
| 6 | Virginia | $195,940 | 6,890 |
| 7 | District of Columbia | $194,070 | 3,470 |
| 8 | Minnesota | $191,820 | 8,500 |
| 9 | Washington | $185,590 | 8,880 |
| 10 | Connecticut | $179,330 | 5,800 |
| 11 | North Carolina | $173,660 | 10,790 |
| 12 | Illinois | $170,370 | 21,140 |
Source: U.S. Bureau of Labor Statistics, Occupational Employment and Wage Statistics, May 2025. OEWS Marketing Managers.
| Rank | State | Employment | Mean annual wage |
|---|---|---|---|
| 1 | California | 54,660 | $207,860 |
| 2 | New York | 54,000 | $202,480 |
| 3 | Texas | 44,680 | $159,810 |
| 4 | Florida | 24,820 | $159,010 |
| 5 | Illinois | 21,140 | $170,370 |
| 6 | Massachusetts | 14,270 | $213,230 |
| 7 | Pennsylvania | 13,840 | $159,270 |
| 8 | New Jersey | 13,510 | $198,400 |
| 9 | North Carolina | 10,790 | $173,660 |
| 10 | Ohio | 10,620 | $147,400 |
| 11 | Washington | 8,880 | $185,590 |
| 12 | Georgia | 8,510 | $168,940 |
Source: U.S. Bureau of Labor Statistics, Occupational Employment and Wage Statistics, May 2025. The five lowest-paying states for marketing managers were Mississippi ($120,770), West Virginia ($121,140), Nebraska ($127,360), Alaska ($130,600), and New Mexico ($130,660).
| Rank | Metropolitan area | Mean annual wage | Employment |
|---|---|---|---|
| 1 | San Jose-Sunnyvale-Santa Clara, CA | $255,360 | 7,300 |
| 2 | San Francisco-Oakland-Fremont, CA | $235,920 | 11,170 |
| 3 | Boston-Cambridge-Newton, MA-NH | $216,770 | 11,940 |
| 4 | New York-Newark-Jersey City, NY-NJ-PA | $207,770 | 54,730 |
| 5 | Bridgeport-Stamford-Norwalk, CT | $195,090 | 2,150 |
| 6 | Washington-Arlington-Alexandria, DC-VA-MD-WV | $195,000 | 8,900 |
| 7 | Los Angeles-Long Beach-Anaheim, CA | $193,390 | 18,550 |
| 8 | Seattle-Tacoma-Bellevue, WA | $190,400 | 6,720 |
| 9 | Chicago-Naperville-Elgin, IL-IN | $173,020 | 17,400 |
| 10 | Philadelphia-Camden, PA-NJ-DE-MD | $172,890 | 8,270 |
| 11 | Atlanta-Sandy Springs-Alpharetta, GA | $171,480 | 6,700 |
| 12 | Dallas-Fort Worth-Arlington, TX | $164,130 | 16,320 |
Source: U.S. Bureau of Labor Statistics, Occupational Employment and Wage Statistics, May 2025. OEWS Marketing Managers. This table ranks a selected set of large metros and is not a complete national metro ranking.
Growth outlook, 2024 to 2034
Employment projections come from the BLS Employment Projections program and its National Employment Matrix. These figures use a 2024 base year and a 2034 target year. Unlike the OEWS wage-and-salary counts above, the projection base-year employment includes self-employed workers, so the totals are higher than the OEWS figures for the same occupations. Percent-change values are the program output.
| Occupation | 2024 employment (000s) | 2034 employment (000s) | Change (000s) | Percent change | Source |
|---|---|---|---|---|---|
| Marketing Managers | 407.0 | 433.7 | +26.7 | +6.6% | Matrix |
| Advertising and Promotions Managers | 27.0 | 26.4 | -0.6 | -2.2% | Matrix |
| Public Relations Managers | 83.2 | 87.3 | +4.1 | +5.0% | Matrix |
| Market Research Analysts and Marketing Specialists | 941.7 | 1004.7 | +63.0 | +6.7% | Matrix |
| Public Relations Specialists | 315.9 | 331.0 | +15.0 | +4.8% | Matrix |
| Advertising Sales Agents | 103.7 | 97.1 | -6.6 | -6.4% | Matrix |
| Web Developers | 86.0 | 92.5 | +6.5 | +7.5% | Matrix |
Source: U.S. Bureau of Labor Statistics, Employment Projections, National Employment Matrix, 2024 to 2034. Web developers show the fastest projected growth in the group at 7.5 percent, followed by market research analysts at 6.7 percent and marketing managers at 6.6 percent. Advertising sales agents show the steepest projected decline at 6.4 percent.
Original analysis: three derived insights
Insight 1. The wage-dispersion index (90th-to-10th percentile ratio)
Logic: divide the 90th percentile annual wage by the 10th percentile annual wage for each occupation, using the May 2025 OEWS percentiles in Table 2. A higher ratio means a wider gap between the best-paid and lowest-paid workers in the same occupation. Input source: OEWS May 2025 percentile wages for all seven occupations. Limitation: percentiles are model-based estimates for cross-industry, national employment and do not control for experience, industry, or hours.
| Occupation | 10th pct | 90th pct | 90/10 ratio | Dollar spread |
|---|---|---|---|---|
| Advertising and Promotions Managers | $63,300 | $286,240 | 4.52 | $222,940 |
| Advertising Sales Agents | $35,240 | $146,010 | 4.14 | $110,770 |
| Market Research Analysts and Marketing Specialists | $43,390 | $155,480 | 3.58 | $112,090 |
| Public Relations Managers | $82,410 | $284,990 | 3.46 | $202,580 |
| Web Developers | $48,100 | $162,290 | 3.37 | $114,190 |
| Marketing Managers | $90,260 | $293,610 | 3.25 | $203,350 |
| Public Relations Specialists | $44,110 | $135,150 | 3.06 | $91,040 |
Advertising and promotions managers show the widest dispersion at 4.52, and advertising sales agents follow at 4.14, both consistent with commission-linked and performance-linked pay. Public relations specialists show the tightest spread at 3.06. Derived from OEWS May 2025 percentile wages.
Insight 2. State ranking of marketing-manager pay and the geographic wage gap
Logic: rank all states with a published May 2025 marketing-manager mean wage, then measure the gap between the highest and lowest. Input source: OEWS May 2025 state files for SOC 11-2021 across 48 reporting states plus the District of Columbia. Limitation: three states lacked a published estimate; state means are not cost-of-living adjusted, so nominal gaps overstate real purchasing-power gaps.
Massachusetts led at $213,230 and Mississippi trailed at $120,770, a nominal gap of $92,460, meaning the top state paid 1.77 times the bottom state. Nine states plus the District of Columbia paid a marketing-manager mean above $185,000: Massachusetts, California, New York, New Jersey, Colorado, Virginia, the District of Columbia, Minnesota, and Washington. Derived from OEWS May 2025 state estimates.
Insight 3. Employment concentration and the self-employment gap
Logic part A: sum marketing-manager employment for the five largest states and divide by the national wage-and-salary total. Input source: OEWS May 2025 state and national estimates for SOC 11-2021. Result: California, New York, Texas, Florida, and Illinois held 199,300 of 395,240 marketing-manager jobs, or 50.4 percent of the national total. The top 10 states held 66.4 percent. This concentration means that half of all marketing-manager employment sits in five states.
Logic part B: compare the Employment Projections base-year total (which includes the self-employed) against the OEWS wage-and-salary count for the same occupation, then express the difference as a share of the projections total. Input sources: OEWS May 2025 employment and the 2024 base-year National Employment Matrix. Limitation: the two programs use different reference periods (May 2025 versus annual 2024) and different methods, so this gap approximates rather than exactly measures self-employment.
| Occupation | EP 2024 total incl self-employed (000s) | OEWS May 2025 wage-and-salary (000s) | Gap share |
|---|---|---|---|
| Advertising and Promotions Managers | 27.0 | 21.47 | 20.5% |
| Web Developers | 86.0 | 70.19 | 18.4% |
| Advertising Sales Agents | 103.7 | 91.70 | 11.6% |
| Public Relations Specialists | 315.9 | 283.38 | 10.3% |
| Public Relations Managers | 83.2 | 74.85 | 10.0% |
| Market Research Analysts and Marketing Specialists | 941.7 | 899.58 | 4.5% |
| Marketing Managers | 407.0 | 395.24 | 2.9% |
Advertising and promotions managers show the largest gap at 20.5 percent, which signals a heavily self-employed and freelance workforce that the OEWS wage-and-salary count does not capture. Marketing managers show the smallest gap at 2.9 percent. Derived from OEWS May 2025 and the 2024 to 2034 National Employment Matrix.
Methodology
Source selection: this asset uses only primary federal statistics from the U.S. Bureau of Labor Statistics. Wage and employment figures come from the Occupational Employment and Wage Statistics (OEWS) program, May 2025 estimates, retrieved through the BLS Public Data API for each occupation, state, and metro series. Projection figures come from the BLS Employment Projections program National Employment Matrix for the 2024 to 2034 cycle, retrieved from data.bls.gov.
Inclusion rules: an occupation was included if it maps to a marketing, advertising, public relations, market research, or closely related digital function under the 2018 SOC. A statistic was included only if it was returned by a BLS data endpoint with an explicit reference year. Exclusion rules: any figure that could not be tied to a fetched BLS series with a reference year was excluded. Annual job-opening counts were excluded from this asset because the available snippets were not internally consistent on whether the figure was annual or decade-total.
Handling of conflicts: OEWS employment (wage and salary only) and Employment Projections employment (includes self-employed) differ by design. This asset reports each separately and labels which program each figure comes from rather than blending them. Derived figures (ratios, shares, sums, and gaps) are labeled as derived and show their inputs. No figure was rounded beyond the precision published by BLS, except where a derived percentage is shown to one decimal place. Date of last update: July 23, 2026.
Source quality ranking
Tier 1 (primary, federal statistical programs): U.S. Bureau of Labor Statistics, Occupational Employment and Wage Statistics, May 2025; U.S. Bureau of Labor Statistics, Employment Projections program, National Employment Matrix, 2024 to 2034; the BLS Public Data API used to retrieve the OEWS series. Every statistic in this asset is Tier 1. Tier 2 and Tier 3 sources were not required and were not used, which keeps the dataset fully primary.
Most quotable statistics
- Marketing managers earned a median wage of $166,790 in May 2025 (BLS OEWS).
- The San Jose metro paid marketing managers a mean of $255,360, 43.6 percent above the national mean (BLS OEWS, derived comparison).
- Half of all marketing-manager jobs sit in just five states (BLS OEWS, derived).
- Market research analysts and marketing specialists are projected to add 63,000 jobs by 2034 (BLS Employment Projections).
- Advertising sales agents are projected to lose 6,600 jobs by 2034, a 6.4 percent decline (BLS Employment Projections).
- The top 10 percent of marketing managers earned at least $293,610 in May 2025 (BLS OEWS).
Data limitations
- OEWS estimates are model-based and represent May 2025. They are not a census and carry sampling and estimation error.
- OEWS employment counts exclude the self-employed, owners and partners in unincorporated firms, and unpaid family workers. Occupations with large freelance segments are understated.
- OEWS wages exclude non-production bonuses, employer cost of benefits, and stock compensation, so total compensation exceeds the wage figures shown.
- State and metro wage estimates are not adjusted for cost of living. Nominal geographic gaps overstate real purchasing-power differences.
- Employment Projections are a 10-year outlook built on assumptions about the economy and are subject to revision. They are not forecasts of any single year.
- OEWS employment and Employment Projections employment are not directly comparable because they use different reference periods and different coverage of the self-employed.
- Three states had no published marketing-manager wage in May 2025 and are excluded from the state wage ranking.
Downloadable dataset: recommended fields
- soc_code
- occupation_title
- geography_type (national, state, metro)
- geography_name
- reference_period (May 2025)
- employment_wage_and_salary
- annual_mean_wage
- annual_median_wage
- annual_wage_p10
- annual_wage_p25
- annual_wage_p75
- annual_wage_p90
- projection_base_year_employment_2024
- projection_target_year_employment_2034
- projected_numeric_change
- projected_percent_change
- source_program (OEWS or Employment Projections)
- source_url
Press summary
New federal data show marketing careers splitting into a high-paid management tier and a broad specialist base. In May 2025, U.S. marketing managers earned a median wage of $166,790 and a mean of $177,770 across 395,240 jobs, according to the Bureau of Labor Statistics Occupational Employment and Wage Statistics program. Market research analysts and marketing specialists formed the largest group at 899,580 jobs with a median of $78,760. Pay varied sharply by place. Massachusetts led all states for marketing managers at a $213,230 mean, and the San Jose metro reached $255,360, while Mississippi paid $120,770. Half of all marketing-manager jobs sat in five states. Looking to 2034, the Bureau projects marketing managers to grow 6.6 percent and market research analysts 6.7 percent, while advertising sales agents decline 6.4 percent. Advertising and promotions managers showed the widest internal pay gap, a 90th-to-10th percentile ratio of 4.52.
More original research from CO Consulting
- Small Business Website Speed: A 320-Site Performance Study (2026)
- US Advertising and Marketing Industry Statistics 2026: Revenue, Employment, and Wages
- Consumer Trust in Advertising and Marketing Statistics for 2026
- The AI Search Readiness Study 2026: 15 Data Points on How Small-Business Websites Score for AI Citation
- 27 Local SEO and Google Business Profile Statistics and Data Points for 2026
- Podcast and Audio Advertising Statistics for 2026: 27 Verified Data Points
- 52 SEO Statistics and Data Points for 2026: Search Share, Zero-Click, and the AI Overviews Shift
- 27 Connected TV and Streaming Advertising Statistics for 2026
More Marketing Research guides
- Small Business Website Speed: A 320-Site Performance Study (2026)
- US Advertising and Marketing Industry Statistics 2026: Revenue, Employment, and Wages
- US Digital Advertising Spend: 42 Statistics, Trends, and Data Points for 2026
- The AI Search Readiness Study 2026: 15 Data Points on How Small-Business Websites Score for AI Citation
- Consumer Trust in Advertising and Marketing Statistics for 2026
- FTC Advertising and Endorsement Enforcement: 12 Compliance Statistics for 2026
Business & economy data