

Published July 23, 2026. Last updated July 25, 2026.
This briefing aggregates verified figures on United States digital advertising revenue and spending. Reported actuals come from the IAB/PwC Internet Advertising Revenue Report (Full Year 2024) and from company financial filings for Alphabet, Meta, and Amazon. Forward figures come from EMARKETER (formerly Insider Intelligence) and are labeled as forecasts. Reported actuals and forecasts are kept separate throughout. Company ad-revenue figures from filings are worldwide totals, not United States only, and are labeled as such.
Executive summary
- United States internet advertising revenue reached $258.6 billion in full year 2024, up 14.9% year over year, the largest annual jump since 2021 (IAB/PwC, reported actual).
- Search led all formats at $102.9 billion in 2024, up 15.9% year over year, and held roughly 39.8% of United States digital ad revenue (IAB/PwC, reported actual).
- Social advertising grew fastest among the large formats, up 36.7% to $88.7 billion in 2024, lifting its share of United States digital ad revenue to about 34.3% (IAB/PwC, reported actual).
- Retail and commerce media reached $53.7 billion in 2024, up 23.0% year over year, per IAB/PwC (reported actual).
- The top 10 advertising sellers captured 80.8% of United States digital ad revenue in 2024, a measure of high market concentration (IAB/PwC, reported actual).
- EMARKETER estimated United States digital ad spending at $324.9 billion for 2025 and projected digital to exceed an 80% share of total United States media ad spending for the first time in 2025 (forecast/estimate).
- EMARKETER projected Meta would reach $100.86 billion in net United States digital ad revenue in 2026, moving ahead of Google on a net basis for the first time (forecast).
- Worldwide company filings for 2024 show Alphabet’s Google advertising at $264.6 billion, Meta advertising at $160.6 billion, and Amazon advertising services at $56.2 billion (reported actuals, global).
Key findings
- United States internet ad revenue was $258.6 billion in 2024, up 14.9% year over year (IAB/PwC, reported actual).
- Search revenue was $102.9 billion in 2024, up 15.9% year over year (IAB/PwC, reported actual).
- Social revenue was $88.7 billion in 2024, up 36.7% year over year (IAB/PwC, reported actual).
- Display revenue was $74.3 billion in 2024, up 12.4% year over year (IAB/PwC, reported actual).
- Digital video revenue was $62.1 billion in 2024, up 19.2% year over year, and accounted for close to 24% of total United States digital ad revenue (IAB/PwC, reported actual).
- Retail and commerce media revenue was $53.7 billion in 2024, up 23.0% year over year (IAB/PwC, reported actual).
- Podcast advertising revenue was $2.4 billion in 2024, up 26.4% year over year (IAB/PwC, reported actual).
- The top 10 sellers held 80.8% of United States digital ad revenue in 2024; sellers ranked 11 to 25 held 11%; all others held 8.3% (IAB/PwC, reported actual).
- EMARKETER estimated United States digital ad spending at $324.9 billion in 2025, the first year above $300 billion by its measure (forecast/estimate).
- EMARKETER projected digital would surpass an 80% share of total United States media ad spending for the first time in 2025 (forecast).
- EMARKETER projected United States digital ad spending would rise about 7.9% in 2026 (forecast).
- EMARKETER projected United States retail media ad spending of about $71.09 billion in 2026, up from about $60.32 billion in 2025 in its H1 2026 forecast (forecast).
- EMARKETER projected Amazon and Walmart would capture about 89% of net-new United States retail media investment in 2026 (forecast).
- EMARKETER estimated United States connected TV ad spending at $33.35 billion in 2025 and projected roughly $37.95 billion in 2026 (forecast).
- Worldwide 2024 filings: Alphabet Google advertising $264.6 billion, Meta advertising $160.6 billion, Amazon advertising services $56.2 billion (reported actuals, global).
Market size and growth
United States internet advertising revenue reached $258.6 billion in full year 2024, an increase of 14.9% over 2023, according to the IAB/PwC Internet Advertising Revenue Report released in April 2025. IAB described the 14.9% rate as the largest annual increase since 2021. This is a reported actual drawn from companies selling advertising on the internet plus publicly available corporate data.
Looking forward, EMARKETER estimated United States digital ad spending at $324.9 billion for 2025 and framed 2025 as the first year that digital would surpass an 80% share of total United States media ad spending. EMARKETER separately projected United States digital ad spending growth of about 7.9% in 2026. The IAB and EMARKETER totals are not directly comparable because the two organizations use different definitions and methodologies; the IAB/PwC figure measures reported seller revenue, while EMARKETER models buyer-side spending.
| Year | Figure | Year-over-year growth | Source and basis |
|---|---|---|---|
| 2024 | $258.6 billion | +14.9% | IAB/PwC, reported actual (seller revenue) |
| 2025 | $324.9 billion (est.) | n/a (different basis) | EMARKETER, forecast/estimate (buyer-side spend) |
| 2026 | +7.9% projected growth | +7.9% | EMARKETER, forecast (buyer-side spend) |
The 2024 figure and the 2025 to 2026 figures come from different organizations with different methodologies and are not a continuous time series. Do not compute a growth rate across the IAB and EMARKETER rows.
Revenue by format
The IAB/PwC report breaks 2024 United States revenue out by format. Search remained the single largest format at $102.9 billion, up 15.9% year over year. Social was the fastest-growing large format at $88.7 billion, up 36.7%. Display was $74.3 billion, up 12.4%. Digital video was $62.1 billion, up 19.2%. Podcast advertising was $2.4 billion, up 26.4%. Retail and commerce media was $53.7 billion, up 23.0%.
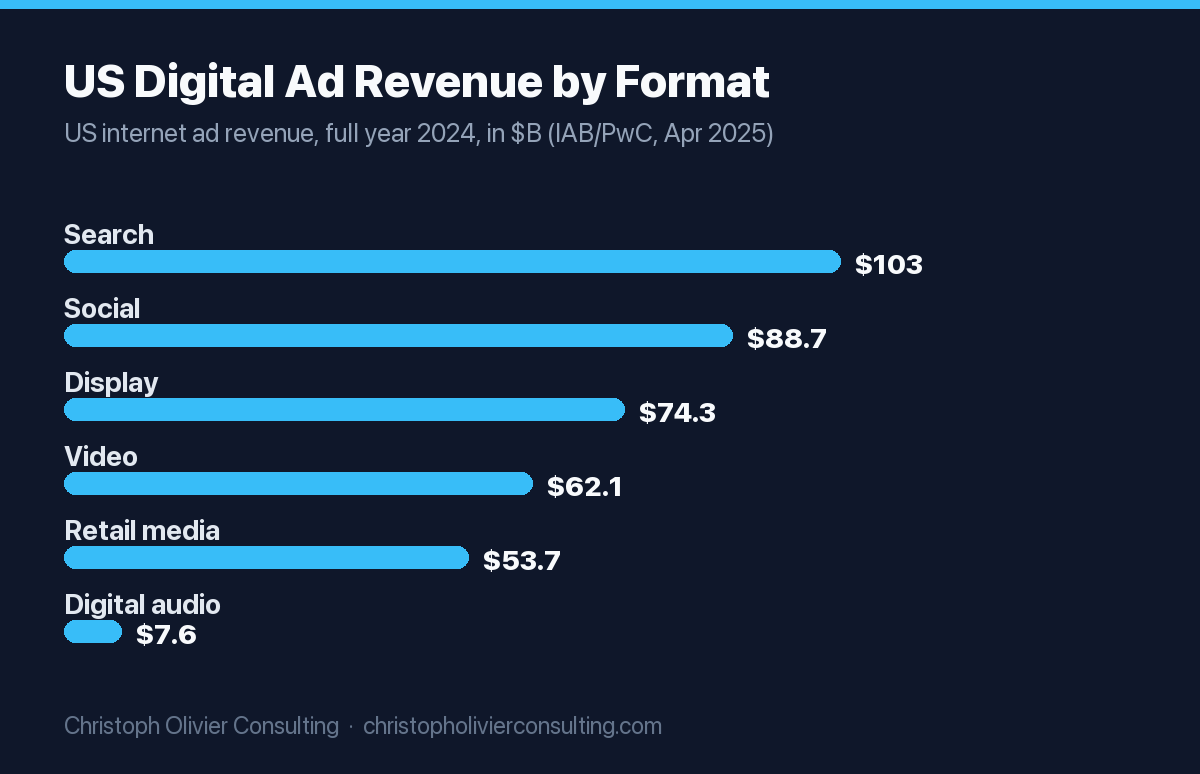
One caution applies. IAB reports some categories, including social, digital video, and commerce media, as cross-cutting cuts that overlap with search and display formats. For that reason the individual format figures should not be summed to the $258.6 billion total. Shares below are each format as a percentage of the total, not additive slices.
| Format | 2024 revenue | YoY growth | Share of total |
|---|---|---|---|
| Search | $102.9 billion | +15.9% | 39.8% |
| Social | $88.7 billion | +36.7% | 34.3% |
| Display | $74.3 billion | +12.4% | 28.7% |
| Digital video | $62.1 billion | +19.2% | 24.0% |
| Retail/commerce media | $53.7 billion | +23.0% | 20.8% |
| Podcast | $2.4 billion | +26.4% | 0.9% |
Shares sum to more than 100% because IAB counts social, digital video, and commerce media as cross-cutting categories that overlap with search and display. Shares are computed against the $258.6 billion total.
Retail media
Retail and commerce media was one of the faster-growing categories in 2024. IAB/PwC reported United States retail media revenue of $53.7 billion in 2024, up 23.0% year over year (reported actual). EMARKETER, which models buyer-side spend on a different basis, projected United States retail media ad spending of about $60.32 billion in 2025 and about $71.09 billion in 2026 in its H1 2026 forecast, a year-over-year increase of roughly 18% (forecast). An alternate EMARKETER cut placed 2025 at about $58.79 billion and 2026 at about $69.33 billion; the two cuts differ by forecast vintage, which is a reason to cite the date of any retail media projection.
EMARKETER projected that Amazon and Walmart together would capture about 89% of net-new United States retail media investment in 2026, or roughly $9.42 billion of about $10.53 billion in incremental spending (forecast). EMARKETER also projected United States retail media ad spending would reach $97.9 billion by 2028 (forecast, November 2024 vintage).
Platform concentration
United States digital advertising remains concentrated among a small number of sellers. IAB/PwC reported that the top 10 sellers captured 80.8% of United States digital ad revenue in 2024, sellers ranked 11 to 25 captured 11%, and all remaining sellers captured 8.3% (reported actual). Sellers ranked 11 to 25 posted the largest share gain, adding more than 3.1 percentage points versus 2023.
Company filings show the scale of the three largest sellers on a worldwide basis. For full year 2024, Alphabet reported Google advertising revenue of $264.6 billion, made up of Google Search and other at $198.1 billion, YouTube ads at $36.1 billion, and Google Network at $30.4 billion. Meta reported advertising revenue of $160.6 billion. Amazon reported advertising services revenue of $56.2 billion. These are worldwide company figures and are not limited to the United States, so they are not directly comparable to the IAB United States total.
| Company | 2024 ad revenue (worldwide) | Basis |
|---|---|---|
| Alphabet (Google advertising) | $264.6 billion | Search and other $198.1B; YouTube ads $36.1B; Network $30.4B |
| Meta | $160.6 billion | Total advertising revenue |
| Amazon | $56.2 billion | Advertising services |
| Combined (derived) | $481.4 billion | Sum of the three figures above |
Video and connected TV
Digital video was the fastest-growing large format in the IAB/PwC report, at $62.1 billion in 2024, up 19.2% year over year, and it reached close to 24% of United States digital ad revenue (reported actual). On the buyer side, EMARKETER estimated United States connected TV ad spending at $33.35 billion in 2025 and projected roughly $37.95 billion in 2026, growth of about 14% (forecast). EMARKETER projected connected TV would surpass traditional TV ad spending for the first time in 2028 (forecast).
Mobile versus desktop
Prior IAB/PwC reports established mobile as the majority of United States internet ad revenue; mobile passed a 50% share as early as 2016 and reached 56.7% of total revenue in 2017. A specific mobile versus desktop split for full year 2024 was not available in the sources verified for this briefing, so no 2024 mobile share figure is stated here. This is a deliberate exclusion under the rule that unverifiable figures are omitted.
Original synthesis: derived insights
Insight 1: Social’s share of United States digital ad revenue rose about 5.5 points in one year
Formula: format share equals format revenue divided by total United States digital ad revenue for the same year. 2024 social share equals $88.7 billion divided by $258.6 billion, or 34.3%. The 2023 base is back-computed from the reported year-over-year growth rates: 2023 social equals $88.7 billion divided by 1.367, or about $64.9 billion; 2023 total equals $258.6 billion divided by 1.149, or about $225.1 billion; 2023 social share equals about 28.8%. The change is a gain of about 5.5 percentage points.
Inputs: IAB/PwC Full Year 2024 (2024 social $88.7B at +36.7%; 2024 total $258.6B at +14.9%). Limitation: the 2023 base is derived from reported growth rates rather than read directly, so treat it as an estimate within rounding.
Insight 2: Search held its share near 40% even as social surged
Formula: same share method. 2024 search share equals $102.9 billion divided by $258.6 billion, or 39.8%. Back-computed 2023 search equals $102.9 billion divided by 1.159, or about $88.8 billion; against a 2023 total of about $225.1 billion, 2023 search share was about 39.4%. Search’s share moved only about 0.4 points, which shows search revenue kept pace with the overall market rather than losing share to social in 2024.
Inputs: IAB/PwC Full Year 2024 (2024 search $102.9B at +15.9%). Limitation: 2023 base derived from reported growth rates.
Insight 3: The three largest platforms reported a combined $481.4 billion in worldwide ad revenue in 2024
Formula: sum of worldwide advertising revenue from the three filings: $264.6 billion (Alphabet Google advertising) plus $160.6 billion (Meta) plus $56.2 billion (Amazon) equals $481.4 billion. Inputs: Alphabet FY2024 earnings release, Meta FY2024 results, Amazon FY2024 reporting. Limitation: these are worldwide company totals, not United States figures, and the three companies use different segment definitions, so this sum measures combined platform scale rather than a United States market share.
Insight 4: EMARKETER’s retail media path implies about a 17% compound annual growth rate to 2028
Formula: EMARKETER projected United States retail media ad spending would rise 88.5% from 2024 to 2028, reaching $97.9 billion. A cumulative 88.5% increase over four years is a compound annual growth rate of about 17.2%, computed as 1.885 raised to the one-fourth power, minus one. Inputs: EMARKETER retail media forecast (November 2024 vintage). Limitation: this is a forecast, not a reported actual, and the compound rate depends on EMARKETER’s stated endpoints.
Methodology
Source selection favored primary sources: the IAB/PwC Internet Advertising Revenue Report for reported United States seller revenue, and company financial filings and earnings releases for worldwide platform advertising revenue. EMARKETER was used for forward-looking United States spending forecasts and for categories the IAB report does not size on a buyer basis, such as connected TV. Inclusion required a figure to have a number, a year, a geography, and a retrievable source. Any figure that could not be verified against a fetched source was excluded, including a 2024 mobile versus desktop split.
Conflicting numbers were handled by labeling basis and vintage. IAB/PwC measures reported seller revenue for the United States; EMARKETER models buyer-side spending for the United States; company filings report worldwide segment revenue. Because these bases differ, figures from different sources are not presented as a single continuous series and are not summed across sources. Where two EMARKETER forecast vintages differed on retail media, both are shown with the difference attributed to forecast date. Reported actuals and forecasts are labeled throughout. Last updated July 25, 2026.
Source quality ranking
Tier 1 (primary: official industry body and company filings): IAB/PwC Internet Advertising Revenue Report, Full Year 2024; Alphabet FY2024 earnings release and 10-K; Meta FY2024 results; Amazon FY2024 advertising reporting.
Tier 2 (credible market research and trade coverage of primary data): EMARKETER United States ad spending, retail media, and connected TV forecasts; TVREV summary of the IAB/PwC report.
Tier 3 (reputable journalism and commentary): Search Engine Land, Variety, Adweek, and AdExchanger coverage of platform earnings.
Most quotable statistics
- United States internet ad revenue reached $258.6 billion in 2024, up 14.9% year over year (IAB/PwC, reported actual).
- Search alone was $102.9 billion in 2024 (IAB/PwC, reported actual).
- Social grew 36.7% to $88.7 billion in 2024, the fastest-growing large format (IAB/PwC, reported actual).
- The top 10 sellers held 80.8% of United States digital ad revenue in 2024 (IAB/PwC, reported actual).
- Alphabet, Meta, and Amazon reported a combined $481.4 billion in worldwide ad revenue in 2024 (company filings, derived sum).
Data limitations
- IAB/PwC and EMARKETER use different definitions and methodologies, so their totals are not directly comparable and should not be joined into one time series.
- Company ad-revenue figures are worldwide, not United States only.
- IAB format figures include cross-cutting categories that overlap, so format revenues do not sum to the reported total.
- Forecasts from EMARKETER are projections and can change by vintage; two retail media vintages disagree by several billion dollars.
- A 2024 mobile versus desktop split was not verified and is excluded.
Downloadable dataset: recommended fields
- metric_name
- value
- unit (USD billions or percent)
- year_or_range
- geography (United States or worldwide)
- basis (reported actual or forecast)
- source_organization
- source_url
- report_or_filing_name
- vintage_or_release_date
- notes_or_caveats
Press summary
United States digital advertising revenue reached $258.6 billion in 2024, a 14.9% increase over 2023 and the largest annual jump since 2021, according to the IAB/PwC Internet Advertising Revenue Report. Search led all formats at $102.9 billion, while social advertising grew fastest among the large formats, up 36.7% to $88.7 billion. Retail and commerce media rose 23.0% to $53.7 billion. The top 10 sellers controlled 80.8% of revenue, underscoring high concentration. Company filings show Alphabet, Meta, and Amazon reported a combined $481.4 billion in worldwide ad revenue in 2024. Looking ahead, EMARKETER estimated United States digital ad spending at $324.9 billion for 2025, projected about 7.9% growth in 2026, and forecast that Meta would move ahead of Google in net United States digital ad revenue in 2026. All forecast figures are projections and use a different basis than the reported IAB actuals.
Suggested headlines
- US Digital Ad Revenue Hit $258.6 Billion in 2024, Up 14.9%
- Social Advertising Grew 36.7% in 2024, Fastest of Any Large Format
- Ten Sellers, 80.8% of the Market: How Concentrated US Digital Advertising Really Is
- Alphabet, Meta, and Amazon Reported $481.4 Billion in 2024 Ad Revenue
- Retail Media Passed $53 Billion in 2024 and EMARKETER Sees $97.9 Billion by 2028
Frequently asked questions
How big was US digital advertising in 2024?
United States internet advertising revenue was $258.6 billion in full year 2024, up 14.9% year over year, according to the IAB/PwC Internet Advertising Revenue Report (reported actual).
What was the fastest-growing US ad format in 2024?
Among large formats, social grew fastest at 36.7%, reaching $88.7 billion in 2024 (IAB/PwC, reported actual).
How much was US search advertising in 2024?
Search advertising was $102.9 billion in 2024, up 15.9% year over year, and the largest single format (IAB/PwC, reported actual).
How large is US retail media?
IAB/PwC reported United States retail and commerce media at $53.7 billion in 2024, up 23.0% (reported actual). EMARKETER projected about $71.09 billion for 2026 in its H1 2026 forecast (forecast).
How concentrated is US digital advertising?
The top 10 sellers held 80.8% of United States digital ad revenue in 2024; sellers ranked 11 to 25 held 11%; all others held 8.3% (IAB/PwC, reported actual).
How much ad revenue did Google, Meta, and Amazon report in 2024?
Worldwide 2024 filings show Alphabet Google advertising at $264.6 billion, Meta advertising at $160.6 billion, and Amazon advertising services at $56.2 billion. These are global company figures, not United States only.
What is the US digital ad spending forecast for 2025 and 2026?
EMARKETER estimated United States digital ad spending at $324.9 billion for 2025 and projected about 7.9% growth in 2026 (forecast; note this uses a different basis than the IAB actual).
Will Meta pass Google in US ad revenue?
EMARKETER projected Meta would reach $100.86 billion in net United States digital ad revenue in 2026, ahead of Google on a net basis for the first time (forecast).
How big is connected TV advertising in the US?
EMARKETER estimated United States connected TV ad spending at $33.35 billion in 2025 and projected roughly $37.95 billion in 2026 (forecast).
Why do the IAB and EMARKETER totals differ?
IAB/PwC measures reported seller revenue for the United States, while EMARKETER models buyer-side spending. The definitions and methodologies differ, so the totals are not directly comparable and should not be joined into one series.
Citations
Source: IAB/PwC Internet Advertising Revenue Report, Full Year 2024, released April 2025. https://www.iab.com/news/digital-ad-revenue-2024/
Source: IAB/PwC Internet Advertising Revenue Report PDF, Full Year 2024. https://www.iab.com/wp-content/uploads/2025/04/IAB_PwC-Internet-Ad-Revenue-Report-Full-Year-2024.pdf
Source: Alphabet Fourth Quarter and Fiscal Year 2024 Results. https://www.sec.gov/Archives/edgar/data/1652044/000165204425000010/googexhibit991q42024.htm
Source: Meta Reports Fourth Quarter and Full Year 2024 Results. https://www.sec.gov/Archives/edgar/data/1326801/000132680125000014/meta-12312024xexhibit991.htm
Source: Amazon full year 2024 advertising, as reported. https://www.adweek.com/commerce/amazons-ad-revenue-was-56-billion-last-year/
Source: EMARKETER US Ad Spending 2026. https://www.emarketer.com/content/us-ad-spending-2026
Source: EMARKETER Retail Media Ad Spending Forecast H1 2026. https://www.emarketer.com/content/retail-media-ad-spending-forecast-h1-2026
Source: EMARKETER US TV and Connected TV Ad Spending Forecasts. https://www.emarketer.com/content/us-tv-connected-tv-ad-spending-forecasts-h2-2025
More original research from CO Consulting
- Small Business Website Speed: A 320-Site Performance Study (2026)
- US Advertising and Marketing Industry Statistics 2026: Revenue, Employment, and Wages
- Consumer Trust in Advertising and Marketing Statistics for 2026
- The AI Search Readiness Study 2026: 15 Data Points on How Small-Business Websites Score for AI Citation
- Podcast and Audio Advertising Statistics for 2026: 27 Verified Data Points
- 27 Connected TV and Streaming Advertising Statistics for 2026
- Marketing Cost & CAC Benchmark by Industry 2026: The True Cost Per Acquired Client
- CMO and Marketing Budget Statistics 2026: Verified Benchmarks From Gartner and The CMO Survey
More Marketing Research guides
- Small Business Website Speed: A 320-Site Performance Study (2026)
- US Advertising and Marketing Industry Statistics 2026: Revenue, Employment, and Wages
- The AI Search Readiness Study 2026: 15 Data Points on How Small-Business Websites Score for AI Citation
- Consumer Trust in Advertising and Marketing Statistics for 2026
- FTC Advertising and Endorsement Enforcement: 12 Compliance Statistics for 2026
- Marketing Cost & CAC Benchmark by Industry 2026: The True Cost Per Acquired Client