

US shoppers were expected to send back $849.9 billion of merchandise in 2025, or 15.8% of retail sales, according to the National Retail Federation and Happy Returns (a survey of 358 ecommerce leaders at US merchants with more than $500 million in revenue, fielded August to September 2025). Online purchases come back more often: retailers estimated 19.3% of online sales would be returned. A second, data-based series from Appriss Retail puts 2025 returns at $706 billion, with about 14.2% of that ($100 billion) lost to fraud and abuse.
Those two totals do not contradict each other. They measure different things, and most product returns statistics pages online quote one without saying which. Below, every figure carries its publisher, sample, date and method so you can cite it without getting caught out. As of November 1, 2026, the 2025 NRF edition is the most recent one we could find; NRF published the last two editions in October and December, so check for a 2026 edition before you quote.
Product returns statistics at a glance: source, sample, date and method
Use this as your citation sheet. “Survey estimate” means retailers estimated their own return rates; “measured” means the figure comes from transaction data. Anything with data older than 2023 is marked historical.
| Statistic | Figure | Source | Sample | Date | Method |
|---|---|---|---|---|---|
| Total US retail returns, 2025 | $849.9 billion | NRF and Happy Returns | 358 ecommerce professionals at US merchants with $500M+ revenue; 2,006 consumers | Fielded Aug to Sep 2025; published Oct 15, 2025 | Retailer survey estimate |
| Return rate, all retail, 2025 | 15.8% of sales | NRF and Happy Returns | Same | Same | Retailer survey estimate |
| Return rate, online sales, 2025 | 19.3% | NRF and Happy Returns | Same | Same | Retailer survey estimate |
| Holiday sales returned, 2025 | 17% | NRF and Happy Returns | Same | Same | Retailer survey estimate |
| Total US returns, 2025 | $706 billion | Appriss Retail | Transactions tied to 250 million customer identifiers at Appriss clients; 1,020 US consumers; NRF, IHL, ECR and Deloitte benchmarks | Published Feb 2026 | Measured client data plus industry benchmarks |
| Preventable returns loss (fraud plus abuse), 2025 | 14.2% of returns ($100 billion) | Appriss Retail | Same | Same | Measured plus modeled |
| Cost to process a return | 30% of the item’s value ($211 billion in total) | Appriss Retail | Same | Same | Appriss estimate |
| Fraudulent returns (merchant estimate) | 9% of returns | NRF and Happy Returns | Merchants that track fraud | 2025 | Excludes bracketing and wardrobing |
| Total US retail returns, 2024 | $890 billion (16.9% of sales) | NRF and Happy Returns | 249 ecommerce and finance professionals; 2,007 consumers | Fall 2024; published Dec 5, 2024 | Retailer survey estimate |
| Total US returns, 2024 | $685 billion (13.21% of $5.19 trillion) | Appriss Retail and Deloitte | Data from 60+ US retailers; 150 executives; 1,000 consumers; Census sales | Published Dec 30, 2024 | Measured, Census sales base |
| Fraudulent returns and claims, 2024 | $103 billion (15.14% of returns) | Appriss Retail and Deloitte | Same | Same | Includes claims fraud |
| Total US returns, 2023 | $743 billion (14.5%) | NRF and Appriss Retail | Appriss client returns data plus NRF survey | Published Dec 26, 2023 | Different method; NRF says not comparable with other years |
| Online vs in-store return rate, 2023 | 17.6% vs 10.02% | NRF and Appriss Retail | Same | Same | In-store excludes online orders returned in store |
| Merchants charging for at least one return option | 72% (66% in 2024) | NRF and Happy Returns | 358 merchants | 2025 | Retailer survey |
| E-commerce share of US retail sales, Q2 2026 | 17.1% | US Census Bureau | Monthly Retail Trade Survey plus administrative records | Released Aug 18, 2026 | Seasonally adjusted government estimate |
| Apparel return rate, Shopify merchants | 14.5% | Loop (vendor data) | 22 million+ returns, 4,000+ merchants | Jan 1 to Oct 31, 2024 | Dollar value returned divided by Shopify order value, adjusted |
| Returned goods sent to US landfills (historical) | 9.5 billion lbs; 24 million metric tons CO2 | Optoro 2022 Impact Report | Model, no sample | Model updated 2022 | Optoro model with Environmental Capital Group |
Why NRF says $849.9 billion and Appriss says $706 billion
NRF’s number is a projection built from what large retailers say they expect to be returned, applied to all retail sales. Appriss Retail starts from actual returns transactions at its retail clients. In 2024 the gap was $205 billion: NRF and Happy Returns reported $890 billion (16.9%), while Appriss and Deloitte reported $685 billion, or 13.21% of $5.19 trillion in Census-measured retail sales.
| Year | NRF series | Appriss series | Comparable? |
|---|---|---|---|
| 2025 | $849.9B, 15.8% of sales | $706B (rate not published on the report page) | Same year, different method |
| 2024 | $890B, 16.9% | $685B, 13.21% | Same year, different method |
| 2023 | $743B, 14.5% (joint NRF and Appriss study) | Same study | NRF says the 2023 method is not comparable with its other years |
My rule: quote NRF when you need the number most journalists recognize, quote Appriss when you need a measured figure or a channel split, and never put both in one sentence as if one replaced the other.
US return rate by year: the NRF series
NRF’s 2025 returns report prints its own history table. The rate jumped during the pandemic and has held in a 15.8% to 16.9% band since. NRF left 2023 out of the table because that year used a different method.
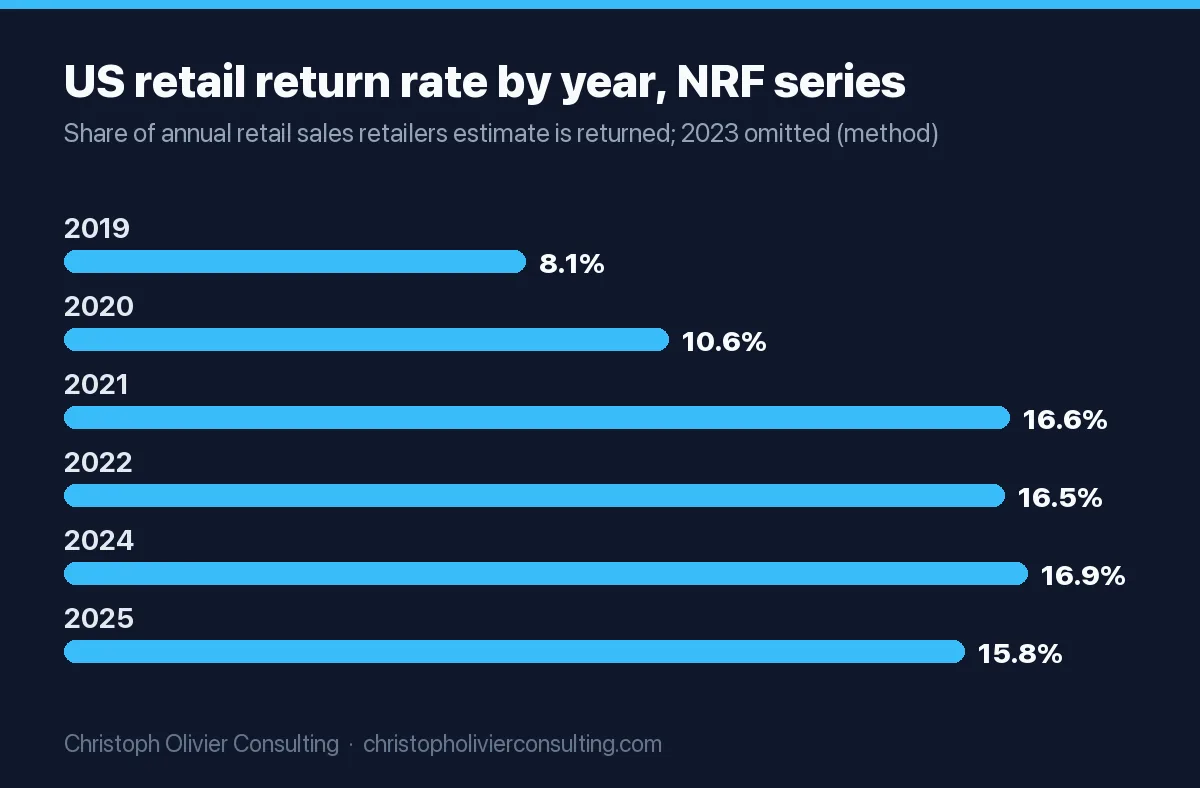
| Year | Return rate | Total returns | Label |
|---|---|---|---|
| 2019 | 8.1% | $309B | Historical |
| 2020 | 10.6% | $428B | Historical |
| 2021 | 16.6% | $760.8B | Historical |
| 2022 | 16.5% | $816.8B | Historical |
| 2023 | Not comparable | Not comparable | Different method |
| 2024 | 16.9% | $890B | Current series |
| 2025 | 15.8% | $849.9B | Current series |
Source: NRF and Happy Returns, 2025 report, historical table (merchant question: “What percentage of the following sales types this year do you estimate will be returned?”).
Online vs in-store return rates
Online purchases are returned more often than store purchases in every series we checked. In the measured 2023 study, NRF and Appriss Retail found online purchases came back at 17.6% ($247 billion) against 10.02% ($371 billion) for pure brick-and-mortar purchases. That in-store figure excludes online orders returned in store. For 2025, retailers in the NRF survey estimated 19.3% of online sales would be returned, and a separate NRF study from October 2024 found online return rates ran 21% higher than retailers’ overall rates.
Where returns physically land is a different question. Appriss Retail split 2025’s $706 billion like this:
| Purchase and return channel | Returned value, 2025 | Share of returns |
|---|---|---|
| Bought in store, returned in store | $367B | 52% |
| Bought online, returned in store (BORIS) | $208B | 29% |
| Bought online, returned online or by mail | $131B | 19% |
Our arithmetic from that table: 48% of returned dollars started as online orders. For context, the Census Bureau put e-commerce at 16.3% to 16.7% of seasonally adjusted retail sales from Q2 to Q4 2025, rising to 17.1% ($340.2 billion of $1,986.5 billion) in Q2 2026. The bases differ, so treat the comparison as directional: online orders appear to generate a share of returns well above their share of sales. The Q3 2026 Census figure is due November 19, 2026. Our ecommerce statistics roundup covers the sales side in more depth.
BORIS is growing fastest on the retailer side: the share of large merchants offering it rose from 33% to 43% between the 2024 and 2025 NRF surveys, and no box, no label carrier returns rose from 17% to 25%.
Return rates by product category
No government agency publishes return rates by category. The cleanest public breakdown we found is vendor data: Loop, a Shopify returns app, analyzed more than 22 million returns from over 4,000 merchants between January 1 and October 31, 2024. Its “adjusted return rate” is the dollar value returned divided by Shopify order value, adjusted for refunds processed outside Loop. More than half of Loop’s merchants sell apparel, and none are big-box retailers, so read these as DTC Shopify benchmarks, not national averages.
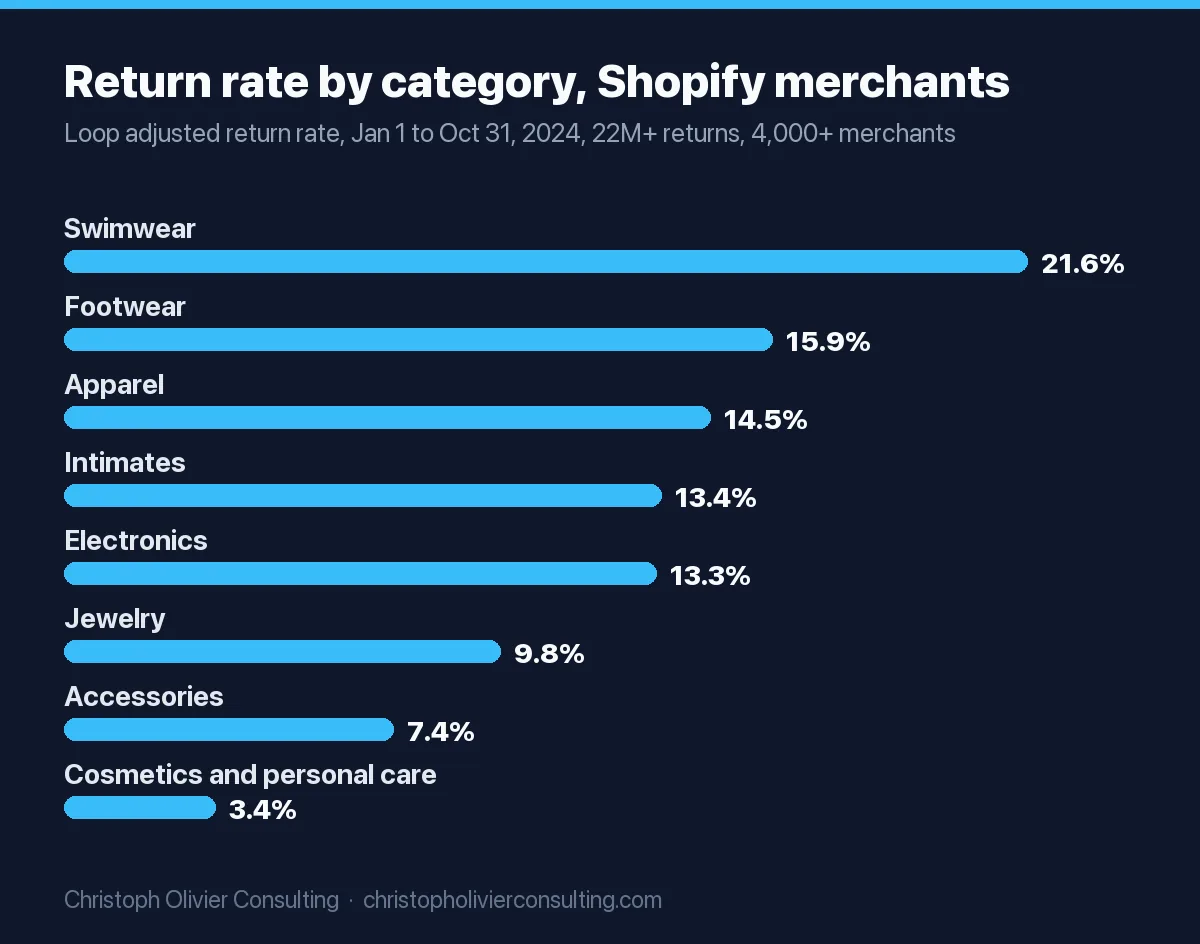
| Category (Loop vertical) | Return rate | Kept as exchange or credit | Average handling fee charged |
|---|---|---|---|
| Swimwear | 21.6% | 27.9% | $8 |
| Footwear | 15.9% | 31.6% | $8 |
| Apparel | 14.5% | 23.2% | $8 |
| Intimates | 13.4% | 30.9% | $6 |
| Electronics | 13.3% | 17.3% | $14 |
| Jewelry | 9.8% | 38.8% | $7 |
| Accessories | 7.4% | 27.4% | $11 |
| Other (novelty, packaged food, auto parts) | 5.2% | 16.3% | Not shown |
| Cosmetics and personal care | 3.4% | 18.6% | $8 |
| Home goods | 1.8% | 28.6% | $17 |
Source: Loop Winter 2024 Benchmark Report, January 1 to October 31, 2024 (vendor data). “Kept” is Loop’s retention rate: exchange and store credit value divided by total returned value. Loop also reports that 66.4% of its apparel merchants charge a handling fee.
One more category signal from a non-vendor sample: merchants in the 2025 NRF survey said 23% of purchases in the past year included a bracketed item (buying several sizes or colors to return some), rising to 26% in apparel and footwear.
Return fraud and abuse statistics
Fraud numbers swing from 2% to 15% depending on what the publisher counts. Match the definition before you quote.
| Measure | Figure | Source and date | What it counts |
|---|---|---|---|
| Fraudulent returns | 9% of returns | NRF and Happy Returns, 2025 | Merchant estimate; excludes bracketing and wardrobing |
| Preventable returns loss | 14.2% of returns ($100B) | Appriss Retail, Feb 2026 (2025 data) | Abuse 12% ($86B) plus fraud 2% ($14B) |
| Fraudulent returns and claims | 15.14% of returns ($103B) | Appriss and Deloitte, Dec 2024 | Returns plus claims fraud |
| Fraud and abuse loss | $101B; $13.70 per $100 returned | NRF and Appriss, Dec 2023 | Returns fraud and abuse |
What shoppers admit to, from the 2025 NRF consumer survey of 2,006 people who returned an online purchase:
| Behavior | All shoppers | Gen Z |
|---|---|---|
| Say bending the truth on a return is sometimes acceptable | 45% | 66% |
| Bracketing (buying with intent to return) | 36% | 53% |
| Wardrobing (returning used items) | 27% | 49% |
| Shipped fewer items back than claimed | 21% | 37% |
| Decoy return | 20% | 39% |
| Label tampering (FTID) | 20% | 38% |
| Empty box return | 18% | 33% |
On the merchant side, 85% of the NRF sample use AI or machine learning to spot return fraud, but only 45% call it effective and 40% say results are mixed. Merchants tracking fraud saw increases in overstated quantities (71%), empty boxes (65%) and decoy returns (64%). In the 2024 Appriss data, 60% of retailers reported wardrobing, 55% returns paid with fraudulent or stolen tender and 48% returns of stolen merchandise.
Return fees: who charges, and what shoppers do about it
Free returns are shrinking. In the 2025 NRF survey, 72% of large merchants had started charging for at least one return option in the past 12 months, up from 66% in 2024. Their top reasons, ranked first or second: higher processing costs (40%), higher carrier shipping costs (40%), tariff and economic uncertainty (33%), discouraging returns (31%), fraud (29%) and a belief that shoppers now tolerate fees (27%).
| Effect merchants report after adding fees | Share | Direction |
|---|---|---|
| Lower overall return rates | 53% | Positive |
| More exchanges | 52% | Positive |
| Shoppers switching to a free return method | 51% | Positive |
| Recouped revenue from returns | 43% | Positive |
| Less return fraud | 42% | Positive |
| More customer complaints | 47% | Negative |
| More return fraud | 44% | Negative |
| Fewer exchanges | 39% | Negative |
| Lost customers over fees | 37% | Negative |
| Lower average order value | 34% | Negative |
| Lower sales | 24% | Negative |
The consumer side is blunt: 57% of shoppers in the same study said they had decided not to shop with a retailer after it started charging for returns, up from 40% in 2024.
Named retailers charging return fees (policy pages checked November 1, 2026)
| Retailer | Mail-return fee | Free option | Source |
|---|---|---|---|
| H&M (US) | $5.99 flat fee deducted from mail-in returns of online purchases | “In-store returns are always free” | H&M US return policy |
| J.Crew | $7.50 deducted from the refund when using the prepaid label | Free exchanges | J.Crew returns page |
We only list retailers whose own policy page we could read. Fee lists in news roundups change often, so check the retailer’s page before citing an amount. One figure to stop using: Loop’s September 24, 2025 press release claiming most merchants now charge return fees was withdrawn by Loop as issued in error. Cite NRF’s 72% instead.
What a return costs to process
The best named estimate is from Appriss Retail: processing a return costs about 30% of the item’s value, about $211 billion across 2025 returns. That covers handling, not the lost sale or markdown on resale. NRF’s merchant data shows where the time goes: about half of retailers (49%) take 6 to 10 days to get a returned item back in stock, 19% say that is too slow to protect margin, and 40% have had to choose between shipping new orders and processing returns because warehouse or 3PL capacity ran out.
Holiday peaks make it worse. Retailers expected 17% of 2025 holiday sales to come back, and 82% of shoppers said they return unwanted gifts within a month. To cope, merchants planned to lean on 3PL partners (49%), hire seasonal returns staff (43%) and extend return windows (37%), per the NRF release. Our holiday retail statistics page covers the sales side of the season.
Environmental impact of returns: what the evidence supports
The most quoted figure is from returns software company Optoro: 9.5 billion pounds of US returns sent to landfills and 24 million metric tons of CO2 emitted, in its 2022 Impact Report. The report’s footnote says these come from “environmental impact models developed by Optoro in consultation with Environmental Capital Group. Updated 2022.” Treat it as a historical vendor model, not a measurement: the inputs are not public, and the model predates the $890 billion 2024 total. Optoro is now part of Blue Yonder and its original report link no longer resolves, so we link the archived copy.
We found no government or peer-reviewed estimate of US returns landfill volume to cross-check it. If you need an environmental number, quote Optoro with its year and method, and say it is a model.
Shopper expectations that drive return volume
| Shopper statement | 2025 | 2024 | Source |
|---|---|---|---|
| Free returns are an important consideration online | 82% | 76% | NRF and Happy Returns |
| Check the return policy before buying from a new retailer | 81% | 77% | NRF and Happy Returns |
| Return policy is an important consideration | 77% | 70% | NRF and Happy Returns |
| Less likely to shop again after a poor return experience | 71% | 67% | NRF and Happy Returns |
| A return should take 10 minutes or less | 82% | n/a | NRF and Happy Returns |
| Prefer returns without packaging or label printing | 76% | n/a | NRF and Happy Returns |
| More likely to shop with no box, no label returns and immediate refunds | n/a | 84% | NRF and Happy Returns |
Two of these connect directly to revenue. First, 52% of shoppers in the 2025 NRF study said they won’t buy at all if they expect a difficult return, which is one of the friction points behind the 70.22% average in our cart abandonment statistics. Second, the 71% who are less likely to come back after a bad return are a retention problem, which our customer retention statistics quantify for ecommerce repeat purchase.
Gen Z returns the most: shoppers aged 18 to 30 made 7.7 online returns in the past 12 months, against 7.1 for millennials, 6.5 for Gen X and 4.8 for baby boomers (NRF 2025). They also spend more per order: $208 average online order value, against $82 for boomers.
How to reduce product returns: tactics and the evidence behind each
Most returns advice online has no evidence attached. Here is what the data actually shows for each tactic, including where the evidence is thin.
| Tactic | Evidence | Source | Caveat |
|---|---|---|---|
| Show or link the return policy on the product page | 44% of ecommerce sites don’t; 60% of users look for return info on the product page (1,032 respondents) | Baymard Institute, updated Mar 2026 | Reduces purchase anxiety; not proven to cut return rates |
| Add sizing information and fit commentary | 41% of merchants with bracketing add sizing info; 37% add model sizing and fit notes; 36% use recommended-size tools | NRF 2025 | Adoption data, not outcome data |
| Add more customer reviews | 42% of merchants with bracketing use this | NRF 2025 | Adoption data |
| Push exchanges and store credit over refunds | Loop merchants keep 17.3% (electronics) to 38.8% (jewelry) of returned value as exchanges or credit; 60% of consumers are open to exchanges or credit if the process is quick | Loop 2024; Narvar, Aug 2024 (1,924 consumers) | Vendor data; keeps revenue, does not lower the rate |
| Charge for mail returns, keep a free option | 53% of fee-charging merchants saw lower return rates and 51% saw shoppers switch to the free method; 37% lost customers | NRF 2025 | 57% of shoppers say they stopped shopping somewhere after a fee |
| Offer box-free, label-free drop-off | 76% of shoppers prefer it; merchant adoption rose from 17% to 25% in a year | NRF 2025 | Improves experience; cost depends on the network |
| Restock faster | 49% of retailers take 6 to 10 days to restock; 19% say that is too slow | NRF 2025 | Protects resale value, not the rate |
| Use AI fraud screening | 85% of merchants use it; 45% say it works on its own | NRF 2025 | Mixed results for 40% |
Product page fixes are the cheapest place to start. Our ecommerce content optimization playbook has copy templates with a sizing block and a returns line built from the Baymard findings above.
Returns cost worksheet: estimate your own exposure
Benchmarks only matter once you price them for your store. This walkthrough uses an example apparel Shopify brand with $4 million in annual online revenue. Swap in your own numbers.
- Returned value. Revenue times your return rate. With Loop’s apparel benchmark of 14.5%: $4,000,000 x 14.5% = $580,000 returned.
- Processing cost. Returned value times Appriss’s 30% processing estimate: $580,000 x 30% = $174,000. Use your own pick, pack, shipping and inspection cost if you track it.
- Revenue kept. Returned value times your exchange and store credit rate. At Loop’s apparel retention rate of 23.2%: $580,000 x 23.2% = $134,560 kept, and $445,440 refunded (76.8%).
- Preventable loss. Returned value times Appriss’s 14.2% fraud and abuse share: $580,000 x 14.2% = $82,360. This overlaps with step 2, so do not add them together.
- Fee offset. Divide returned value by your average returned item value to get return count. At an assumed $80 per item: 7,250 returns. If half go by mail at Loop’s $8 average apparel handling fee: 3,625 x $8 = $29,000 recovered.
- Value of one point. Each percentage point of return rate on $4 million is $40,000 of returned goods and about $12,000 of processing cost. That is the ceiling on what a fit tool or product page fix is worth per point it removes.
The $80 item value and the 50% mail share are example assumptions, not benchmarks. If this math shows returns eating more margin than your ad budget, that is usually a product page and policy problem before it is a marketing one.
Which returns statistic to cite, and which to drop
| If you want to say | Cite | Avoid | Why |
|---|---|---|---|
| How much Americans return | NRF: $849.9B in 2025 (15.8%) | Mixing $849.9B with Appriss’s $706B as a trend | Different methods |
| The online return rate | NRF: 19.3% of online sales, 2025 | Round “30% of online orders” claims with no named dataset | No publisher, sample or year |
| How 2023 compares | NRF and Appriss 2023: $743B, labeled as a different method | A 2023 to 2024 growth rate | NRF says 2023 is not comparable |
| How much fraud costs | Appriss: $100B, 14.2% of 2025 returns | Comparing NRF’s 9% with Appriss’s 14.2% | One excludes abuse, one includes it |
| Return rates by category | Loop 2024, labeled vendor data for Shopify merchants | Category tables with no source or year | Category rates vary by sample |
| How many retailers charge fees | NRF: 72% of large merchants, 2025 | Loop’s Sept 2025 fee figures | Loop withdrew that release |
| Landfill impact | Optoro 2022 model, labeled historical | Quoting it as a current measured total | Vendor model, inputs not public |
| Cost to process a return | Appriss: about 30% of item value | Dollar ranges per return with no named study | Unsourced |
If returns are distorting your ecommerce margins and you want a second set of eyes on the product page and policy side, you can book a consultation.
Frequently asked questions
What percentage of products are returned?
US retailers estimated that 15.8% of 2025 sales would be returned, about $849.9 billion, in the National Retail Federation and Happy Returns survey of 358 large merchants. Appriss Retail, which measures returns from transaction data, put 2025 returns at $706 billion. In 2024 the NRF figure was 16.9%, or $890 billion.
What is the online return rate?
Retailers in the 2025 NRF and Happy Returns survey estimated 19.3% of online sales would be returned. In the measured 2023 study by NRF and Appriss Retail, online purchases came back at 17.6% against 10.02% for pure in-store purchases. Online orders made up 48% of 2025 returned dollars in Appriss data.
Which products have the highest return rates?
In Loop's data from more than 4,000 Shopify merchants (January to October 2024), swimwear had the highest return rate at 21.6%, followed by footwear at 15.9%, apparel at 14.5%, intimates at 13.4% and electronics at 13.3%. Cosmetics (3.4%) and home goods (1.8%) were lowest. This is vendor data, not a national average.
How much do product returns cost retailers?
Appriss Retail estimates processing a return costs about 30% of the item's value, roughly $211 billion across 2025 US returns. On top of that, about $100 billion, or 14.2% of returned value, was preventable loss from fraud and abuse. These costs come before markdowns on items that cannot be resold at full price.
What percentage of returns are fraudulent?
It depends on the definition. Merchants in the 2025 NRF survey estimated 9% of returns are fraudulent, excluding bracketing and wardrobing. Appriss Retail found 14.2% of 2025 returns were preventable loss, split into 12% abuse and 2% fraud. The 2024 Appriss and Deloitte study put fraudulent returns and claims at 15.14%.
Do retailers charge return fees now?
Yes. 72% of large US merchants in the 2025 NRF survey had started charging for at least one return option, up from 66% in 2024. H&M US deducts $5.99 from mail returns and J.Crew deducts $7.50 for its prepaid label. 57% of shoppers say they have stopped shopping with a retailer after it started charging.
How much returned merchandise ends up in landfills?
The most cited estimate is Optoro's: 9.5 billion pounds of US returns in landfills and 24 million metric tons of CO2, from its 2022 Impact Report. It is a vendor model built with Environmental Capital Group and updated in 2022, so treat it as a historical estimate rather than a measured current total.
Ecommerce & retail research