
Last reviewed: October 2026
Gartner and Forrester measure different companies, so their marketing budget benchmarks are not interchangeable. Gartner’s 2026 CMO Spend Survey puts marketing at 7.8% of company revenue for mostly $1 billion plus firms in North America and Europe, while Forrester’s benchmarks are client-only and B2B-focused. For a free, US cross-size dataset, The CMO Survey (Duke Fuqua, Deloitte, AMA) reports 9.0% of revenue, with a median of just 5%.
This page compares the benchmark sources marketing leaders actually use to justify spend: who publishes each one, who they survey, what the headline number really measures, what access costs, and where each one misleads. Then it shows how to triangulate them into a defensible budget for next year.
What are the main marketing budget benchmark sources?
The main sources are Gartner’s CMO Spend Survey, The CMO Survey from Duke Fuqua, Deloitte and the AMA, Forrester’s B2B marketing budget benchmarks, the IPA Bellwether Report for the UK, the B2B Marketing (Propolis) Community Index, and vendor reports such as HubSpot’s. Each surveys a different population and measures something slightly different, so the headline numbers rarely match.
The table below summarizes what each source is, based on the publishers’ own pages. Figures are the latest verified edition at the time of review.
| Source | Publisher | Who is surveyed (n) | Cadence | Headline metric (latest) | Access | Best use |
|---|---|---|---|---|---|---|
| CMO Spend Survey | Gartner | 401 CMOs and marketing leaders in North America, UK and Europe; vast majority over $1B revenue | Annual (fielded Jan to Mar 2026) | 7.8% of company revenue (2026) | Headlines free in press releases; full research for Gartner clients | Enterprise peer comparison, board decks |
| The CMO Survey | Duke Fuqua, Deloitte, American Marketing Association | 308 marketing leaders at US for-profit companies, 97% VP-level or above | Annual since 2025 (fielded January 2026) | 9.0% of revenue, 9.6% of company budget (2026) | Free PDFs | Cuts by sector, size, B2B vs B2C |
| B2B Marketing Budget Benchmarks and Budget Planning Guide | Forrester | B2B marketing decision-makers (Marketing Budgets Survey, 2025); sample not shown publicly | Annual | European B2B marketers report investing 9% of revenue (2025 blog) | Client-only reports; some figures in public blogs | B2B budget mix: programs, people, tech |
| Bellwether Report | IPA, compiled by S&P Global | Around 300 UK marketing professionals, drawn mainly from the top 1,000 UK companies | Quarterly | Net balance of +6.9% revising total budgets up (Q2 2026) | £140 non-members, £99 IPA members | UK direction of travel, not budget size |
| Propolis Community Index | B2B Marketing (Propolis) | 1,000+ CMOs and marketing leaders at $20m+ B2B firms in UK and US, five sectors | Continuous dashboard | Budget as % of revenue target, by sector | Members; demo required | Mid-market B2B peer cuts, UK sectors |
| State of Marketing | HubSpot (vendor) | Global marketers; sample not stated on landing page | Annual | No budget-level figure on the landing page | Free, gated by form | Channel and AI adoption trends |
If you want the actual spend numbers from these surveys pulled together in one place, our marketing budget benchmarks page and the companion CMO and marketing budget statistics for 2026 collect them. This page is about choosing and trusting the sources themselves.
Gartner CMO Spend Survey: what it measures and who it fits
Gartner’s CMO Spend Survey measures marketing budgets as a percentage of total company revenue among large enterprises. The 2026 edition surveyed 401 marketing leaders in North America, the UK and Europe, mostly at companies above $1 billion in revenue, and found budgets at 7.8% of revenue, up slightly from 7.7% in 2025.
According to the Gartner 2026 CMO Spend Survey press release, the survey ran January through March 2026. Other verified 2026 findings:
- CMOs allocate an average of 15.3% of marketing budgets to AI initiatives.
- 56% of CMOs say their organization lacks the budget to deliver its 2026 strategy, and 54% report insufficient resources.
- More AI-ready marketing organizations report budgets of 8.9% of company revenue, against the 7.8% average.
- Labor’s share of the marketing budget rose from 21.9% in 2025 to 24.5% in 2026, per a follow-up Gartner release.
The prior year’s 2025 release added that paid media made up 30.6% of marketing budgets, or 2.4% of company revenue.
Strengths: consistent methodology year over year, a recognizable name for CFOs and boards, and useful allocation data (labor, media, AI). Limits: the sample skews heavily to $1B+ companies, the public release reports averages without medians or spread, and the full research sits behind a Gartner subscription. If your firm does $20 million a year, Gartner tells you what large enterprises do, not what your peers do.
The CMO Survey: the free, broad-sample option
The CMO Survey is a free, non-commercial benchmark run out of Duke University’s Fuqua School of Business with Deloitte and the American Marketing Association. Its 2026 edition reports marketing at 9.0% of company revenue and 9.6% of overall company budgets, with breakouts by sector, revenue band, headcount and online sales share.
The details come from the survey’s own 2026 Highlights and Insights Report. The survey was in the field January 7 to 29, 2026. It invited 2,111 marketing leaders at US for-profit companies, and 308 responded, a 14.6% response rate. The survey started in 2008 and, per its about page, reports are free to practitioners, educators, students and press.
Three things make it the most useful public dataset for most firms:
- It shows the spread. The Topline Report gives a mean of 8.96% of revenue but a median of 5%, from 154 valid answers. Half of responding companies spend 5% or less.
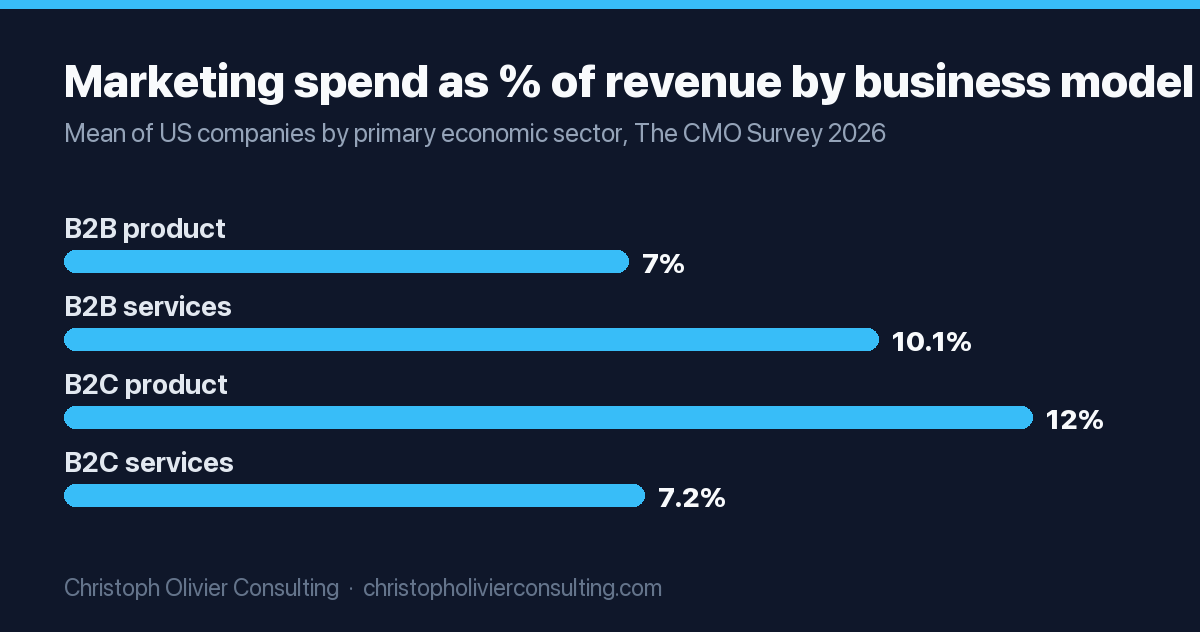
- It splits B2B from B2C. B2B product companies average 7.0% of revenue, B2B services 10.1%, B2C product 12.0% and B2C services 7.2%.
- It cuts by size. In the Firm and Industry Breakout Report, companies under $10 million average 13.3% of revenue and $10 to 25 million firms 17.4%, while $1 to 9.9 billion firms average 5.7%.
Limits: subgroup samples are small (the $10 to 25 million band has 15 answers; professional services, at 6.84% of revenue, has 12), it covers US companies only, and only about half of respondents answer the budget questions. Treat the subgroup numbers as directional.
Forrester B2B budget benchmarks and planning guides
Forrester publishes an annual B2B Marketing Budget Benchmarks report and a Budget Planning Guide for B2B marketing executives. Both draw on Forrester’s own budget surveys and break spend into programs, personnel and technology. The full reports are client-only, so most public Forrester figures come from analyst blog posts rather than the data tables.
The 2025 B2B Marketing Budget Benchmarks report, published December 24, 2025, asks how much B2B organizations invest in marketing as a percentage of revenue and how that differs by size and industry, using Forrester’s Marketing Budgets Survey, 2025. The page requires a client login and shows no figures. The Budget Planning Guide 2026 is also client-only.
The public numbers come from Forrester analyst Craig Moore’s July 2025 blog post, which reports:
- 83% of B2B marketing decision-makers expect increased investment over the next 12 months.
- In North America, 37% expect a budget increase of 5% or more.
- European B2B marketers report investing 9% of revenue in marketing.
- In Asia Pacific, just under half plan to invest 7.1% or more of revenue in marketing.
Strengths: B2B-specific, strong on how the budget splits between people, programs and martech. Limits: sample sizes are not public, and many third-party articles quote a single “Forrester average” that you cannot check without client access. If you cite Forrester to a CFO, cite the specific report and region, not a number you saw in someone’s blog.
UK benchmarks: IPA Bellwether and the Propolis Community Index
For UK budgets, the two most cited peer datasets are the IPA Bellwether Report and the B2B Marketing (Propolis) Community Index. Bellwether tracks whether roughly 300 large UK companies are revising budgets up or down each quarter. The Community Index tracks budget as a percentage of revenue target for $20m+ B2B firms in the UK and US.
IPA Bellwether Report
The Q2 2026 Bellwether Report is compiled by S&P Global for the Institute of Practitioners in Advertising, from a panel of around 300 UK marketing professionals drawn mainly from the top 1,000 UK companies. It costs £140 for non-members. In Q2 2026, 23.8% of respondents increased total marketing spend and 16.9% cut it, a net balance of +6.9%, with data collected June 1 to 23, as reported by MrWeb’s Daily Research News.
The catch: Bellwether is a diffusion index. It tells you how many big UK firms are raising or cutting budgets, not how large those budgets are. It is excellent for timing and mood, and useless for setting a percentage of revenue.
Propolis Community Index (B2B Marketing)
B2B Marketing describes the Propolis Community Index as data from 1,000+ CMOs and marketing leaders at $20m+ businesses in the UK and US across five B2B sectors, collected through an independent, anonymous process. Access is through Propolis membership and a demo. Its public 2026 B2B Marketing Forecast for tech marketers states that marketing budgets have fallen from 9% of revenue to 6% in two years in that sector.
Note the denominator: the Index reports budget against a revenue target, not last year’s actual revenue. That makes it forward-looking, and not directly comparable to Gartner or The CMO Survey.
Vendor reports and the SBA rule of thumb: handle with care
Vendor reports from marketing software companies, and rules of thumb attributed to the US Small Business Administration, are the most widely repeated budget numbers online. They are useful for channel and adoption trends, but they are weak benchmarks for budget size because samples, definitions and sources are often unclear.
HubSpot’s 2026 State of Marketing report is free behind a form, but its landing page does not state a sample size or a budget-as-percent-of-revenue figure. Use it for questions like which channels marketers are adding, not how much to spend.
The “SBA recommends 7% to 8% of revenue” rule appears on hundreds of sites. The SBA’s current marketing and sales guide does not state a percentage; it advises including “a complete breakdown of the costs of your marketing plan.” Until you can see it on an SBA page, do not present it to a CFO as official guidance. The CMO Survey’s small-company cuts are a better, checkable reference.
Gartner vs Forrester vs The CMO Survey: why the numbers differ
The numbers differ because each source surveys a different population and divides by a different denominator. Gartner surveys mostly $1B+ firms, The CMO Survey spans US companies of all sizes, Forrester covers B2B decision-makers, and the UK sources measure revisions or revenue targets. Sample size, averaging method and fieldwork dates also shift results.
The most common reasons two benchmarks disagree:
- Company size. Smaller firms spend a larger share of revenue. In The CMO Survey 2026, sub-$25 million companies average 13% to 17% of revenue, while $1 to 9.9 billion firms average 5.7%. A $1B+ sample like Gartner’s will read lower.
- Denominator. The CMO Survey reports both 9.0% of revenue and 9.6% of total company budget. The Community Index uses revenue target. Bellwether reports a net balance, not a share at all.
- Mean vs median. The CMO Survey’s mean is 8.96% but its median is 5%. A few heavy spenders pull averages up. Most press coverage reports only the mean.
- Business model. B2C product firms average 12.0% of revenue in The CMO Survey; B2B product firms average 7.0%.
- What counts as marketing. Some respondents include marketing salaries and martech; others count only program spend. Gartner’s data shows labor alone is 24.5% of the budget, so that choice moves the total a lot.
- Geography and timing. Gartner and The CMO Survey field in early 2026; Forrester’s public planning figures date from mid-2025.
So “Gartner says 7.8% and The CMO Survey says 9.0%” is not a contradiction. They are answers to different questions about different companies.
Which benchmark should you use?
Use the benchmark whose sample looks most like your company. Enterprises should anchor on Gartner. US mid-market and smaller firms should start with The CMO Survey’s size and sector cuts. UK B2B firms can add the Community Index if they have access, and use Bellwether for timing. Forrester fits B2B teams with a subscription.
| Your situation | Primary benchmark | Cross-check with | Watch out for |
|---|---|---|---|
| $1B+ enterprise, board reporting | Gartner CMO Spend Survey | The CMO Survey $1B+ bands | Averages only, no spread |
| US firm, $10M to $500M revenue | The CMO Survey size and sector cuts | Gartner for allocation mix | Small subgroup samples |
| B2B professional services firm | The CMO Survey B2B services and professional services rows | Forrester (if client), Community Index | Professional services row has only 12 answers |
| UK B2B, $20m+ revenue | Propolis Community Index (members) | Gartner (includes UK), Bellwether for direction | Revenue target denominator |
| UK enterprise or brand advertiser | IPA Bellwether for direction | Gartner for level | Net balance is not a budget size |
| Small business under $10M | The CMO Survey under $10M band | Your own unit economics | Unverified “SBA” rules of thumb |
For a wider set of B2B data points to put next to these, see our roundup of B2B marketing statistics.
How to model next year’s budget from benchmarks
Model next year’s budget by setting a benchmark range from two or three comparable sources, building a bottom-up plan from your revenue goal and funnel math, then reconciling the two. Benchmarks set the guardrails. Your own pipeline targets and customer acquisition costs set the actual number.
- Define your peer set. Write down revenue band, B2B or B2C, sector, and region. This decides which rows of which survey you use.
- Pull a floor, midpoint and ceiling. For example, a median as the floor, the closest-fit subgroup mean as the midpoint, and the highest relevant subgroup as the ceiling. Note the sample size beside each figure.
- Standardize the denominator. Convert everything to percent of last year’s or next year’s revenue, and state which. Do not mix revenue, company budget and revenue target figures in one table.
- Define what is in “marketing.” Decide whether salaries, agencies and martech are inside the number, because benchmarks like Gartner’s include labor.
- Build bottom-up. Start from the revenue target, work back through win rates, pipeline needed and cost per qualified opportunity to the program spend required. Add people and tools.
- Reconcile. If the bottom-up number sits far above the ceiling, check your assumptions or your growth target. If it sits far below the floor, ask whether you are underinvesting in reach.
- Set review triggers. Agree with finance on quarterly checkpoints and the metrics that release or hold back budget.
A fuller method, including the percentage-of-revenue, objective-and-task and competitive-parity approaches, is in our guide on how to set a marketing budget.
Worked example: triangulating a budget for a $20M B2B services firm
Here is a hypothetical $20 million US B2B professional services firm using three public benchmarks. The benchmarks produce a range of roughly $1.0 million to $2.0 million. The bottom-up plan then decides where in that range the firm lands. The firm and its plan are illustrative, not a client.
| Benchmark row | % of revenue | Implied budget on $20M | Sample caveat |
|---|---|---|---|
| The CMO Survey 2026, all companies, median | 5.0% | $1,000,000 | 154 answers, all sizes |
| The CMO Survey 2026, professional services mean | 6.84% | $1,368,000 | 12 answers |
| Gartner 2026 CMO Spend Survey average | 7.8% | $1,560,000 | Mostly $1B+ firms |
| The CMO Survey 2026, B2B services mean | 10.1% | $2,020,000 | 41 answers |
Reading the table: $1.0 million is a defensible floor and about $2.0 million a ceiling. The $10 to 25 million revenue band in The CMO Survey averages 17.4%, but with 15 answers spread across all sectors, it is better treated as a signal that smaller firms often spend more than as a target.
Next, the bottom-up check. Suppose the firm wants $4 million in new revenue, has an average engagement of $100,000 and wins 25% of qualified opportunities. It needs 40 wins, so 160 qualified opportunities. If it estimates program cost per qualified opportunity at $4,000, programs cost $640,000. Add two marketing salaries and tools at, say, $450,000, and the total is about $1.09 million, or 5.5% of revenue.
That lands inside the range, near the floor. The CFO conversation becomes concrete: “Our plan is 5.5% of revenue, above the median US company and below the B2B services average, and here is the pipeline math behind it.” That is a far stronger case than quoting one survey’s average.
The limits of any marketing budget benchmark
Benchmarks describe what other companies spent, not what your company should spend. They cannot see your margins, growth target, sales cycle or competitive position, and most rely on small, self-selected samples. Use them to sanity-check a plan and frame the CFO discussion, never as the plan itself.
A few honest caveats worth stating in any budget deck:
- Response rates are low. The CMO Survey’s is 14.6%, and only about half of respondents answer the budget questions.
- Averages hide spread. The CMO Survey’s standard deviation on percent of revenue is 11.45 points around a mean of 8.96%.
- Paywalled figures are hard to audit. If you cannot read the source table, you cannot confirm the sample or definition.
- Last year’s spending reflects last year’s conditions. The CMO Survey reports spending grew only 1.7% over the prior 12 months, the weakest rate since 2021.
In my experience, the budgets that hold up in a CFO review are the ones that show both the peer range and the pipeline math, with the sample sizes in plain sight. If you are building that model and want an outside view, our fractional CMO services include budget planning, and you can book a consultation to talk through your numbers.
Frequently asked questions
Is Gartner or Forrester better for marketing budget benchmarks?
It depends on your company. Gartner's CMO Spend Survey suits large enterprises because most respondents have over $1 billion in revenue, and its 2026 headline is 7.8% of revenue. Forrester is B2B-focused and strong on how budgets split across people, programs and technology, but its reports are client-only. Smaller firms often get more from The CMO Survey's free size and sector breakouts.
What is the Gartner CMO Spend Survey?
It is Gartner's annual survey of CMOs and marketing leaders in North America, the UK and Europe. The 2026 edition surveyed 401 leaders from January to March 2026, mostly at companies above $1 billion in revenue, and found marketing budgets at 7.8% of company revenue, up from 7.7% in 2025. Headline findings appear in free press releases.
How do I access real CMO spend data for free?
The CMO Survey, run by Duke Fuqua with Deloitte and the American Marketing Association, publishes its Highlights, Topline and Firm and Industry Breakout reports as free PDFs at cmosurvey.org. They include marketing spend as a percent of revenue and of company budget, cut by sector, revenue band and headcount. Gartner's press releases add free headline figures.
Why do Gartner and The CMO Survey report different marketing budget percentages?
They survey different companies. Gartner's sample is mostly $1 billion plus firms in North America and Europe, while The CMO Survey covers US companies of all sizes, and smaller firms spend a larger share of revenue. The CMO Survey also reports a median of 5% against a 9.0% mean, which shows how a few heavy spenders lift averages.
What is the most credible benchmark for UK B2B marketing budgets?
For budget size, the B2B Marketing Propolis Community Index covers 1,000+ marketing leaders at $20m+ B2B firms in the UK and US, but it requires membership and measures budget against revenue target. For direction, the quarterly IPA Bellwether Report tracks around 300 large UK companies. Gartner's survey also includes UK respondents.
Does the SBA recommend spending 7% to 8% of revenue on marketing?
The figure is widely attributed to the SBA, but the SBA's current marketing and sales guide does not state a percentage. It advises including a complete breakdown of your marketing plan's costs. Until you can cite an SBA page, use a checkable source such as The CMO Survey's small-company breakouts instead.
How should I use benchmarks to set next year's marketing budget?
Pick two or three sources whose samples match your size, model and region, and take a floor, midpoint and ceiling as a percent of revenue. Then build a bottom-up plan from your revenue goal, win rates and cost per qualified opportunity, and reconcile the two. Benchmarks set guardrails; your pipeline math sets the number.
More Fractional CMO guides
- CMO and Marketing Budget Statistics 2026: Verified Benchmarks From Gartner and The CMO Survey
- Fractional CMO Services: The Full Scope of What Gets Delivered
- When to Hire a Fractional CMO
- Fractional CMO Guide for 7-Figure Business
- What Is a Fractional CMO? Roles & Cost
- Marketing Director vs Fractional CMO
- All Fractional CMO guides →