

A consulting firm owner’s income depends almost entirely on firm size. Sole-proprietor consultants who made a profit netted an average of $52,304 in tax year 2023, per IRS Statistics of Income. A small employer firm earns far more: the average management consulting firm with $500,000 to $999,999 in receipts took in $691,211 in 2022 with about 3 employees, according to the Census Bureau’s Statistics of U.S. Businesses (my calculation from the published totals). On my worked models below, a full-time solo consultant clears about $170,000 before tax, a 5-person firm owner about $350,000 to $600,000, and a 15-person firm owner about $415,000 to $1 million. Utilization moves those numbers more than anything else.
Short answer: Most consulting “firms” are one person, and the typical one is part-time: the median U.S. nonemployer consulting business took in $10,000 to $24,999 in 2022 (Census). Profitable solo consultants net about $52,000 on average (IRS, 2023). Owners of small employer firms usually take home $150,000 to $600,000 a year, depending on headcount, rates and utilization (labeled model below). Public consulting firms earn 7.8% to 20.6% operating margins after paying their partners (2025 10-K filings).
Every figure below comes from a primary source: IRS tax returns, the Census Bureau’s employer and nonemployer files, the Bureau of Labor Statistics wage survey, and the annual 10-K reports of six listed consulting firms. Where I calculated an average or a ratio that the source does not print, I say so. The worked owner-income model is mine, and every assumption is listed under it so you can swap in your own numbers.
How much does a consulting firm owner make? What each primary source says
No government survey asks consulting firm owners what they pay themselves. Four datasets get close, and each measures something different. Read them together and the picture is clear: a large base of part-time solo consultants with modest income, and a much smaller group of employer firms where the owner earns a multiple of a staff consultant’s salary.
| Source and year | What it measures | Figure |
|---|---|---|
| IRS SOI, sole proprietorships, tax year 2023 | Average net income of profitable Schedule C filers in management, scientific and technical consulting (743,147 returns) | $52,304 (my calculation: $38.87B net income / 743,147 returns) |
| Same IRS table | Average net income across all 1,109,907 consulting sole proprietors, including those with losses | $30,371 (my calculation) |
| Census Nonemployer Statistics, 2022 | Average receipts of consulting businesses with no employees, NAICS 5416 (1,036,353 businesses) | $59,731 in receipts (my calculation) |
| Census SUSB, 2022 | Average receipts of a management consulting employer firm, NAICS 54161 (170,373 firms) | $2.04 million average; $1.04 million excluding the 1,026 firms above $100 million (my calculation) |
| BLS Occupational Outlook Handbook, May 2025 | Median wage of employed management analysts (consultants on payroll, not owners) | $101,860; top 10% above $171,640 |
| BLS OEWS industry table, May 2023 | Mean wage of chief executives employed by consulting firms, NAICS 541600 | $274,920 mean; $104.07 median hourly |
Two cautions. First, the IRS and nonemployer counts include a lot of side income: anyone who reports consulting fees on a Schedule C is in there, whether they billed for a weekend or a full year. Second, an S corporation owner’s salary shows up in Census payroll, not as profit, so no single dataset captures “owner pay” for incorporated firms. That gap is why the worked model further down matters.
How much does a CEO of a consulting firm make?
BLS counted 10,150 chief executives employed in management, scientific and technical consulting firms in May 2023, with a mean annual wage of $274,920 and a median of $104.07 an hour, per the OEWS industry table for NAICS 541600. That is W-2 pay only. Owner-CEOs of small firms usually take a mix of salary and profit distributions, which this survey does not record, and BLS excludes the self-employed from wage data entirely.
How much does a small consulting firm make?
The median consulting business is tiny. In the 2022 Census nonemployer file, 59.4% of the 1,036,353 consulting businesses with no employees took in under $25,000, and only 14.1% reached $100,000. Sole proprietorships made up 92.0% of them, S corporations 4.1% and partnerships 2.8%.
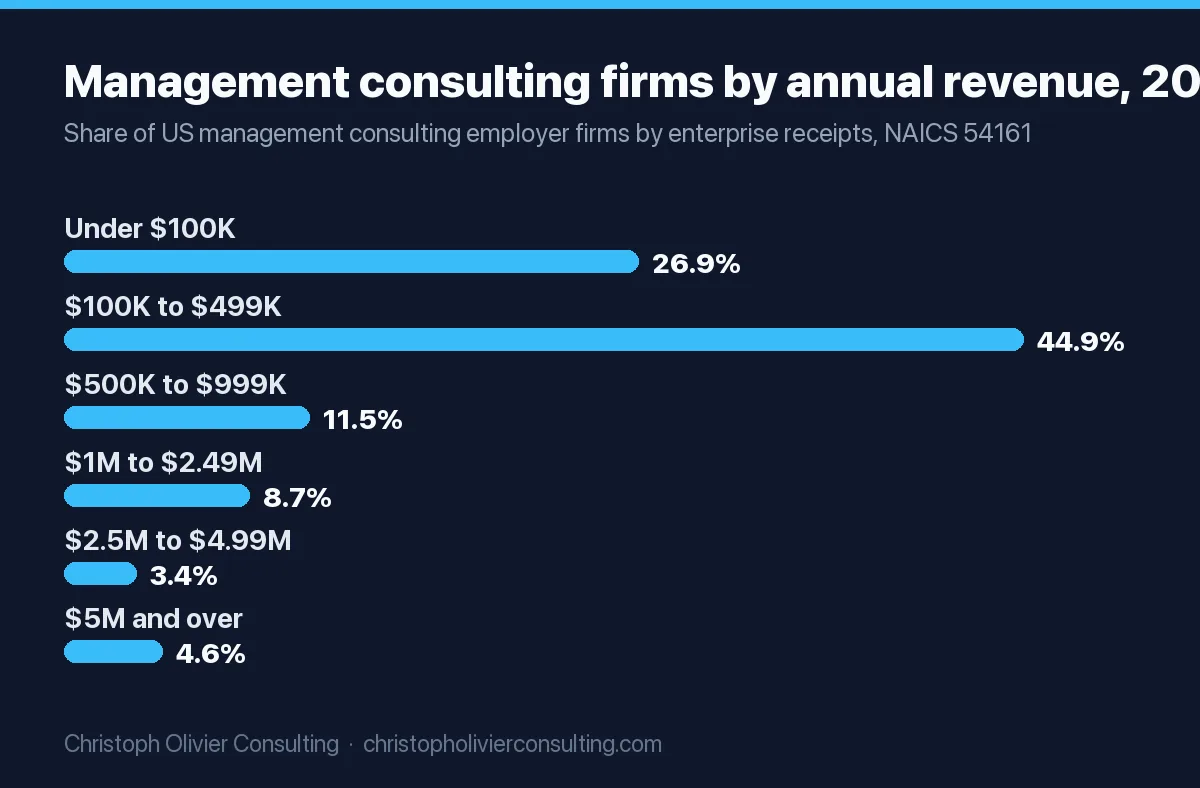
Employer firms are a different business. The table below is built from the Census SUSB 2022 file for NAICS 54161 (management consulting services). The averages, payroll share and revenue per employee are my calculations from the published totals.
| Firm receipts band (2022) | Share of firms | Cumulative | Average receipts | Employees per firm | Payroll as % of receipts | Receipts per employee |
|---|---|---|---|---|---|---|
| Under $100K | 26.9% | 26.9% | $48,003 | 0.9 | 54.3% | $54,532 |
| $100K to $499K | 44.9% | 71.8% | $237,816 | 1.4 | 37.4% | $164,402 |
| $500K to $999K | 11.5% | 83.3% | $691,211 | 3.2 | 35.1% | $214,547 |
| $1M to $2.49M | 8.7% | 92.0% | $1,523,790 | 6.7 | 35.6% | $227,446 |
| $2.5M to $4.99M | 3.4% | 95.4% | $3,400,106 | 13.6 | 35.1% | $250,222 |
| $5M and over | 4.6% | 100% | not combined | 24 and up | 35% to 48% | $242K to $300K |
Source: U.S. Census Bureau, SUSB 2022, NAICS 54161, 170,373 firms. Employment counts S corporation owners on payroll but not sole proprietors or partners. Bands are total enterprise receipts.
Three things in this table are useful when you price your own firm:
- 71.8% of employer consulting firms take in under $500,000. A firm crossing $1 million is already in the top 17%.
- Payroll settles at about 35% of receipts once a firm passes $500,000, and stays there up to $100 million. Payroll here is wages only, before benefits and payroll taxes.
- Receipts per employee run $214,000 to $250,000 in the $500K to $5M bands. If your firm bills less than about twice what you pay each consultant, you are below the typical small firm.
Consulting firm profit margin: three numbers people mix up
“Profit margin” in consulting means three different things, and benchmarks quoted without saying which one are hard to use. Separate them before you compare yourself to anyone.
1. Owner-inclusive margin (solo and very small firms). When the owner does the work, profit and pay are the same money. Consulting sole proprietors kept 50.2% of receipts as net income in tax year 2023, and the profitable ones kept 63.7%, per the IRS SOI table (my calculation: $38.87B net income on $61.0B receipts). Payroll was only 5.8% of their receipts.
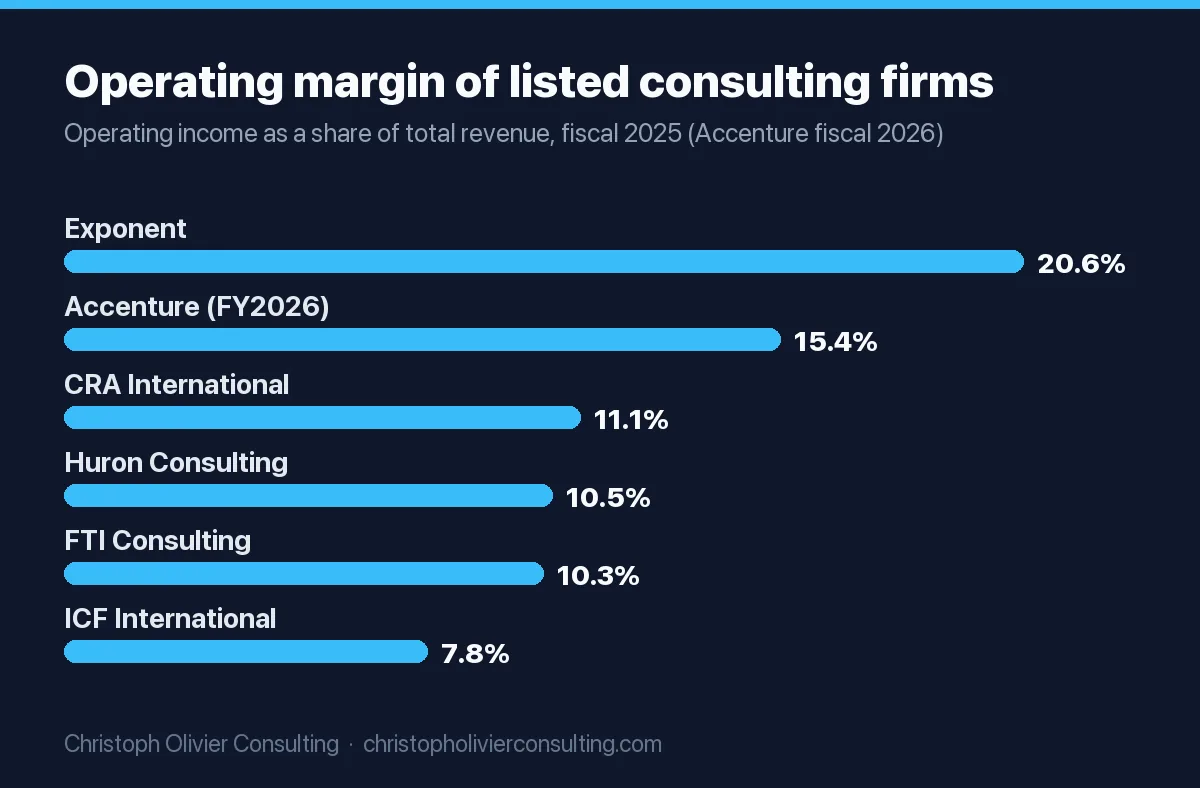
2. Operating margin after everyone is paid (larger firms). Public firms pay partners and managing directors as employees, so what is left is true profit. The 2025 filings below show 7.8% to 20.6%.
3. Gross margin on staff. Revenue minus the direct cost of the people who deliver the work. FTI Consulting reported $2.57 billion in direct cost of revenues on $3.79 billion in revenue in 2025, a gross margin of 32.1% (my calculation from the FTI 10-K).
| Firm (fiscal year) | Revenue | Operating income | Operating margin | Utilization disclosed |
|---|---|---|---|---|
| Exponent (2025) | $582.0M | $119.8M | 20.6% | 73%; compensation 58.8% of revenue |
| Accenture (FY2026, ended Aug. 31, 2026) | $74.18B | $11.41B | 15.4% | Not disclosed |
| CRA International (2025) | $751.6M | $83.1M | 11.1% | 77% (75% in 2024, 70% in 2023) |
| Huron Consulting (2025) | $1,699.1M | $178.6M | 10.5% | 75.7% (Consulting capability) |
| FTI Consulting (2025) | $3,788.9M | $389.1M | 10.3% | 57% to 60% (vacation counted as available time) |
| ICF International (2025) | $1,872.9M | $145.5M | 7.8% | Not disclosed |
Operating margins are operating income divided by total revenue (my calculation, except Accenture, which reports 15.4%). Huron revenue includes reimbursable expenses. Utilization definitions differ by firm.
The filings also show what a billable hour sells for at the top of the market. FTI’s average billable rate in 2025 was $529 an hour in Corporate Finance, $442 in Forensic and Litigation Consulting and $583 in Economic Consulting. CRA generated about $784,000 of revenue per consultant ($751.6 million across 959 consultants at year end, my calculation). Exponent sets its bonus pool at 33% of income before income taxes, interest income, bonus expense and stock-based compensation, per its 10-K: a public example of how a firm shares profit with the people who produce it.
What is a good profit margin for a consulting firm?
Use the margin that matches your structure. If you are solo, the IRS benchmark is 63.7% for profitable consulting sole proprietors; if you keep less than half your receipts, your overhead or subcontractor costs are high. If you have staff and pay yourself a market salary, compare your remaining profit to the public firms: 10% to 11% is what CRA, Huron and FTI earned in 2025, and Exponent’s 20.6% is the high end of the listed group. A small firm that clears 15% to 25% after a market owner salary is doing better than most listed firms.
Is a 40% profit margin high? Is 70% too high?
For a firm with employees, a 40% margin is high only if the owner’s own pay has already been deducted. Before owner pay, it is normal: the 5-person model below lands at 41%. For a solo consultant, 70% is not unusual: profitable consulting sole proprietors averaged 63.7% in the IRS data, because there is almost no payroll. A 70% margin at a firm with a team usually means the owner is underpaying themselves on paper or the team is under-resourced.
Consulting firm owner income at three sizes (worked calculation)
This is my own model, not survey data. It answers the question the datasets cannot: what an owner actually clears at a given size. Staff salaries use the BLS May 2025 management analyst median of $101,860 and the 90th percentile of $171,640 for senior managers. Utilization levels are anchored to what CRA (77%), Huron (75.7%) and Exponent (73%) disclosed in their 2025 10-Ks, set lower for a small firm.
| Line (own calculation) | Solo consultant | 5-person firm | 15-person firm |
|---|---|---|---|
| Team | Owner only | Owner + 4 consultants | Owner + 10 consultants + 2 senior managers + 2 operations staff |
| Consultant hours billed (2,080-hour year) | 1,144 owner hours (55%) | 1,352 each (65%) | 1,352 each (65%); seniors 1,248 (60%) |
| Rates | $175/hr | Staff $175; owner $250 | Staff $175; seniors $250; owner $300 |
| Owner billable hours | 1,144 | 832 (40%) | 520 (25%) |
| Revenue | $200,200 | $1,154,400 | $3,146,000 |
| Staff wages | $0 | $407,440 | $1,491,880 |
| Payroll taxes and benefits (25% of wages, assumption) | $0 | $101,860 | $372,970 |
| Overhead: rent, software, insurance, travel, marketing (assumption) | $30,030 (15%) | $173,160 (15%) | $566,280 (18%) |
| Owner income before tax | $170,170 | $471,940 | $714,870 |
| Owner income as % of revenue | 85.0% | 40.9% | 22.7% |
| If staff utilization falls to 55% | n/a | $348,180 | $416,390 |
| If staff utilization rises to 75% | n/a | $595,700 | $1,013,350 |
| Staff wages as % of revenue (Census benchmark: about 35%) | 0% | 35.3% | 47.4% |
Assumptions, stated plainly. A 2,080-hour work year (40 hours times 52 weeks). Billing rates of $175 to $300 an hour are illustrative inputs, not sourced market rates: replace them with yours. The 25% benefits and payroll-tax load and the 15% to 18% overhead rates are my assumptions. Non-billable operations staff are set at $65,000 each, also an assumption. Overhead scales with revenue in this model; in real firms rent and software are partly fixed, which makes the downside worse than shown. Income is before income tax and, for the solo case, before self-employment tax.
Two readings matter more than the totals. First, a 10-point drop in staff utilization cuts the 15-person owner’s income by 42%, from $714,870 to $416,390, because salaries do not fall when the bench fills up. Second, the 15-person firm’s wage bill runs 47% of revenue against the Census small-firm norm of about 35%: at $175 an hour and 65% utilization, a $101,860 consultant brings in only about 2.3 times their salary. Firms in the Census data are either billing more per hour or keeping people busier.
How much of that is salary and how much is profit?
Subtract what you would cost to replace. If the 5-person owner hired a senior manager at the BLS 90th-percentile wage of $171,640 plus the same 25% load ($214,550), the remaining true profit is $257,390, or 22.3% of revenue. That sits above the 10% to 11% that CRA, Huron and FTI earned in 2025 and near Exponent’s 20.6%, which is a reasonable check that the model is not fantasy, but also a sign that small-firm owners carry concentration risk the public firms spread across thousands of clients.
Solo consultant revenue at different rates and utilization (own calculation)
For a one-person firm, annual revenue is rate times 2,080 hours times the share of hours you bill. Most solo consultants bill well under 60%, because selling, admin and delivery overhead all come out of the same calendar.
| Hourly rate | 40% billed (832 hrs) | 50% billed (1,040 hrs) | 60% billed (1,248 hrs) |
|---|---|---|---|
| $100 | $83,200 | $104,000 | $124,800 |
| $150 | $124,800 | $156,000 | $187,200 |
| $200 | $166,400 | $208,000 | $249,600 |
| $250 | $208,000 | $260,000 | $312,000 |
| $300 | $249,600 | $312,000 | $374,400 |
Multiply your cell by 0.637, the share profitable IRS consulting sole proprietors kept in 2023, for a data-anchored estimate of pre-tax net income. At $150 an hour and 50% billed, that is about $99,400. If your rate is the problem rather than your hours, the pricing strategy guide covers how to move to value-based or tiered fees.
Utilization: the lever that moves owner pay most
CRA, FTI, Huron and Exponent all name utilization in the risk factors of their 10-Ks, and the model above shows why. Here is how the disclosed numbers compare, and what they mean for a small firm:
- Know which definition you are using. Huron excludes vacation and holidays from available hours and reported 75.7% for its Consulting capability in 2025. FTI counts vacation and training as available time and reported 57% to 60%. The same team can look 15 points different depending on the formula.
- Set a target by role, not one number for the firm. In the model, staff bill 65%, senior managers 60% and the owner 25% to 40%. An owner billing 80% of their week has no time to sell the next project.
- Track the bench weekly. CRA’s 10-K warns that when a large engagement ends early, consultants “could be underutilized until we assign them to other projects.” In a 5-person firm, one ended project can take 20% of capacity offline overnight.
- Fill the pipeline before you hire. Each $101,860 consultant costs about $127,325 loaded in the model. At $175 an hour, they need roughly 728 billed hours a year just to cover their own cost before overhead (my calculation). A steady lead source matters more than the hire; this guide to how consultants get their first clients covers the early pipeline.
How consulting firm owners pay themselves: salary vs distributions
The legal structure changes how owner income is taxed, which changes what “salary” means.
- Sole proprietors and single-member LLCs pay self-employment tax on net earnings of $400 or more at 15.3% (12.4% Social Security plus 2.9% Medicare), per IRS Topic 554. The Social Security part stops at an annual wage base that changes each year; Medicare applies to all net earnings.
- S corporation owners must pay themselves reasonable compensation before taking distributions. The IRS says that when gross receipts come from the shareholder’s own personal services, payments “should be classified as wages.” Its reasonable compensation page lists the factors it weighs, including training and experience, duties, time devoted to the business, what comparable businesses pay for similar services, and payments to non-shareholder employees.
- Partnerships pass profit through to partners. Only 2.8% of nonemployer consulting businesses were partnerships in 2022 (Census), but they averaged $233,601 in receipts against $49,725 for sole proprietorships, the highest of any legal form (my calculation).
For an S corporation consultant, the BLS figures above are the natural comparables: a $101,860 median for management analysts, $171,640 at the 90th percentile, and a $274,920 mean for chief executives in consulting firms. Check your own facts with a CPA; this is not tax advice.
Copy-ready owner pay worksheet
Fill in your own numbers in this order:
- Annual revenue = sum over each billable person of (hourly rate × 2,080 × utilization %).
- Staff cost = total wages × (1 + your benefits and payroll-tax load).
- Overhead = rent + software + insurance + unbilled travel + marketing + professional fees.
- Owner pool = revenue minus staff cost minus overhead.
- Owner market salary = what you would pay someone to do your job (use the BLS figures above as a floor), including load.
- True profit = owner pool minus owner market salary. Divide by revenue and compare with 10% to 21% (2025 public firms).
- Stress test: rerun step 1 with utilization 10 points lower. If the owner pool falls below your market salary, you are one lost client away from paying to work.
Marketing is the overhead line most small firms guess at. If you are deciding whether to hire a part-time marketing lead, this breakdown of fractional CMO cost shows what the role runs, and the marketing agency profit margin benchmarks are a useful comparison for any firm that sells hours.
Is consulting a high paying industry?
For employees, yes by national standards. Management analysts earned a median of $101,860 in May 2025, about twice the $50,980 median for all occupations, per the BLS Occupational Outlook Handbook. In the professional, scientific and technical services industry specifically, their median was $107,330. BLS also reports that 14% of management analyst jobs in 2025 were held by self-employed workers, a group whose income BLS does not survey.
For owners, the answer splits. The IRS average for profitable solo consultants ($52,304) is below the employee median, because many filers consult part-time. Owners who build a staffed firm past about $1 million in receipts, which only 17% of employer firms reach, are where the large incomes sit. For context on how this compares with other sectors, see the profit margin by industry data.
Is consulting being replaced by AI?
The official projection does not show it. BLS projects management analyst employment to grow 10% from 2025 to 2035, “much faster than the average for all occupations,” with about 94,100 openings a year. Individual firm results vary: FTI’s Economic Consulting revenue fell 16.5% in 2025 while its Corporate Finance revenue rose 11.5%, per its 10-K, which reflects demand shifts between practices rather than a single cause. No primary source I found measures how much consulting work AI has displaced.
How these figures were compiled
- IRS: Table 1, Nonfarm Sole Proprietorships, tax year 2023 (published March 2026), row “Management, scientific, and technical consulting services.” Averages and margins are my calculations from totals. The IRS does not publish S corporation or partnership data at this industry detail.
- Census SUSB 2022: NAICS 54161, employer firms by enterprise receipts size, released April 10, 2025. Shares, averages and per-employee figures are my calculations. Receipt bands are total enterprise receipts, which can include other industries.
- Census Nonemployer 2022: NAICS 5416 (management, scientific and technical consulting, a broader group than 54161), decoded with the Census record layout.
- BLS: OOH management analysts, May 2025 wages and 2025 to 2035 projections. Industry chief executive wages are from the May 2023 OEWS table, the latest industry release I could retrieve.
- SEC filings: 10-K reports for fiscal 2025 (Accenture fiscal 2026), figures from the filings and SEC XBRL data. Margins are operating income over total revenue.
- Owner model: my own calculation with every assumption listed above. Not a survey or a client result.
If you own a consulting firm and the worksheet shows a thin owner pool, the fix is usually rate, utilization or pipeline, in that order. I work with owners on the pipeline side; you can book a consultation if that is the bottleneck.
Ready to scale your revenue?
Book a free 30-min consultation. We’ll diagnose your growth bottleneck and map out the 3 highest-leverage moves for your business.
Frequently asked questions
How much does a consulting firm owner make?
It depends on size. Profitable consulting sole proprietors netted an average of $52,304 in tax year 2023 (IRS). In my worked model, a full-time solo consultant billing 55% of a 2,080-hour year at $175 clears about $170,000 before tax, a 5-person firm owner $348,000 to $596,000, and a 15-person firm owner $416,000 to $1 million, with staff utilization driving the spread.
How much does a small consulting firm make?
Census data for 2022 show 71.8% of U.S. management consulting employer firms take in under $500,000 a year. Firms in the $500,000 to $999,999 band average $691,211 with about 3 employees, and the $1 million to $2.49 million band averages $1.52 million with about 7. The median consulting business with no employees took in $10,000 to $24,999.
What is a good profit margin for a consulting firm?
Match the margin to your structure. Profitable solo consultants kept 63.7% of receipts as net income in 2023 (IRS), because there is almost no payroll. Firms with staff should pay the owner a market salary first, then compare what is left with listed firms: CRA, Huron and FTI earned 10% to 11% operating margins in 2025 and Exponent 20.6%.
What are typical consulting business profit margins?
Public consulting firms reported operating margins of 7.8% (ICF) to 20.6% (Exponent) in their 2025 10-K filings, with Accenture at 15.4% for fiscal 2026. FTI Consulting's gross margin after the direct cost of its professionals was 32.1%. Solo consultants show much higher margins, 50.2% on average and 63.7% for profitable filers, because profit and owner pay are the same money.
How much does a CEO of a consulting firm make?
Chief executives employed by U.S. management, scientific and technical consulting firms earned a mean of $274,920 a year and a median of $104.07 an hour in May 2023, according to BLS OEWS industry data for NAICS 541600. That covers W-2 pay only. Owner-CEOs of small firms usually add profit distributions, which the survey does not record.
Is consulting a high paying industry?
For employees, yes. Management analysts earned a median of $101,860 in May 2025, about twice the $50,980 median for all U.S. occupations (BLS). For owners it depends on scale: the average profitable solo consultant nets $52,304, while owners of staffed firms above about $1 million in receipts, roughly 17% of employer firms, earn several times that.
How should a consulting firm owner pay themselves?
Sole proprietors take net profit and pay 15.3% self-employment tax on it, up to the Social Security wage base for the 12.4% part. S corporation owners must pay reasonable compensation as wages before distributions; the IRS weighs training, duties, time devoted and what comparable businesses pay. BLS consultant wages of $101,860 to $171,640 are useful comparables. Confirm with a CPA.
Practice economics benchmarks