

A mortgage brokerage owner’s income ranges from under $50,000 for a part-time solo broker to $300,000 or more for an owner running a staffed shop that closes around 100 loans a year. The typical firm is small: in 2022 the average mortgage and loan brokerage with employees took in $1.9 million, but 66% of those firms brought in less than $500,000, according to the Census Bureau’s Statistics of U.S. Businesses (NAICS 522310). What the owner keeps depends on loan count, the compensation rate the owner negotiates with wholesale lenders, and how much of each loan goes to loan officers.
Short answer: A broker owner earns lender-paid or borrower-paid compensation on each closed loan, usually a fixed percentage of the loan amount. At 2.0% on the 2025 average loan of $371,965 (MBA), that is about $7,440 per loan before splits and costs. In my own model, a solo owner closing 24 loans a year keeps about $125,500 before tax, and an owner with two loan officers closing 100 loans keeps about $312,000. Employed loan officers earn a median $76,690 (BLS, May 2025).
No government agency publishes “mortgage broker owner salary” as a single number. So this page pulls the datasets that measure pieces of it: Census receipts and payroll for brokerages, Census and IRS data on self-employed brokers, BLS wages for loan officers, the Mortgage Bankers Association’s lender profit reports, UWM’s 10-K for the wholesale channel, and the Regulation Z rules that cap how brokers are paid. Where a number is my calculation, it is labeled. The owner model and a copy-ready worksheet are further down.
How much does a mortgage broker owner make? What each source measures
Each source counts a different group. Read the “what it measures” column before you compare yourself to any one figure.
| Source and year | What it measures | Figure | How it was calculated |
|---|---|---|---|
| Census SUSB 2022, NAICS 522310 | Revenue per mortgage and nonmortgage loan brokerage with employees | $1,903,330 | $18,330,974,000 receipts ÷ 9,631 firms (my calculation) |
| Census SUSB 2022, NAICS 522310 | Average payroll per employee at those firms | $91,842 | $6,980,233,000 payroll ÷ 76,003 employees (my calculation) |
| Census Nonemployer Statistics 2022, NAICS 5223 | Revenue per credit intermediation business with no paid employees (includes solo mortgage brokers) | $80,412 | $1,664,280,000 ÷ 20,697 businesses (my calculation) |
| IRS SOI Table 1, tax year 2023 | Net income per sole proprietorship return, credit intermediation and related activities, returns with a profit | $34,174 | $1,061,875,000 net income ÷ 31,073 returns (my calculation) |
| BLS Occupational Outlook Handbook, May 2025 | Median wage of employed loan officers (all lenders, not only brokers). Excludes self-employed owners | $76,690 | Published. Bottom 10% under $39,430, top 10% over $153,180 |
| MBA Annual Mortgage Bankers Performance Report, 2025 | Pre-tax net production profit per loan at independent mortgage banks (lenders, not brokers) | $785 per loan (21 bps) | Published by MBA, April 16, 2026 |
Three things explain why these numbers sit so far apart:
- Census employer data is the best measure of a brokerage business. It covers every loan brokerage with a payroll, from a two-person shop to the largest firms. NAICS 522310 also includes nonmortgage loan brokers (business and consumer loans), and the Census does not split them out at this level.
- The average is pulled up by a few large firms. The 77 firms with $100 million or more in receipts took 47.5% of the industry’s revenue (my calculation). The median employer firm sits in the $100,000 to $499,999 band.
- Solo and part-time brokers pull the self-employed numbers down. More than half (52.5%) of credit intermediation nonemployers took in less than $25,000 in 2022 (my calculation from the same Census file). Many are side businesses, not full-time practices.
How much do self-employed mortgage brokers make?
The IRS and Census publish self-employed data only for the broader credit intermediation group (NAICS 522 in the IRS table, 5223 in the Census table), which includes mortgage brokers along with other lenders and loan brokers. In tax year 2023, 44,821 sole proprietors in that group reported $3.68 billion in receipts and $674 million in net income: an average of $82,012 in receipts and $15,043 in net income per return, an 18.3% net margin. The 69% who made a profit averaged $90,304 in receipts and kept $34,174, a 37.8% margin (my calculations from IRS SOI Table 1).
On the Census side, only 17.9% of the 20,697 credit intermediation nonemployers took in $100,000 or more in 2022, and 230 cleared $1 million. A full-time solo broker closing two loans a month would sit in that top fifth. Owners who run their brokerage as an S corporation or partnership are not in the IRS sole proprietor table at all.
Mortgage brokerage revenue by firm size
This is the Census view of brokerages with employees, by annual receipts. Employees per firm, revenue per employee and payroll share are my calculations from the same file.
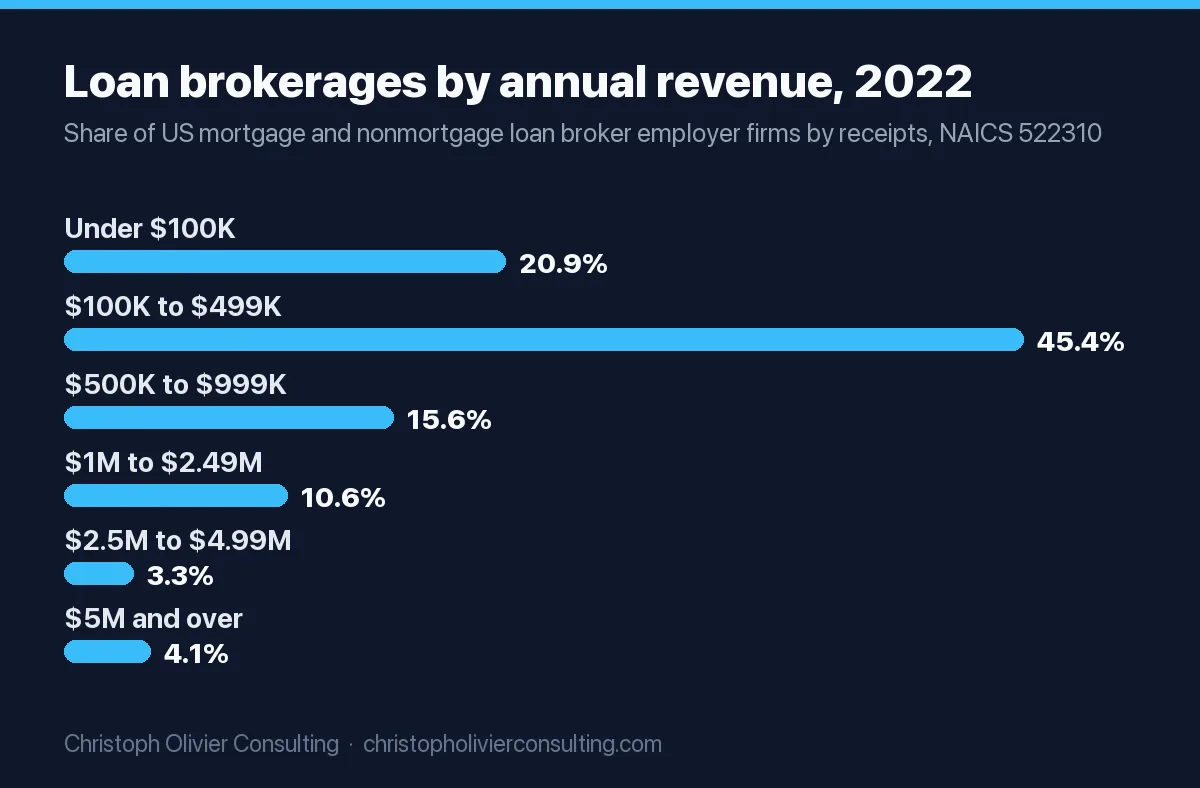
| Annual receipts band (2022) | Firms | Share of firms | Average revenue | Employees per firm | Revenue per employee | Payroll as % of revenue |
|---|---|---|---|---|---|---|
| Under $100,000 | 2,017 | 20.9% | $51,238 | 0.9 | $55,924 | 53.2% |
| $100,000 to $499,999 | 4,372 | 45.4% | $253,420 | 1.9 | $132,499 | 37.2% |
| $500,000 to $999,999 | 1,504 | 15.6% | $705,715 | 3.9 | $182,559 | 36.5% |
| $1M to $2.49M | 1,023 | 10.6% | $1,510,452 | 7.1 | $211,786 | 36.6% |
| $2.5M to $4.99M | 320 | 3.3% | $3,442,203 | 15.6 | $220,566 | 37.7% |
| $5M and over | 395 | 4.1% | $33,953,367 | 120.7 | $281,230 | 38.4% |
| All employer firms | 9,631 | 100% | $1,903,330 | 7.9 | $241,188 | 38.1% |
Source: U.S. Census Bureau, SUSB 2022, NAICS 522310, released April 10, 2025. The $5M and over row is the total minus the published bands below it (my calculation). Receipts bands are total enterprise receipts.
The useful pattern: once a brokerage passes $100,000 in revenue, W-2 payroll runs between 36.5% and 38.4% of revenue in every band. What grows with size is revenue per employee, from about $132,500 in the smallest staffed shops to $220,600 in the $2.5 million to $4.99 million band. For an owner, that is the efficiency number to watch. Census defines payroll as all compensation paid to employees, including commissions and the pay of corporate officers; it excludes the profit of proprietors and partners of unincorporated businesses. Contractors paid on a 1099 are not employees, so their pay is not in it either.
How much does a mortgage broker make per loan?
Federal rules set the shape of broker pay. Under Regulation Z, 12 CFR 1026.36(d), a loan originator’s compensation cannot be based on a term of the transaction, such as the interest rate. A fixed percentage of the loan amount is allowed, and it “may be subject to a minimum or maximum dollar amount.” The same section bans dual compensation: if the borrower pays the broker directly, the lender cannot also pay the broker on that loan. The CFPB describes the common structures as salary, a flat amount per loan, a percentage of the loan amount, or a mix.
There is also a ceiling on most loans. For a loan to be a qualified mortgage, total points and fees cannot exceed 3% of the loan amount for loans of $137,958 or more in 2026, per 12 CFR 1026.43(e)(3) and the CFPB’s 2026 threshold adjustment. Lender-paid compensation to a mortgage broker counts toward that total under 12 CFR 1026.32(b)(1)(ii). So on a qualified mortgage, the broker’s compensation plus the other counted fees has to fit under 3%. Non-QM loans are not bound by that cap.
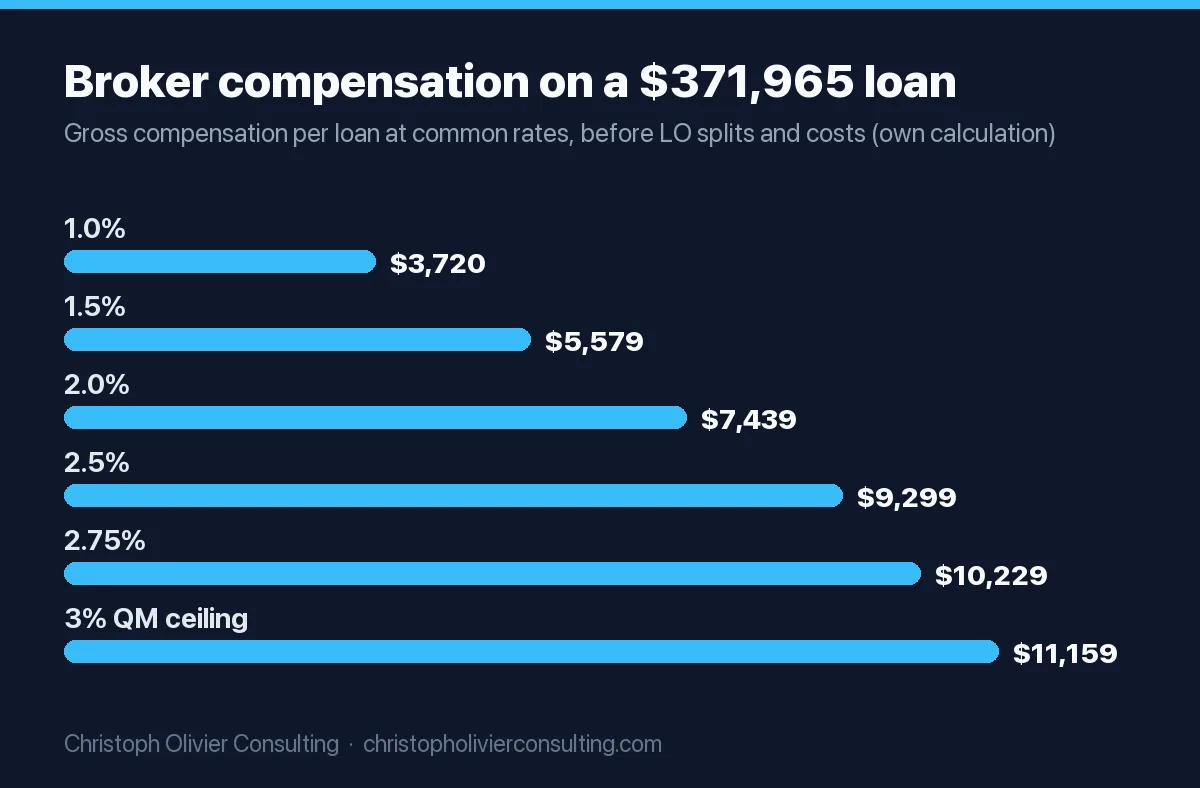
Actual compensation rates are set in each broker’s agreement with each wholesale lender and are not published as an industry average. NerdWallet reports a typical 1% to 2% of the loan amount. UWM, the largest wholesale lender, says in its 2025 10-K that the compensation it pays brokers is built into the purchase price of each loan, but it does not disclose the rate. The table shows gross compensation per loan at common rates (my calculation).
| Loan amount | 1.0% | 1.5% | 2.0% | 2.5% | 2.75% | 3% QM ceiling (all points and fees) |
|---|---|---|---|---|---|---|
| $250,000 | $2,500 | $3,750 | $5,000 | $6,250 | $6,875 | $7,500 |
| $371,965 (MBA 2025 average first mortgage) | $3,720 | $5,579 | $7,439 | $9,299 | $10,229 | $11,159 |
| $500,000 | $5,000 | $7,500 | $10,000 | $12,500 | $13,750 | $15,000 |
Own calculation. Gross compensation to the brokerage, before loan officer splits, processing and overhead. Average loan balance from the MBA 2025 Annual Performance Report; UWM reported a $388,000 average loan amount for 2025 in its 10-K.
How much does a mortgage broker make on a $500,000 mortgage?
Gross compensation is $5,000 at 1%, $10,000 at 2% and $13,750 at 2.75%. On a qualified mortgage, the 3% points and fees limit caps the broker’s compensation plus other counted fees at $15,000. What the owner keeps is smaller. If a loan officer sourced the loan on a 50% split, a 2% loan pays the brokerage $10,000, the loan officer $5,000, and a contract processor perhaps $750, leaving about $4,250 to cover rent, software, licensing and marketing (my illustrative assumption, not a survey figure).
What percentage do mortgage brokers usually make?
Most broker pay is quoted as a percentage of the loan amount, because Regulation Z allows a fixed percentage but bans pay that varies with the rate or other loan terms. NerdWallet’s reported range is 1% to 2%. The legal frame is: a fixed percentage per lender agreement, optional minimum and maximum dollar amounts, either borrower-paid or lender-paid on a given loan but never both, and a 3% points and fees ceiling on qualified mortgages of $137,958 or more in 2026.
Mortgage broker profit margin: broker vs lender
Brokers and lenders run on different math. A lender funds the loan, sells it and earns production revenue on the whole loan. The MBA reported that independent mortgage banks earned $11,879 in production revenue per loan in 2025 and spent $11,094, leaving a pre-tax net production profit of $785 per loan, or 21 basis points. That is a 6.6% production margin (my calculation). Since 2008 the annual average has been 45 basis points, or $1,031 per loan, per the same MBA release. The picture moves fast: in the third quarter of 2026, lenders lost an average of $30 per loan, a swing from a $973 profit in the second quarter, as reported by Scotsman Guide from the MBA’s quarterly report.
A broker’s revenue is the compensation line in that lender’s economics. The broker carries no warehouse line, no hedging and no secondary market risk, so a broker’s margin is measured on a much smaller revenue base. The Census data shows that after W-2 payroll, about 62% of a brokerage’s revenue remains for every other cost plus owner profit (my calculation: 100% minus the 38.1% payroll share). No public dataset reports the full expense structure of mortgage brokerages, so there is no published average net margin for brokers specifically. For context on how finance businesses compare with other sectors, see the profit margin by industry data.
How profitable is a mortgage broker?
Profitable self-employed owners in the credit intermediation group kept 37.8% of receipts as net income in tax year 2023 (IRS, my calculation), but 31% of those filers reported a loss. Profit depends on volume, and volume depends on the rate cycle. UWM’s 10-K notes that roughly 2 of every 10 loans are originated through the wholesale (broker) channel and that UWM alone closed 42.5% of wholesale loans in the first nine months of 2025. UWM works with more than 13,000 independent broker businesses and 57,000 associated loan officers, of which about 35,000 submitted a loan in 2025. That gap suggests many broker loan officers close little or nothing in a given year.
Mortgage broker owner income at three sizes (own calculation)
This model is my own calculation, not a survey or a client result. It uses one compensation rate for every loan so you can see the structure; replace each assumption with your numbers.
Assumptions: average loan $371,965 (MBA 2025); lender-paid compensation 2.0% = $7,439 per loan; loan officers keep 50% of compensation on loans they source; processors paid $50,020, the BLS May 2025 median for loan interviewers and clerks; payroll taxes and benefits at 12% of wages; other costs are round illustrative figures.
| Line | A: Solo owner-originator | B: Owner + 2 loan officers + 1 processor | C: Owner + 8 loan officers + 4 staff |
|---|---|---|---|
| Loans closed per year | 24 (all owner) | 100 (owner 40, LOs 60) | 400 (owner 40, LOs 360) |
| Gross compensation revenue | $178,543 | $743,930 | $2,975,720 |
| Census band it falls in | Nonemployer, top 18% | $500K to $999K (avg $705,715) | $2.5M to $4.99M (avg $3,442,203) |
| Loan officer commissions (50% of LO loans) | $0 | $223,179 | $1,339,074 |
| Processing and operations staff | $18,000 (contract, $750 a file) | $50,020 | $225,060 (3 processors + $75,000 ops/compliance) |
| Payroll taxes and benefits (12%) | $0 | $32,784 | $187,696 |
| Licensing, LOS, pricing engine, credit and tech | $12,000 | $30,000 | $90,000 |
| Marketing and lead costs | $15,000 | $45,000 | $120,000 |
| Office, travel and other | $8,000 | $36,000 | $90,000 |
| Accounting, legal, insurance | included above | $15,000 | $40,000 |
| Owner earnings before owner salary and income tax | $125,543 | $311,947 | $883,890 |
| Owner earnings as % of revenue | 70.3% | 41.9% | 29.7% |
| Staff payroll as % of revenue (excluding owner) | n/a | 41.1% | 58.9% |
What the model shows:
- Margin falls as you add loan officers, but dollars rise. Every loan an LO closes sends half the compensation out the door, so the owner earns about $2,000 to $2,500 on an LO loan versus about $5,000 to $6,500 on a loan the owner closes personally.
- Model C runs well above the Census payroll share. Census puts payroll at 37.7% of revenue for firms in that band; my model is at 58.9%. Either typical firms pay LOs a smaller share, earn more per loan than 2.0%, use contractors that do not appear in W-2 payroll, or some combination. If your staff cost is above 50% of revenue, the owner pool shrinks quickly.
- Volume is the dominant variable. In model B, each 10 loans the owner adds or loses moves owner earnings by about $74,400 at 2.0%, because the owner’s own loans carry almost no variable cost.
How much of that is salary and how much is profit?
“Owner earnings” in the table is the pool before the owner pays themselves. How it splits depends on the entity. A sole proprietor or single-member LLC owner pays self-employment tax of 15.3% (12.4% Social Security plus 2.9% Medicare) on net earnings, per IRS Topic 554. An S corporation owner must pay “reasonable compensation” as W-2 salary before taking distributions, per the IRS. For a broker owner who also originates loans, the BLS loan officer wage range ($76,690 median, $153,180 at the 90th percentile in May 2025) is a reasonable public reference point for the salary part; the rest is profit from owning the business. Get a CPA to set the actual figure.
Mortgage broker owner pay worksheet (copy and fill in)
- Average loan amount (L): your trailing 12 months. Benchmark: $371,965 (MBA 2025).
- Blended compensation rate (r): weighted across your lender agreements. Gross per loan = L × r.
- Owner-closed loans per year (No) and LO-closed loans per year (Nlo).
- Revenue = (No + Nlo) × L × r.
- LO cost = Nlo × L × r × your LO split.
- Staff cost = processor and ops wages × 1.12 (or your actual tax and benefit load).
- Fixed costs = licensing and NMLS renewals, LOS and pricing engine, insurance, rent, accounting.
- Marketing cost per closed loan = annual marketing ÷ total loans.
- Owner earnings = revenue minus lines 5 to 8. Split into reasonable salary plus distributions with your CPA.
Then check the result against public benchmarks. The pass and review thresholds are my judgment, anchored to the source in the last column:
| Check | Pass | Review | Benchmark source |
|---|---|---|---|
| Staff payroll as % of revenue | 40% or less | Over 50% | Census SUSB 2022: 36.5% to 38.4% for firms over $100K |
| Revenue per employee | Above your Census band’s figure | Below $132,500 | Census SUSB 2022 by receipts band |
| Compensation plus other counted fees on QM loans | Under 3% of loan amount | At or over 3% | 12 CFR 1026.43(e)(3), 2026 threshold $137,958 |
| Pay structure | Fixed % per lender, no rate-based pay, one payer per loan | Any pay tied to rate or terms | 12 CFR 1026.36(d) |
| Owner-closed share of revenue | You know the number and it is falling by plan | Over 70% with no LO pipeline | Own model: owner loans carry about 2.5x the margin of LO loans |
| Marketing cost per closed loan | Tracked monthly by source | Unknown | Own model: $625 (A) to $450 (B) per loan |
If marketing cost per loan is the line you cannot fill in, start there. The mortgage marketing playbook covers which channels produce funded loans, the mortgage advertising examples show what Regulation Z allows in ads, and the mortgage broker referral fee rules explain why you cannot simply pay agents for referrals under RESPA.
Who makes more money, a realtor or a mortgage broker?
Among employees, loan officers out-earn real estate agents. BLS reports a May 2025 median of $76,690 for loan officers, $73,220 for real estate brokers and $52,830 for real estate sales agents (BLS OOH). Those wage figures exclude the self-employed, and BLS notes most real estate brokers and agents are self-employed, so they do not capture owner income on either side. For the business side, compare this page with the real estate brokerage revenue and margin data: both businesses pay out most of each transaction’s fee to the producer who brought it in.
On outlook, BLS projects loan officer employment to grow 1% from 2025 to 2035, with about 17,100 openings a year. It also says that the increased use of productivity-enhancing technology in loan processing is expected to slow employment growth, which matters for owners planning processor headcount. The NMLS counted about 358,000 federally registered mortgage loan officers as of September 30, 2025, as cited in UWM’s 10-K.
How these figures were compiled
- Census SUSB 2022: NAICS 522310, Mortgage and Nonmortgage Loan Brokers, employer firms by enterprise receipts size, released April 10, 2025. Averages, shares, per-employee figures and payroll ratios are my calculations. The industry includes nonmortgage loan brokers.
- Census Nonemployer Statistics 2022: published only at NAICS 5223 (activities related to credit intermediation), a broader group than mortgage brokers. Size bands decoded with the Census record layout.
- IRS SOI: Table 1, Nonfarm Sole Proprietorships, tax year 2023, row “Credit intermediation and related activities.” Averages and margins are my calculations. S corporations and partnerships are not included.
- BLS: Occupational Outlook Handbook, May 2025 wages and 2025 to 2035 projections for loan officers, real estate brokers and agents, and loan interviewers and clerks.
- MBA: 2025 Annual Mortgage Bankers Performance Report as published in MBA NewsLink; Q3 2026 results as reported by Scotsman Guide. These describe lenders, not brokers.
- Regulation Z: 12 CFR 1026.32, 1026.36 and 1026.43, plus the CFPB’s 2026 threshold adjustments in the Federal Register of December 15, 2025.
- UWM Holdings 10-K for fiscal 2025, filed February 25, 2026.
- Owner model: my own calculation with every assumption listed. Not a survey or a client result.
Broker owners I talk to usually know their compensation rate to the basis point and their marketing cost per funded loan not at all. If that second number is the gap, you can book a consultation and we can work through it.
Ready to scale your revenue?
Book a free 30-min consultation. We’ll diagnose your growth bottleneck and map out the 3 highest-leverage moves for your business.
Frequently asked questions
How much does a mortgage broker owner make?
It depends on loan count and splits. In my own model at 2.0% compensation on the 2025 MBA average loan of $371,965, a solo owner closing 24 loans a year keeps about $125,500 before tax, and an owner with two loan officers closing 100 loans keeps about $312,000. Profitable self-employed owners in the IRS credit intermediation group averaged $34,174 in net income in tax year 2023.
How much does a mortgage broker make per loan?
Gross compensation is a fixed percentage of the loan amount set in each lender agreement. On the 2025 average loan of $371,965, that is $3,720 at 1%, $7,439 at 2% and $10,229 at 2.75% (my calculation). On qualified mortgages of $137,958 or more in 2026, compensation plus other counted points and fees must stay under 3% of the loan amount.
How much does a mortgage broker make on a $500,000 mortgage?
Gross compensation is $5,000 at 1%, $10,000 at 2% and $13,750 at 2.75%. On a qualified mortgage, the 3% points and fees limit caps compensation plus other counted fees at $15,000. If a loan officer sourced the loan on a 50% split, the brokerage keeps about half before processing, software, licensing and marketing costs.
What is the profit margin of a mortgage broker?
No public dataset reports a broker-only net margin. Census data for 2022 shows W-2 payroll takes 38.1% of brokerage revenue, leaving about 62% for other costs and owner profit. Profitable sole proprietors in the IRS credit intermediation group kept 37.8% of receipts in tax year 2023. Lenders are thinner: MBA reported a 21 basis point production profit in 2025.
How much do self-employed mortgage brokers make?
Census and IRS report self-employed data only for the broader credit intermediation group. Nonemployer businesses averaged $80,412 in receipts in 2022, and only 17.9% took in $100,000 or more. Sole proprietors with a profit averaged $90,304 in receipts and $34,174 in net income in tax year 2023 (my calculations from IRS SOI).
Who makes more money, a realtor or a mortgage broker?
Among employees, loan officers earn more. BLS reports May 2025 medians of $76,690 for loan officers, $73,220 for real estate brokers and $52,830 for real estate sales agents. These figures exclude self-employed workers, so they do not measure owner income on either side.
What percentage do mortgage brokers usually make?
Compensation is usually a fixed percentage of the loan amount, because Regulation Z bans pay based on the interest rate or other loan terms. NerdWallet reports a typical 1% to 2%. Lenders may set minimum and maximum dollar amounts, a broker cannot be paid by both borrower and lender on one loan, and qualified mortgages cap total points and fees at 3%.
Practice economics benchmarks