

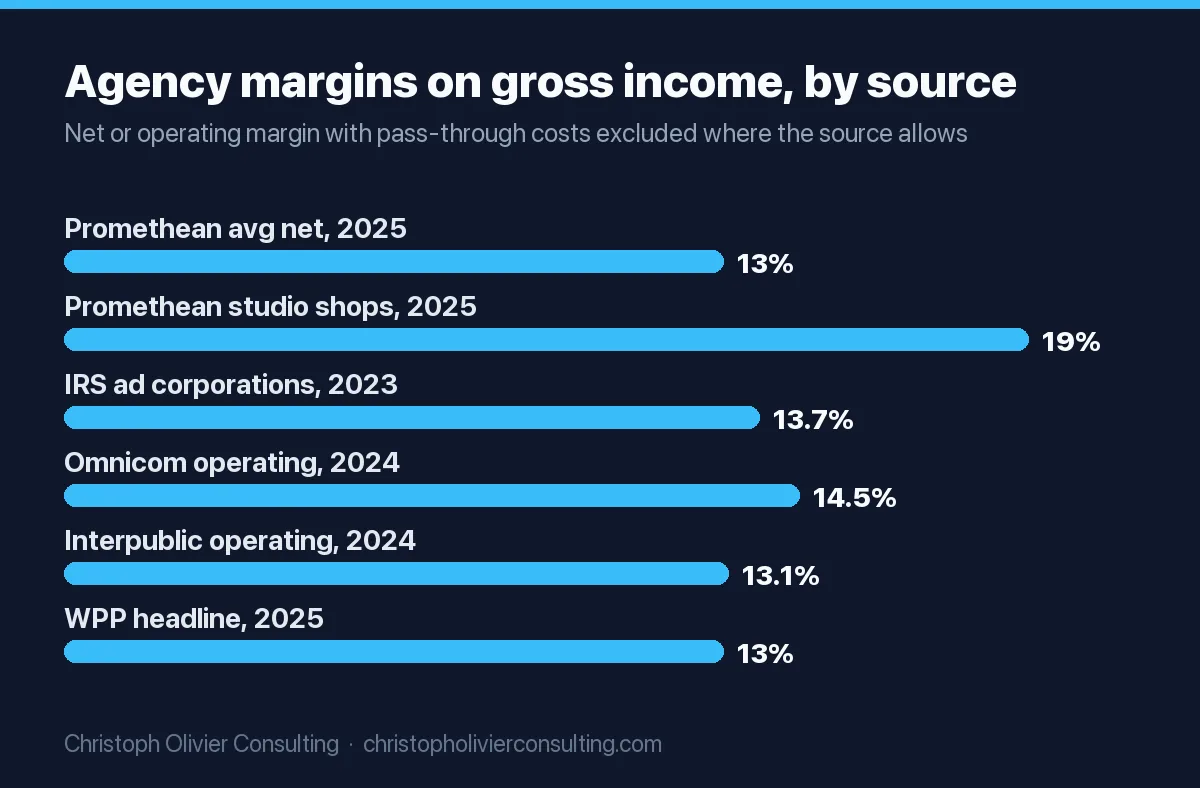
The average marketing agency keeps about 13 cents of net profit from each dollar of revenue. Promethean Research’s 2026 State of Digital Services report found net margins slipped to 13% in 2025, with small studio shops at 19%. IRS tax data tells a similar story once pass-through media costs are stripped out: advertising corporations reported net income equal to 13.7% of their gross income in 2023, by our calculation. The big holding companies land in the same band, roughly 13% to 16% on an adjusted basis.
Short answer: A typical marketing or advertising agency earns a 10% to 15% net profit margin after paying the owner a market salary. 13% is the most recent survey average (2025). 20% is good, and 20% to 30% is the target agency advisor Karl Sakas sets for well run shops. Always measure margin on agency gross income (revenue minus pass-through media and production costs), not on total billings.
The trouble with most numbers you will find online is that nobody says what they are measuring. A “40% margin” is usually a project or delivery margin. A “7% margin” is often net income divided by gross billings that include client media. This page lines up every credible figure with its definition, adds our own calculations from Census and IRS files, and ends with a P&L worksheet you can fill in for your own agency.
Marketing agency profit margin benchmarks: every source side by side
There are three kinds of evidence: practitioner surveys of independent agencies, government data covering every agency in the US, and the audited filings of the publicly traded holding companies. Here is what each one says, with the exact measure behind it.
| Source | Who is measured | Measure | Figure | Year |
|---|---|---|---|---|
| Promethean Research, 2026 SoDS | Independent digital agencies (survey) | Average net margin, reported | 13% | 2025 |
| Promethean Research, 2026 SoDS | Studio size shops (smallest cohort) | Average net margin, reported | 19% | 2025 |
| IRS Statistics of Income, Table 5.1 | 64,899 advertising and related services corporations | Net income / total receipts (our calculation) | 7.6% | Tax year 2023 |
| IRS Statistics of Income, Table 5.1 | Same corporations | Net income / (receipts minus cost of goods sold) (our calculation) | 13.7% | Tax year 2023 |
| Omnicom earnings release | Omnicom Group | Operating income margin, reported | 14.5% | 2024 |
| Interpublic 10-K | Interpublic Group (pre-merger) | Operating income / revenue before billable expenses (our calculation) | 13.1% | 2024 |
| WPP 2025 preliminary results | WPP plc | Headline operating margin on revenue less pass-through costs, reported | 13.0% | 2025 |
| Sakas & Company | Independent agencies under 100 employees | Net margin target after market-rate pay (advisor guidance, not a measured average) | 20% to 30% | Updated January 2026 |
Read the table this way: when the denominator excludes pass-through costs, independent agencies, the IRS universe and the holding companies all cluster between 13% and 15%. The 7.6% IRS figure is low only because total receipts include media and production the agency buys on the client’s behalf. The 19% studio figure is likely high partly because in a very small shop the owner’s pay is a large share of costs, and how much of it gets booked as salary versus profit moves the result.
Agency gross income vs revenue: why pass-through media wrecks the math
Agencies that buy media, printing, production or influencer fees for clients run that money through their books. It shows up as revenue, then leaves again as a cost the agency never keeps. Measuring margin on that number makes every agency look thin.
The large networks solve this by reporting a second revenue line. WPP calls it “revenue less pass-through costs”: £10,176m in 2025 against total revenue of £13,550m. Interpublic called it “revenue before billable expenses”: $9,187.6m in 2024 against total revenue of $10,691.7m, per its 2024 10-K. Independent agencies usually call it agency gross income (AGI) or net revenue.
A worked example shows the size of the distortion:
| Line | Agency A (services only) | Agency B (same team, also places media) |
|---|---|---|
| Total billings / revenue | $1,000,000 | $2,500,000 |
| Pass-through media and production | $0 | $1,500,000 |
| Agency gross income | $1,000,000 | $1,000,000 |
| Labor, overhead, owner salary | $870,000 | $870,000 |
| Net profit | $130,000 | $130,000 |
| Margin on billings | 13.0% | 5.2% |
| Margin on gross income | 13.0% | 13.0% |
Illustrative figures. Both agencies are equally profitable; only the denominator differs. If you compare your margin to a benchmark, make sure both use gross income.
What the Census data says about advertising agency costs
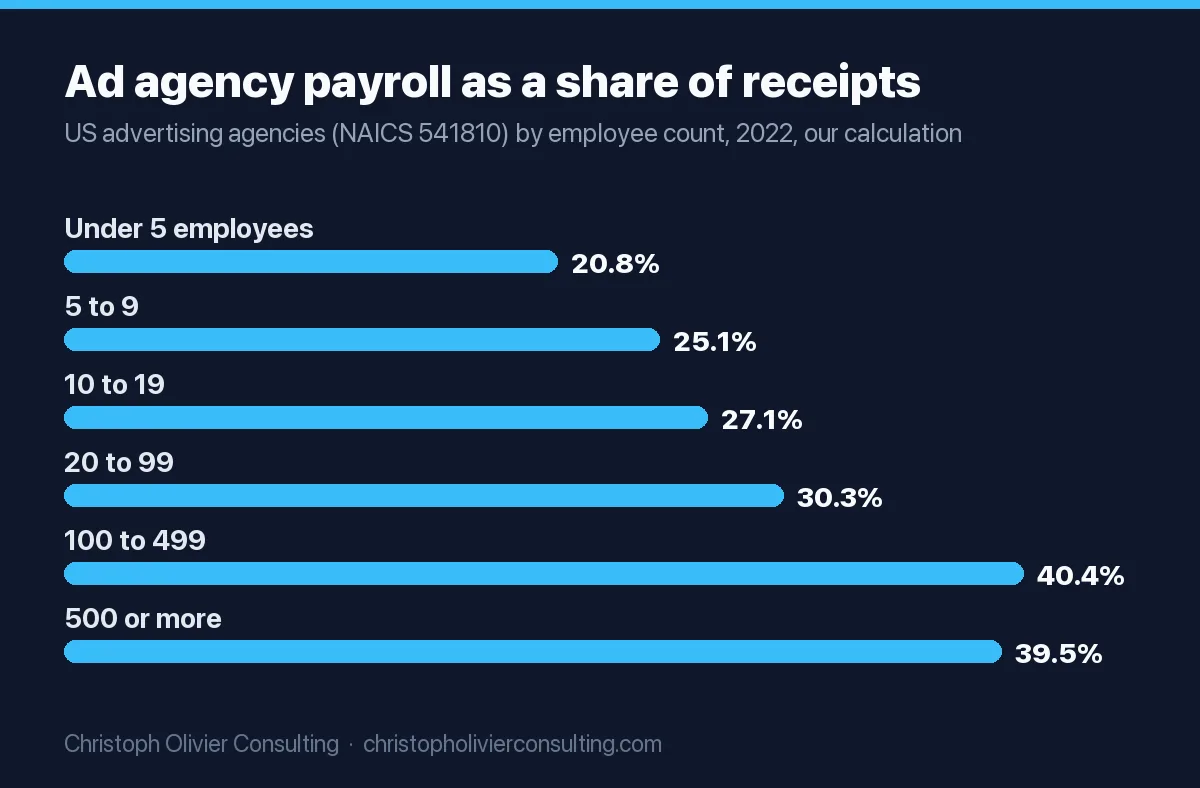
The Census Bureau does not publish agency profits, but its Statistics of US Businesses (SUSB) 2022 file reports receipts and payroll for every employer firm. That lets you compute the single biggest cost ratio in an agency: payroll as a share of receipts. We downloaded the national file and calculated the ratios below for NAICS 541810 (Advertising Agencies). These are our calculations from Census data, not Census figures.
| Firm size (employees) | Firms | Average receipts per firm | Receipts per employee | Payroll as % of receipts |
|---|---|---|---|---|
| Under 5 | 9,620 | $521,704 | $372,867 | 20.8% |
| 5 to 9 | 1,690 | $1,849,936 | $280,293 | 25.1% |
| 10 to 19 | 1,101 | $3,849,742 | $287,341 | 27.1% |
| 20 to 99 | 977 | $12,049,911 | $307,793 | 30.3% |
| 100 to 499 | 198 | $48,263,556 | $296,371 | 40.4% |
| 500 or more | 96 | $267,062,250 | $300,126 | 39.5% |
| All advertising agencies | 13,682 | $4,337,865 | $303,923 | 34.6% |
Source: US Census Bureau, SUSB 2022, file us_state_6digitnaics_2022.txt, NAICS 541810, national rows. Receipts and payroll are reported in thousands of dollars; ratios and averages are our calculations. In the 2017 edition of the same file, payroll was 36.9% of receipts and receipts per employee were $237,778, so receipts per head rose about 28% in five years (nominal dollars) while the payroll share fell.
Two things stand out. First, payroll share climbs with size, from about 21% in the smallest firms to about 40% in agencies with 100 or more people. That matches the survey finding that net margin is highest in the smallest shops. Second, small firm payroll looks low because it leaves out the owner of an unincorporated business (who takes a draw, not wages) and freelancers, who are paid as contractors. In a three person agency, the owner’s draw and the contractor bench are often the two biggest costs, and neither shows up as payroll.
Digital marketing agency profit margin: what NAICS 541613 shows
Many digital and performance agencies register as Marketing Consulting Services (NAICS 541613) instead of advertising agencies. The same SUSB 2022 file shows 49,047 such firms, average receipts of $1,621,628 per firm, and payroll at 29.1% of receipts (our calculation). Firms with under 5 employees averaged $395,427 in receipts with payroll at 22.0%. For comparison, PR agencies (NAICS 541820) run payroll at 43.8% of receipts and media buying agencies (541830) at 25.6%, the latter because more of their receipts are media dollars.
One caveat: we could not confirm how consistently agencies separate client media from their own fees when they report receipts to Census, so treat these ratios as a sense of scale, not a precise margin.
What the IRS tax data shows: 7.6% of receipts, 13.7% of gross income
The closest thing to an official profit figure is the IRS Statistics of Income corporate data. Table 5.1 for tax year 2023 has a column for Advertising and Related Services (all NAICS 5418 corporations, C corps and S corps). We pulled the income statement lines and computed each as a share of total receipts and of gross income.
| Line (tax year 2023) | Amount | % of total receipts | % of gross income |
|---|---|---|---|
| Total receipts | $188.2 billion | 100% | |
| Cost of goods sold (for agencies, typically media, production and subcontracted work) | $83.5 billion | 44.4% | |
| Gross income (receipts minus cost of goods sold) | $104.6 billion | 55.6% | 100% |
| Salaries and wages | $34.5 billion | 18.3% | 32.9% |
| Compensation of officers | $5.1 billion | 2.7% | 4.8% |
| Rent paid | $3.4 billion | 1.8% | 3.3% |
| The agencies’ own advertising | $4.4 billion | 2.3% | 4.2% |
| Other deductions | $29.0 billion | 15.4% | 27.7% |
| Net income (less deficit) | $14.3 billion | 7.6% | 13.7% |
Source: IRS SOI, Returns of Active Corporations, Table 5.1, tax year 2023, money amounts in thousands, rounded here. Percentages are our calculations. The table covers corporations only, so sole proprietors and partnerships are excluded, and net income is after losses at unprofitable firms.
Officer compensation is only 4.8% of gross income, which tells you that most corporate agency profit is earned by firms where owners are a small part of the payroll. Add officer compensation back and you get 18.5% of gross income going to owners and profit combined (our calculation), a useful upper reference for “owner earnings” in a corporate agency.
How profitable is an advertising agency at holding-company scale?
Public holding companies are the only agencies whose margins are audited. Their margins are not higher than a well run independent’s, and in 2025 they fell sharply because of merger and restructuring charges.
| Company and year | Revenue | Operating profit | Reported margin | Adjusted margin |
|---|---|---|---|---|
| Omnicom 2024 | $15,689.1m | $2,274.6m | 14.5% | 15.5% adjusted EBITA |
| Omnicom 2025 | $17,271.9m | $444.7m | 2.6% | 15.6% adjusted EBITA |
| Interpublic 2024 | $10,691.7m total; $9,187.6m before billable expenses | $1,203.2m | 11.3% of total revenue (our calculation) | 13.1% of revenue before billable expenses (our calculation) |
| WPP 2024 | £14,741m; £11,359m less pass-through | £1,325m reported; £1,707m headline | 9.0% | 15.0% headline |
| WPP 2025 | £13,550m; £10,176m less pass-through | £382m reported; £1,321m headline | 2.8% | 13.0% headline |
Omnicom’s 2025 operating income fell to $444.7 million because it booked $1.2 billion of repositioning costs and $347.3 million of IPG acquisition related costs around the Interpublic deal, which closed on November 26, 2025, according to its fourth quarter release. Strip those out and the adjusted margin held at 15.6%. WPP’s headline staff costs, excluding incentives, were £7,398m in 2024, or 65.1% of revenue less pass-through costs (our calculation from its 2024 results). That is the labor ratio of a network agency; independents typically run lower.
The lesson for an independent owner: a 13% to 15% margin on gross income is what the largest agencies in the world earn in a normal year. Beating it is possible, but it takes pricing power or a lean delivery model, not just scale.
How much do marketing agency owners make?
Owner income has two parts: salary for the work you do, and profit distributions for owning the business. Karl Sakas, who advises agency owners, writes that an owner of an independent agency with under 100 employees should pay themselves between $150,000 and $500,000 a year in salary, that he rarely sees salaries above $500,000, and that total compensation including distributions can reach $1 million or more. He also notes agencies tend to spend 50% to 60% of revenue on labor, including owner, employee and key contractor pay, and sets a target of 20% to 30% net profit after everyone is paid market rate.
Here is what that means in dollars. The model below combines Sakas’s labor range with Promethean’s 13% average net margin and a 20% “good” margin. It is our illustration, not survey data.
| Agency gross income | Owner salary (assumed) | Profit at 13% net | Total owner take at 13% | Total owner take at 20% |
|---|---|---|---|---|
| $500,000 | $120,000 | $65,000 | $185,000 | $220,000 |
| $1,000,000 | $150,000 | $130,000 | $280,000 | $350,000 |
| $2,500,000 | $225,000 | $325,000 | $550,000 | $725,000 |
| $5,000,000 | $300,000 | $650,000 | $950,000 | $1,300,000 |
Assumes one owner, salary booked as a cost before profit, and profit fully distributed (in practice owners keep a cash reserve and pay tax on pass-through profit). The $500,000 row sits below Sakas’s $150,000 salary floor on purpose: at that size, the Census data shows the average advertising agency with under 5 employees takes in about $521,704 a year, which is not enough to pay a full market salary and a 13% profit at the same time. That is why so many solo and very small agency owners earn less than an employee would.
Two quick checks on your own number. If your total take is far below salary plus 13% of gross income, you are underpricing or overstaffed. If your profit looks great but your salary is $60,000, you have not reached a real margin yet; you have just moved your pay into the profit line. Pricing is usually the fastest fix: see what marketing agencies charge for comparable retainers, and how many accounts you need by looking at how many clients a marketing agency has at each size.
Agency P&L benchmark worksheet
Copy this into a spreadsheet and fill in the last column with trailing twelve month numbers. Every benchmark is tied to a source above; where a source gives a range, the range is shown.
| Line | How to calculate | Benchmark | Source | Your agency |
|---|---|---|---|---|
| 1. Total billings | Everything invoiced | n/a | ||
| 2. Pass-through costs | Media, printing, production, ad spend you resell | 44.4% of receipts across all US ad corporations | IRS SOI 2023 | |
| 3. Agency gross income | Line 1 minus line 2. All ratios below use this. | 100% | ||
| 4. Total labor | Owner salary, staff pay and benefits, core contractors | 50% to 60% | Sakas & Company | |
| 5. Payroll only (W-2) | Wages excluding owner draw and contractors | 21% to 30% of receipts under 100 staff; 35% overall | Census SUSB 2022, NAICS 541810 | |
| 6. Production utilization target | Billable hours / available hours, delivery team | 72% average target | Promethean Research, 2024 report | |
| 7. Overhead | Rent, software, insurance, marketing, admin | Whatever is left after labor and profit; check rent near 3% | IRS SOI 2023 (rent 3.3% of gross income) | |
| 8. Net profit | Line 3 minus labor and overhead, owner on market salary | 13% average; 19% small studios; 20% to 30% target | Promethean 2026; Sakas | |
| 9. Owner earnings | Owner salary plus line 8 (single owner) | $150,000 to $500,000 salary, plus distributions | Sakas & Company | |
| 10. Gross income per employee | Line 3 / full-time equivalents | About $304,000 receipts per employee (all US ad agencies) | Census SUSB 2022 (our calculation) |
How to use it:
- Pull a trailing twelve month P&L, not a single month, so retainer timing and annual software bills even out.
- Move all media and resold costs into line 2, even if your bookkeeper put them in expenses. Your margin should never be calculated on line 1.
- Replace your actual owner pay with what you would pay someone to do your job. If you pay yourself $60,000 but the role is worth $180,000, deduct $180,000.
- Compare line 8 to the benchmark. Under 10% means pricing or utilization needs work. 13% to 20% is normal to good. Over 25% after a market salary is excellent.
- If line 4 is above 60%, look at utilization (line 6) and scope creep before cutting rates or people.
Is a 40% profit margin high for an agency?
It depends on which margin. A 40% net margin after a market owner salary is roughly three times the 13% survey average and well above the 20% to 30% target, so it is very high and rarely sustained. A 40% delivery margin (project or retainer fee minus the direct labor cost of the people who delivered it) is on the low side, because overhead, sales time, non-billable staff and owner pay still have to come out of it. Most “is 40% good” debates are two people using different definitions.
Is 30% profit margin too high?
Not for an agency. 30% net is the top of the range Sakas sets as an ideal target. Clients do not see your margin, only your price; a 30% margin usually comes from specialization and efficient delivery rather than overcharging. Promethean’s 2026 report found agencies that raised rates grew faster, and that agencies narrowing their services produced standout results on both growth and margin.
Is 30% markup the same as 30% margin?
No. Markup is profit divided by cost. Margin is profit divided by price. A 30% markup gives a 23.1% margin; to earn a 30% margin you need a 42.9% markup. This matters when you mark up freelancer or production costs.
| Markup on cost | Price on $1,000 of cost | Resulting margin |
|---|---|---|
| 15% | $1,150 | 13.0% |
| 20% | $1,200 | 16.7% |
| 30% | $1,300 | 23.1% |
| 42.9% | $1,429 | 30.0% |
| 66.7% | $1,667 | 40.0% |
| 100% | $2,000 | 50.0% |
Formula: margin = markup / (1 + markup). Markup = margin / (1 minus margin). Our calculations.
What separates a 19% agency from an 8% agency
The published research points to a short list of levers, all of which show up in the Promethean data.
- Price increases. In both the 2025 and 2026 reports, agencies that raised rates grew faster; in the 2025 report they also earned above average margins, while fee cuts went with a 6% revenue decline. If you need a structure for raising prices, tiered packages are the simplest; this good better best pricing guide shows how to build them.
- Focus. In the 2026 report, Design agencies led on margins and agencies that reduced services posted standout growth and margins, while expanding services weighed on margins.
- Retainers that fit the work. Promethean’s archetype data shows 45% of marketing agencies prefer retainers, and value-based pricing was used by only 18% of agencies in 2025 and underperformed standard models. If you are rebuilding your service menu, the digital marketing agency services list with typical prices is a good place to check your rates.
- Contractor benches instead of headcount. Contractor use rose 19% in 2024 while average headcount fell, and Promethean ties part of the margin stability to that shift.
- Utilization targets. Two thirds of agencies set production utilization targets, averaging 72% in the 2024 report, up from 68%, which the authors say could account for some of the improvement in net margins.
My view: most agencies stuck under 10% have a pricing problem disguised as a staffing problem. Fix the price per retainer first, then the delivery model. For a wider comparison of how agency margins stack up against other industries, see our profit margin by industry data. And if you run a professional service firm and want an outside view of your own pricing and growth numbers, you can book a consultation.
Ready to scale your revenue?
Book a free 30-min consultation. We’ll diagnose your growth bottleneck and map out the 3 highest-leverage moves for your business.
Frequently asked questions
What is the average advertising agency profit margin?
About 13% net after a market owner salary. Promethean Research reported a 13% average net margin for 2025. IRS data for 2023 shows advertising corporations earned net income equal to 7.6% of total receipts, or 13.7% of gross income once pass-through costs are removed. Omnicom, Interpublic and WPP report adjusted margins of roughly 13% to 16%.
What is a good digital marketing agency profit margin?
A 15% to 20% net margin on agency gross income is good, and 20% to 30% is the ideal range agency advisor Karl Sakas sets after everyone, including the owner, is paid market rate. Small studio shops averaged 19% in Promethean's 2026 report. Under 10% usually points to underpricing, low utilization or too many staff for the revenue.
How much do marketing agency owners make?
Karl Sakas puts owner salary for independent agencies under 100 employees at $150,000 to $500,000 a year, with total pay including distributions sometimes passing $1 million. In a simple model, one owner of an agency with $1 million in gross income, a $150,000 salary and a 13% net margin would take home about $280,000 before tax.
How profitable is an advertising agency?
Profitability looks low on total billings and normal on gross income. US advertising corporations earned 7.6% of total receipts in 2023 but 13.7% of receipts minus cost of goods sold, by our calculation from IRS data. Omnicom's 2024 operating margin was 14.5%, and WPP's 2025 headline margin was 13.0% of revenue less pass-through costs.
Is a 40% profit margin high for an agency?
A 40% net margin after paying the owner a market salary is very high, about three times the 13% survey average. A 40% delivery or project margin is a different measure and is fairly low, because overhead, sales time and owner pay still have to come out of it. Always confirm which margin is being quoted.
Is 30% markup the same as 30% margin?
No. Markup is profit divided by cost, margin is profit divided by price. A 30% markup on $1,000 of cost gives a $1,300 price and a 23.1% margin. To reach a 30% margin you need a 42.9% markup. Use margin = markup / (1 + markup) to convert.
What is an agency net profit benchmark by size?
Smaller agencies post higher net margins. Promethean's 2026 report found studio shops at 19% against a 13% overall average. Census SUSB 2022 data shows payroll rising from about 21% of receipts at advertising agencies under 5 employees to about 40% at firms with 100 or more, which squeezes margin as agencies grow.
Practice economics benchmarks