

The average US insurance agency or brokerage brought in about $1.72 million in revenue in 2022: 120,434 employer firms classified as Insurance Agencies and Brokerages (NAICS 524210) reported $207.1 billion in receipts to the Census Bureau. That mean is pulled up by a few hundred national brokers. Two in three agencies (67.6%) took in under $500,000, the typical agency sits in the $100,000 to $499,999 band, and the 313,543 one-owner agencies that file a Schedule C averaged $105,697 in receipts and $38,199 in net income in 2023.
Below: the Census averages by agency size, the full revenue distribution, profit margins under each definition people quote (owner net income, pro forma EBITDA, public broker EBITDAC, pretax), what owners actually keep, the commission rates that produce agency revenue, and a copy-ready revenue model you can run on your own book. Each table names its dataset, year and NAICS code, and every average marked “my calculation” is computed straight from the source file.
Short answer: Mean revenue for a US insurance agency with employees was $1.72 million in 2022 (Census SUSB, NAICS 524210), but 67.6% of agencies earned under $500,000 and agencies with fewer than 5 employees averaged $323,793. Profit depends on the definition: owner-run sole proprietorships kept 36.1% of receipts before paying themselves (IRS, 2023), and top independent agencies posted pro forma EBITDA margins of 23.2% to 30.7% in the 2026 Best Practices Study Update.
Insurance agency average revenue by size (Census, 2022)
The cleanest public count comes from the Census Bureau’s Statistics of US Businesses (SUSB) 2022 file, which reports firms, offices, employees, payroll and receipts for NAICS 524210, Insurance Agencies and Brokerages. Receipts in SUSB are reported in thousands of dollars. I divided receipts by firms, by employees and by payroll to get the averages below. SUSB counts employer firms only, so a solo agent with no payroll is not in these rows (the IRS section further down covers them). The file does not separate captive from independent agencies.
| Agency size (employees) | Firms | Share of firms | Average revenue per firm | Revenue per employee | Payroll as % of revenue |
|---|---|---|---|---|---|
| All agencies and brokerages | 120,434 | 100% | $1,719,694 | $256,440 | 32.8% |
| Fewer than 5 | 91,066 | 75.6% | $323,793 | $180,152 | 27.8% |
| 5 to 9 | 20,081 | 16.7% | $929,879 | $148,438 | 35.7% |
| 10 to 19 | 5,672 | 4.7% | $2,313,385 | $181,129 | 37.1% |
| 20 to 99 | 2,689 | 2.2% | $8,126,954 | $238,194 | 36.2% |
| 100 to 499 | 547 | 0.5% | $40,097,678 | $320,486 | 32.7% |
| All under 500 | 120,055 | 99.7% | $875,164 | $201,241 | 33.1% |
| 500 or more | 379 | 0.3% | $269,239,583 | $357,372 | 32.6% |
Source: US Census Bureau, SUSB 2022, NAICS 524210, US totals by enterprise employment size. Averages are my calculation (receipts divided by firms, employees or payroll). Firm = the whole company, which can have several offices; the 120,434 firms ran 135,100 offices, an average of $1,533,010 per office.
Three things stand out. First, 379 firms with 500 or more employees booked $102.0 billion, which is 49.3% of all agency receipts. Second, the 120,055 agencies with fewer than 500 employees averaged $875,164, about half the headline mean. Third, the typical agency is tiny: three in four have fewer than five employees and average $323,793 a year.
Why the average misleads: most agencies earn under $500,000
The Census Bureau also publishes the same 2022 data sorted by the firm’s own revenue. That table answers the question most owners actually ask: what does a normal agency bring in?
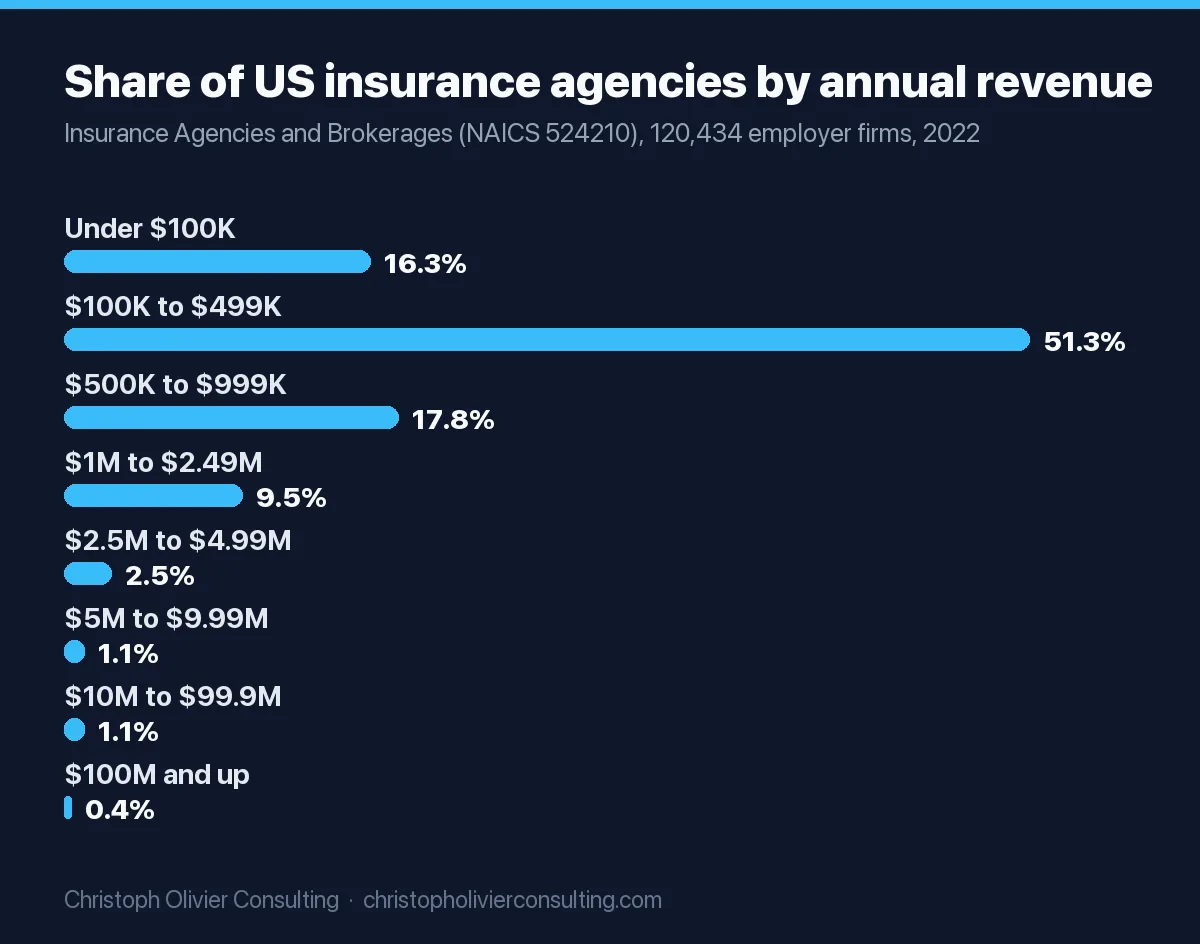
| Annual revenue band | Firms | Share of firms | Average revenue in band | Average employees | Share of all agency revenue |
|---|---|---|---|---|---|
| Under $100,000 | 19,679 | 16.3% | $50,810 | 1.0 | 0.5% |
| $100,000 to $499,999 | 61,734 | 51.3% | $266,682 | 2.2 | 7.9% |
| $500,000 to $999,999 | 21,463 | 17.8% | $691,580 | 4.5 | 7.2% |
| $1 million to $2.49 million | 11,452 | 9.5% | $1,477,544 | 7.8 | 8.2% |
| $2.5 million to $4.99 million | 2,952 | 2.5% | $3,369,810 | 15.0 | 4.8% |
| $5 million to $9.99 million | 1,361 | 1.1% | $6,443,984 | 26.2 | 4.2% |
| $10 million to $99.9 million | 1,302 | 1.1% | $20,392,951 | 69.2 | 12.8% |
| $100 million and up | 491 | 0.4% | $229,353,534 | 604.3 | 54.4% |
Source: US Census Bureau, SUSB 2022 by enterprise receipts size, NAICS 524210. Band averages, shares and employees per firm are my calculation. The $5M to $9.99M and $10M to $99.9M rows combine the Census sub-bands.
Run the cumulative shares and the picture is clear: 67.6% of agencies earn under $500,000, 85.4% earn under $1 million and 94.9% earn under $2.5 million. The median agency falls inside the $100,000 to $499,999 band. Strip out the 491 firms above $100 million and the average for the remaining 119,943 agencies drops to $787,849 (my calculation). If you run a $1 million agency, you are already in the top 15% of US agencies by revenue.
How much does an insurance agency make per employee?
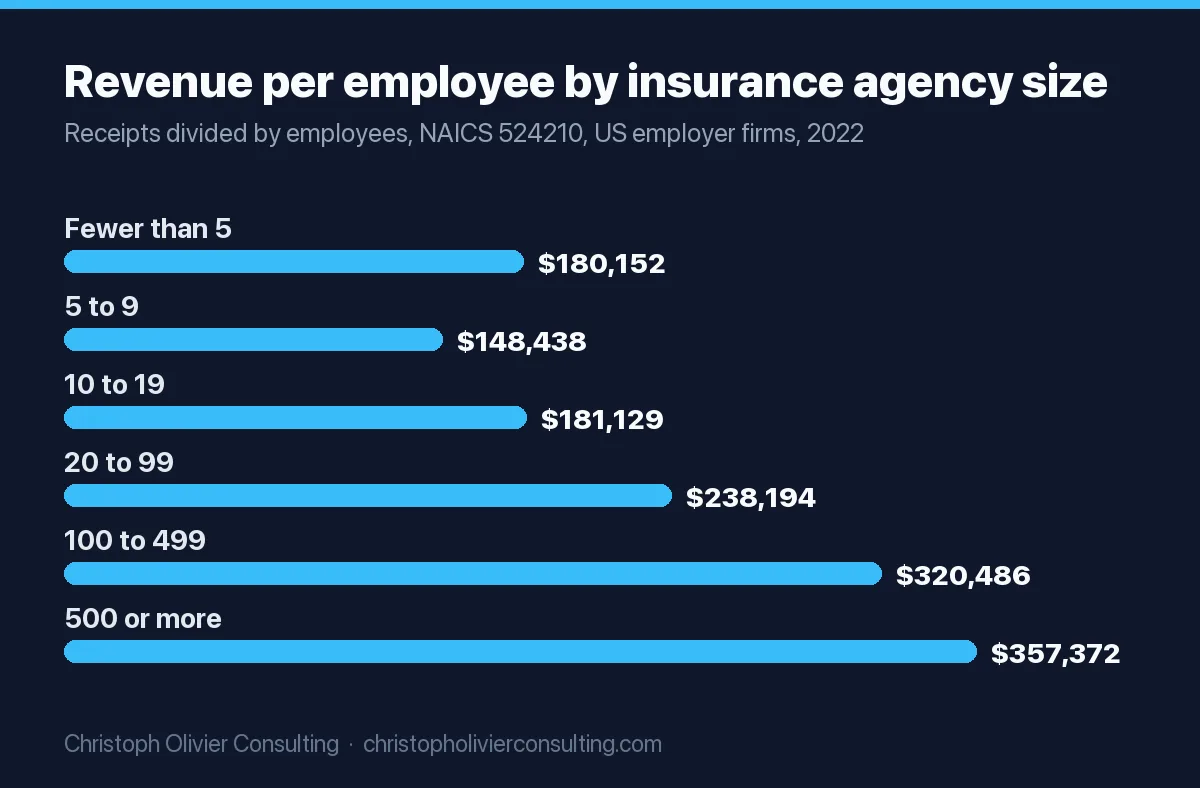
Revenue per employee rises with scale, but not in a straight line. In the Census data, agencies with 5 to 9 employees produce the least revenue per head ($148,438), below even the smallest agencies. Above 20 employees the number climbs steadily, reaching $357,372 at the largest firms. For comparison, Brown & Brown’s 2025 Form 10-K reports $5,902 million in total revenue and 22,888 employees, about $257,865 per employee, and Gallagher’s 2025 Form 10-K reports $12,192 million of brokerage segment revenue and a brokerage workforce of 55,561, about $219,435 per head (both per-employee figures are my calculation from year-end headcount, which includes recently acquired staff).
Insurance agency profit margin: four definitions, four answers
Search “insurance agency profit margin” and you will see numbers from 3% to 45%. Most of the gap comes from what counts as profit. A sole proprietor’s net income is the owner’s pay and profit combined, because the owner takes no salary; benchmark studies report “pro forma EBITDA,” an adjusted profit figure; public brokers report EBITDAC (their own non-GAAP measure) as well as plain pretax income. Here is each measure, from its source.
| Who | Measure | Margin | Year | Source |
|---|---|---|---|---|
| Sole proprietor insurance agencies (313,543 returns) | Net income less deficit, divided by receipts, before any owner pay | 36.1% | Tax year 2023 | IRS SOI Table 1 (my calculation) |
| Sole proprietor agencies with a profit (223,193 returns) | Net income divided by receipts | 46.1% | Tax year 2023 | IRS SOI Table 1 (my calculation) |
| Best Practices independent agencies, by revenue band | Pro forma EBITDA margin | 23.2% to 30.7% | 2025 results, 2026 update | Big “I” and Reagan Consulting |
| Top quartile, Best Practices agencies under $1.25M revenue | Pro forma EBITDA margin | 42.5% | 2025 results, 2026 update | Big “I” and Reagan Consulting |
| Brown & Brown, whole company | EBITDAC Margin, Adjusted (non-GAAP) | 35.9% | 2025 | Form 10-K |
| Brown & Brown, whole company | Income before income taxes margin (GAAP) | 23.2% | 2025 | Form 10-K |
| Brown & Brown, Retail segment | EBITDAC Margin, Adjusted (non-GAAP) | 30.0% | 2025 | Form 10-K |
| Gallagher, brokerage segment | Adjusted EBITDAC margin (non-GAAP) | 36.5% | 2025 | Form 10-K |
| Gallagher, brokerage segment | Earnings before income taxes divided by total revenues | 22.6% | 2025 | Form 10-K (my calculation: $2,759M of $12,192M) |
How to read it: if you own a small agency and want to compare yourself with a benchmark, first pay yourself a market salary for the work you do, then compare what is left with the 23% to 31% pro forma EBITDA range. If you compare your untouched Schedule C profit with a public broker’s margin, you are comparing owner pay plus profit with profit alone, and you will look better than you are.
Two details from the filings matter here. Gallagher notes that its 2025 brokerage margin includes about $363 million of interest income earned on financing proceeds for its AssuredPartners acquisition, so the operating margin is lower than the headline. And Brown & Brown says it uses Organic Revenue growth and EBITDAC Margin, Adjusted as key metrics in executive incentive pay, which tells you which two numbers a large broker manages to.
Is owning an insurance agency profitable?
For most owners, yes, at least on paper. In the IRS 2023 sole proprietorship data, 71.2% of insurance agency returns (223,193 of 313,543) reported a net profit, and the industry as a whole kept $11.98 billion of $33.14 billion in receipts. The flip side: 28.8% of returns did not show a net profit, a group the IRS table does not break down further. The Big “I” 2026 Agency Universe Study found 9% of independent agencies were established in the last five years, so a meaningful slice of the market is always in that early, thin-margin phase.
How much do insurance agency owners make?
There is no government series for agency owner pay, so the honest answer comes in three layers.
- One-owner agencies (sole proprietors). The IRS Statistics of Income table for tax year 2023 lists 313,543 Insurance agencies and brokerages returns with $33.14 billion in receipts and $11.98 billion in net income less deficit. That is an average of $105,697 in receipts and $38,199 in net income per return. Among the 223,193 returns with a profit, average receipts were $125,118 and average net income was $57,710 (my calculations). Many of these are part-time or one-person books, which is why the average is modest.
- Employer agencies. An owner of an employer agency takes a salary plus whatever profit is left. Using the Census averages and the Best Practices margin range as a rough guide, an owner of an agency at the $1 million mark would see pro forma EBITDA of roughly $232,000 to $307,000 before taxes, debt service and reinvestment, on top of a market salary for their own role. That is an illustration from published ranges, not a reported figure, and agencies outside the Best Practices group typically earn less than those top performers.
- Agents who work for an agency. The Bureau of Labor Statistics puts the median wage for insurance sales agents at $62,280 in May 2025, and $61,550 for agents employed by insurance agencies and brokerages. BLS counts 572,600 jobs and says 12% of agents are self-employed. Those wage figures describe employees, not owners.
The biggest piece of owner wealth is often not annual income at all. It is the value of the book. That is why the Agency Universe Study’s finding that 87% of independent agencies have some type of perpetuation tool or plan in place, up from 85% in 2024, matters for owner economics.
Independent insurance agency revenue: what the Big “I” data shows
The Independent Insurance Agents & Brokers of America (the Big “I”) publishes two public sets of numbers. Its 2026 Agency Universe Study estimates 37,000 independent property and casualty agencies in the US; Insurance Journal’s coverage of the same study says that count fell from 39,000 in 2024, that the share of agencies reporting a revenue decrease fell from 12% to 8%, that about 7 in 10 reported higher personal lines revenue and 2 in 3 higher commercial lines revenue from 2024 to 2025, and that the study included 1,376 respondents.
The second set is the 2026 Best Practices Study Update, produced with Reagan Consulting and released August 12, 2026. It covers top-performing independent agencies in seven revenue bands, from under $1.25 million to over $100 million. Its public headline numbers:
| Metric (Best Practices agencies) | 2025 results (2026 update) | Prior study range | What it means |
|---|---|---|---|
| Organic growth, range across revenue bands | 6.2% to 10.2% | 8.7% to 11.3% | Growth slowed in six of seven bands as commercial rates cooled |
| Pro forma EBITDA margin, range across bands | 23.2% to 30.7% | Not stated in the release | Top performers still keep roughly a quarter of revenue |
| Top quartile margin, under $1.25M band | 42.5% | Not stated | Small can be very profitable |
| Rule of 20 median score (organic growth + half of pro forma EBITDA) | 19.3 to 26.1 | 19.0 to 29.5 | 20 is the threshold the study ties to top performance |
| Sales velocity, under $1.25M band | 16.6% | Not stated | Five of seven bands topped the 12% threshold |
| NUPP (investment in new, not yet validated producers) | 0.0% to 1.7% | Not stated | The study calls 1.5% to 2.0% a healthy investment in new producers |
Source: Big “I” and Reagan Consulting, 2026 Best Practices Study Update press release. Full band-level data is sold by the Big “I” and is not reproduced here.
Public brokers grew more slowly on an organic basis in 2025. Brown & Brown reported a consolidated Organic Revenue growth rate of 2.8%, down from 10.4% in 2024, and Gallagher reported 6% organic change in brokerage commissions and fees, both in their 2025 10-K filings. The direction matches the Best Practices finding: softer commercial pricing slows revenue growth across the channel.
Where agency revenue comes from: commission rates and contingents
An agency’s revenue is mostly a percentage of the premium it places. Carriers publish their ranges. The Hartford’s personal lines disclosure and commercial lines disclosure list base commission ranges that apply to 90% of the policies it writes:
| Line of business (The Hartford) | Base commission range |
|---|---|
| Personal auto (including umbrella) | 7% to 16% |
| Homeowners | 7% to 15% |
| Dwelling fire | 5% |
| Personal flood | 10% to 20% |
| Commercial property, multi-peril, BOP | 0% to 18% |
| General liability (including umbrella) | 0% to 15% |
| Commercial auto | 0% to 15% |
| Workers compensation | 0% to 11% |
| Financial lines (D&O, EPL, cyber, E&O and others) | 0% to 22% |
| Surety bonds | 0% to 30% |
| Contingent commission (personal / commercial) | 1% to 7.0% / 1% to 6.5% of eligible premium |
| Supplemental commission (personal / commercial) | 1% to 7% / 1% to 6.5% |
Source: The Hartford producer compensation disclosures, personal and commercial lines, accessed November 2026. Ranges are one carrier’s, net of policyholder service fees (generally 1% of premium when charged). Other carriers set their own schedules.
Contingent and supplemental commissions are the profit-sharing layer. They are paid based on the volume and loss results of the business an agency places. At Brown & Brown, profit-sharing contingent commissions were $255 million in 2025, 4.3% of total revenue. At Gallagher’s brokerage segment, contingent ($324 million) plus supplemental ($466 million) revenue came to 6.5% of segment revenue (my calculations from the two 10-Ks). Compensation is the largest cost: Brown & Brown’s employee compensation and benefits ran 49.7% of revenue, and Gallagher’s brokerage compensation expense ratio was 55%, with an operating expense ratio of 14%.
Copy-ready insurance agency revenue model
This is the simplest model that matches how agencies actually earn: premium placed times commission rate, by line, plus profit-sharing and fees, minus compensation and operating costs. Copy the rows into a spreadsheet and replace the inputs with your own book. The example inputs below are my illustration, chosen inside the published ranges above; they are not industry averages.
| Line | Formula | Example input | Example result |
|---|---|---|---|
| A. Personal lines revenue | Personal premium in force x average personal commission rate | $2,500,000 x 12% | $300,000 |
| B. Commercial lines revenue | Commercial premium in force x average commercial commission rate | $5,000,000 x 13% | $650,000 |
| C. Contingent and supplemental | Eligible premium x expected profit-sharing rate | $3,750,000 x 2% | $75,000 |
| D. Fees and other income | Broker fees, consulting, interest on premium trust | Your actual figure | $25,000 |
| E. Total revenue | A + B + C + D | $1,050,000 | |
| F. Compensation, including owner market salary | E x compensation ratio | 55% (Gallagher brokerage ratio) | $577,500 |
| G. Operating expenses | E x operating expense ratio | 14% (Gallagher brokerage ratio) | $147,000 |
| H. Pro forma EBITDA | E minus F minus G | $325,500 | |
| I. Margin | H divided by E | Compare with 23.2% to 30.7% | 31.0% |
| J. Rule of 20 check | Organic growth + (I divided by 2) | 8% growth + 15.5 | 23.5 |
How to use it:
- Pull premium in force by line from your agency management system. Use written premium for the last 12 months, not quoted premium.
- Compute your real average commission rate per line as commission received divided by premium placed. Your blended rate will sit below the top of carrier ranges if your book includes lower-commission lines such as workers compensation (0% to 11% at The Hartford).
- Set line C to the last three years’ average contingent income, not the best year. Contingents depend on loss ratios you do not control.
- In line F, include a market salary for every owner role. Without it, line I is owner pay plus profit, which is the IRS-style number, not the benchmark-style number.
- If line J is under 20, decide whether the gap is growth or margin. Growth gaps call for more new business per producer; margin gaps call for service-staff ratios and carrier consolidation.
To turn the model into a growth target, work backward from revenue to clients. For example, if your average household or business account produces $1,000 of commission, $100,000 of new revenue needs 100 net new accounts after lost business. Our benchmarks on how many clients insurance agents have give you the per-producer side of that math, and customer lifetime value tells you how much you can spend to win each account given your retention.
How to raise revenue without crushing the margin
The data above points to three levers that move the numbers that matter, in this order.
1. Organic growth per producer. The Best Practices update shows growth, not margin, is what slipped in 2025. Sales velocity above 12% is the threshold the study uses. A planned mix of channels by line of business, which we lay out in our insurance agency marketing playbook, is how you add predictable new accounts. If referrals are a big source, check the state rules first: our guide to insurance agent referral fees covers caps and gift limits by state.
2. Revenue per employee. Census data shows agencies with 5 to 9 employees produce about $148,000 per person versus $238,000 at 20 to 99 employees. If you are in that middle band, the fix is usually more premium through the same team, not more staff.
3. Acquisition cost discipline. Commission revenue renews, so you can afford to pay more for an account than a one-time sale would justify, but only if you know your cost per new account. Compare yours with our customer acquisition cost benchmarks, and see how agency margins stack up against other sectors in our profit margin by industry data.
In my view, the most useful single number for a small agency owner is line J in the model above, because it forces growth and margin into one score you can track every quarter. If you want a second pair of eyes on your growth plan and marketing spend, you can book a consultation.
Sources and method
Census figures come from the downloadable SUSB 2022 files (US totals by employment size, and by receipts size), NAICS 524210, released April 10, 2025; receipts and payroll are reported in thousands of dollars, and all averages are my calculations. IRS figures come from SOI Table 1, Nonfarm Sole Proprietorships, tax year 2023, industry line “Insurance agencies and brokerages.” Public company figures are from each company’s Form 10-K for fiscal 2025 filed with the SEC; EBITDAC measures are non-GAAP as the companies define them. Best Practices and Agency Universe figures are the public headline numbers released by the Big “I”; the full studies are paid products. Commission ranges are one carrier’s published disclosure and will differ by carrier, state and line.
Ready to scale your revenue?
Book a free 30-min consultation. We’ll diagnose your growth bottleneck and map out the 3 highest-leverage moves for your business.
Frequently asked questions
What is the average revenue of an insurance agency?
US insurance agencies and brokerages with employees averaged $1.72 million in revenue in 2022, based on Census SUSB data for NAICS 524210 (120,434 firms, $207.1 billion in receipts). The typical agency is much smaller: 67.6% earned under $500,000, and agencies with fewer than five employees averaged $323,793.
How much does an insurance agency make in profit?
It depends on the measure. One-owner agencies filing Schedule C kept 36.1% of receipts as net income in tax year 2023 (IRS), before paying the owner. Top independent agencies in the 2026 Best Practices Study Update reported pro forma EBITDA margins of 23.2% to 30.7%. Brown and Brown's 2025 pretax margin was 23.2%.
What is a good profit margin for an insurance agency?
A useful bar is the Best Practices range of 23.2% to 30.7% pro forma EBITDA, measured after paying every owner a market salary. The top quarter of Best Practices agencies under $1.25 million in revenue reached 42.5%. The study also uses the Rule of 20: organic growth plus half the EBITDA margin should reach at least 20.
How much do insurance agency owners make?
No official series tracks agency owner pay. IRS data for tax year 2023 shows one-owner agencies averaged $38,199 in net income, or $57,710 among those with a profit. Owners of larger employer agencies earn a salary plus profit; at a $1 million agency with a 23% to 31% margin, that profit is roughly $232,000 to $307,000 before taxes and debt.
How much revenue does an independent insurance agency make?
Public data does not isolate independent agencies' revenue. The Big I's 2026 Agency Universe Study counts about 37,000 independent P&C agencies, and three in four reported higher revenue from 2024 to 2025. Census data covering all agencies shows 85.4% of agencies earn under $1 million a year.
How do insurance agencies make money?
Mostly through commissions paid by carriers as a percentage of premium. The Hartford's published ranges run 7% to 16% for personal auto, 7% to 15% for homeowners and 0% to 11% for workers compensation, plus contingent commissions of 1% to 7% of eligible premium based on results. Fees and other income add a smaller share.
Practice economics benchmarks