
Uber spent $4,898 million on sales and marketing in 2025, and $2.2 billion of that was advertising. DoorDash spent $2,476 million on sales and marketing, including $1.6 billion of advertising. Airbnb spent $2,588 million on sales and marketing, of which $1,595 million was what it calls brand and performance marketing and $843 million was advertising. Lyft ($875 million) and Instacart ($854 million) round out the group. Every figure on this page comes from the company’s own 10-K or 10-Q on SEC EDGAR, read in November 2026.
Short answer: Uber: $2.2 billion of advertising inside $4.9 billion of sales and marketing (2025, 9.4% of revenue). DoorDash: $1.6 billion of advertising inside $2.48 billion (18.1%). Airbnb: $843 million of advertising inside $2.59 billion (21.1%). None of these totals includes the new-customer discounts that DoorDash and Instacart, and in some markets Uber, record as a reduction of revenue instead of a marketing cost.
Two words matter in every row below. Sales and marketing is the full expense line: ads, promotions booked as marketing, marketing staff and allocated overhead. Advertising is the smaller amount each company states in its accounting notes. When someone asks “how much does Uber spend on advertising,” the answer is the second number. When they ask about the “marketing budget,” the first number is the closest public figure.
Uber, DoorDash, Airbnb, Lyft and Instacart marketing spend compared (2025)
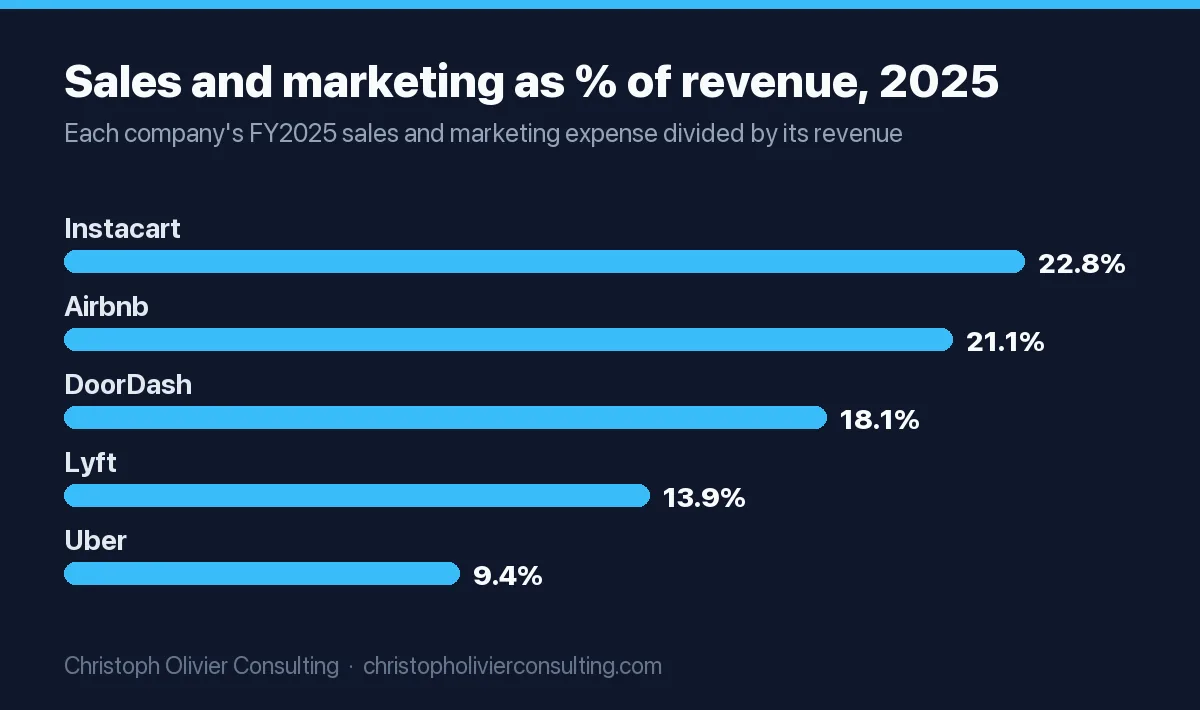
All five companies have a December 31 fiscal year end. Spend and revenue in each row come from the same filing. The percentage columns are my calculation: expense divided by total revenue, times 100.
| Company | Sales and marketing, FY2025 (reported) | Advertising expense, FY2025 (reported) | Revenue, FY2025 | S&M % of revenue (calc.) | Advertising % of revenue (calc.) | Source |
|---|---|---|---|---|---|---|
| Uber | $4,898M | $2.2B | $52,017M | 9.4% | 4.2% | Uber 10-K, FY2025 |
| DoorDash | $2,476M | $1.6B | $13,717M | 18.1% | 11.7% | DoorDash 10-K, FY2025 |
| Airbnb | $2,588M (brand and performance marketing: $1,595M) | $843M | $12,241M | 21.1% | 6.9% | Airbnb 10-K, FY2025 |
| Lyft | $875.1M | $122.9M | $6,316.3M | 13.9% | 1.9% | Lyft 10-K, FY2025 |
| Instacart (Maplebear) | $854M | $485M | $3,742M | 22.8% | 13.0% | Maplebear 10-K, FY2025 |
Uber and DoorDash round their advertising figures to the nearest $0.1 billion, so their advertising percentages can move by a few tenths of a point. Uber’s dollar total is the largest by far, yet its sales and marketing ratio is the lowest of the five, because its revenue is roughly 4 to 14 times that of the other four.
How much does Uber spend on marketing? $4.9 billion in 2025
Uber’s 2025 10-K reports sales and marketing expense of $4,898 million, up 13% from $4,337 million in 2024, equal to 9% of revenue by Uber’s own rounding. Uber explains the increase: a $221 million rise in “indirect advertising and marketing,” a $207 million rise in consumer discounts, promotions, credits and refunds (to $1.6 billion), and a $129 million rise in employee headcount costs.
How much does Uber spend on advertising?
Uber discloses advertising separately in its accounting notes. Advertising expenses totaled $1.7 billion in 2023, $1.9 billion in 2024 and $2.2 billion in 2025, per the 2025 10-K. The 2023 10-K shows advertising of $1.7 billion in each of 2021, 2022 and 2023. So Uber’s ad spend was flat for three years and has grown about 29% since (my calculation: $2.2B ÷ $1.7B).
The same note gives a second number most coverage misses: “discounts, loyalty programs, promotions, refunds, and credits provided to end-users who are not customers.” That was $2.4 billion in 2021, $2.2 billion in 2022, $1.7 billion in 2023, $1.4 billion in 2024 and $1.6 billion in 2025. In 2021 and 2022 Uber spent more on rider and eater discounts than on advertising.
Do not confuse Uber’s ad spend with Uber Advertising, the business that sells sponsored listings to restaurants and brands inside the Uber Eats app. That is revenue, not spend. The 10-K credits a $568 million increase in advertising revenue as one driver of 2025 Delivery revenue growth.
Uber’s marketing spend in 2026 so far
Uber’s Q3 2026 10-Q shows sales and marketing of $1,563 million for the quarter, up 22%, and $4,404 million for the first nine months, up 24% from $3,544 million. The company attributes the nine-month increase mainly to a $389 million rise in consumer discounts, promotions, credits and refunds and a $279 million rise in indirect advertising and marketing. Nine-month spend is 10.4% of revenue (my calculation), against 9.4% for all of 2025.
The Uber ad-cut stories: what actually happened
Two stories rank for “Uber ad spend,” and both are about turning money off, not on.
- Programmatic fraud, around 2017. Kevin Frisch, Uber’s former head of performance marketing and CRM, described on episode 194 of Marketing Today (February 12, 2020) how Uber found attribution fraud in its performance-marketing suppliers. His advice from the episode: “you should start by assuming that, half of what’s on the display channels, is fraud.” The Hustle summarized the outcome as Uber cutting two-thirds of its roughly $150 million ad budget “with no negative effects.” That figure is Frisch’s account as reported, not a number from Uber’s filings.
- The Meta holdout, 2018. Sundar Swaminathan, who led US and Canada rider performance marketing analytics, wrote in a first-person account (August 2024) that Uber ran a three-month holdout on Facebook/Meta for US and Canada rider acquisition. “The results came back conclusively that there was no incrementality,” he wrote, and Uber turned that spend off, saving $35 million a year. The money moved to riders in other regions, driver acquisition, Uber Eats and brand work.
Both lessons are about measurement, not about Meta or display being bad channels. In a market where almost everyone already knew the product, paid clicks were claiming credit for signups that would have happened anyway.
DoorDash marketing budget: $2.48 billion, including $1.6 billion of advertising (2025)
DoorDash’s 2025 10-K reports sales and marketing of $2,476 million, up 22% from $2,037 million in 2024. DoorDash says the increase was “primarily driven by an increase of $278 million in advertising expenses and an increase of $144 million in personnel-related compensation expenses.” Advertising expenses were $1.3 billion in 2023, $1.3 billion in 2024 and $1.6 billion in 2025. The 2023 10-K adds $1.2 billion for 2021 and $1.1 billion for 2022.
DoorDash’s sales and marketing line covers advertising, merchant, consumer and Dasher acquisition costs, “certain consumer referral credits and Dasher referral fees,” brand marketing, sales staff and commissions. What it mostly does not cover is consumer promotions. The 10-K says promotions offered to consumers “are primarily recorded as a reduction of revenue,” including discounts for new consumers and promotions for existing ones. So DoorDash’s real customer-acquisition outlay is larger than $2.48 billion, and the extra part is not disclosed as a single number.
For 2026, DoorDash’s Q3 2026 10-Q shows nine-month sales and marketing of $2,332 million, up 32%, “primarily driven by an increase of $345 million in advertising expenses.” DoorDash completed its acquisition of Deliveroo in October 2025 per the 10-K, so 2026 periods include Deliveroo and the matching 2025 periods largely do not.
Airbnb advertising budget and ad spend: $843 million of advertising (2025)
Airbnb is the only company here that breaks its sales and marketing line into named parts. Its 2025 10-K shows:
- Brand and performance marketing: $1,595 million in 2025, up 10% from $1,455 million.
- Field operations and policy: $993 million, up 43% from $693 million.
- Total sales and marketing: $2,588 million, 21% of revenue.
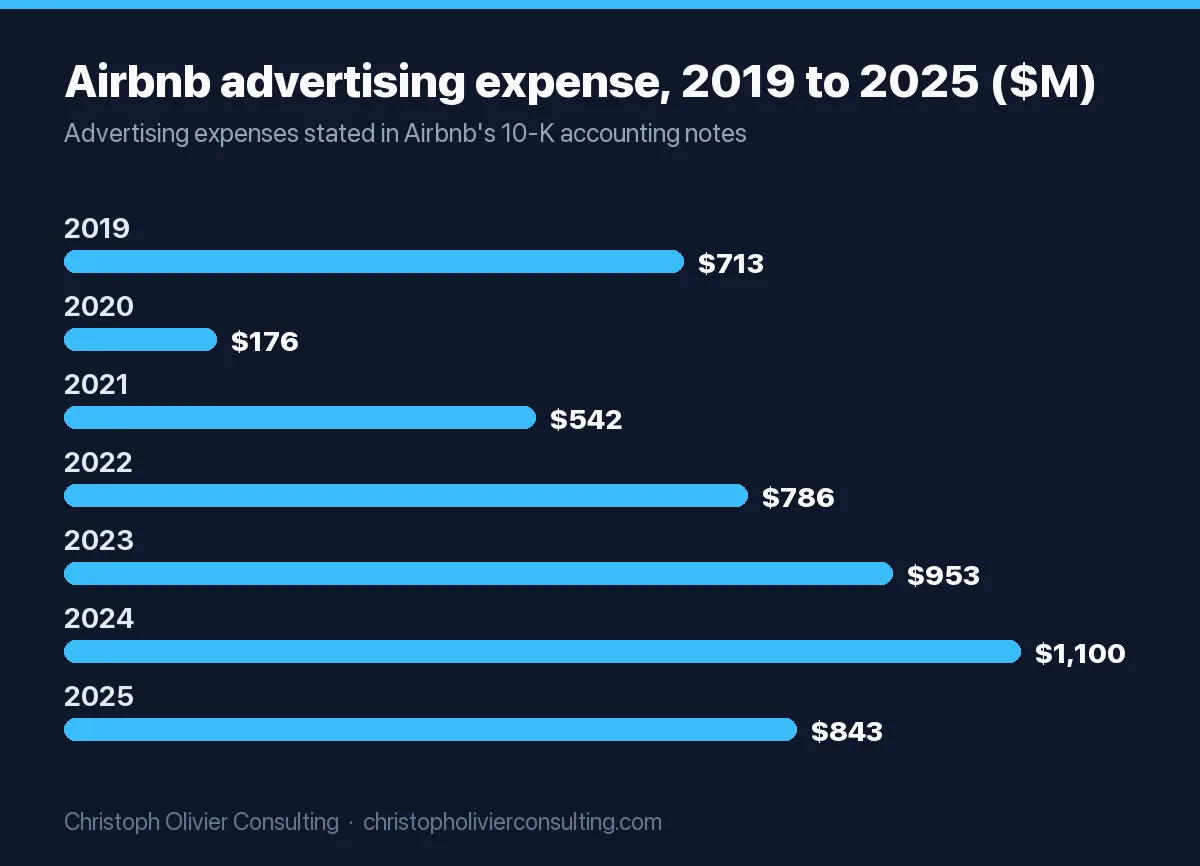
Separately, the accounting note puts advertising expenses at $953 million in 2023, $1.1 billion in 2024 and $843 million in 2025. Advertising fell in 2025 while brand and performance marketing rose. The filing does not reconcile the two lines, so treat $843 million as Airbnb’s narrow ad spend and $1,595 million as its broader marketing program.
Airbnb’s shift from performance to brand marketing, in the company’s own numbers
Airbnb’s 2020 S-1 said about 23% of its traffic in 2019 came from paid performance marketing channels, against about 9% in the first nine months of 2020, and that it had “suspended substantially all performance marketing efforts” during the pandemic. It stated the plan: “shift our marketing mix more towards brand marketing spend and away from spending on performance marketing.”
The shareholder letters show the plan running. The Q1 2021 letter reported sales and marketing down 37% year over year, excluding stock-based compensation and acquisition impacts, “primarily due to a decrease in performance marketing expenses,” and announced “our first large-scale marketing campaign in five years, Made possible by Hosts.” The Q4 2021 letter said adjusted sales and marketing was 25% below Q4 2019, “primarily due to a reduction in performance marketing expenses,” while brand marketing rose.
The 2021 10-K gives the advertising line: $712.6 million in 2019, $176.0 million in 2020 and $542.1 million in 2021. Airbnb grew revenue from $4,805 million in 2019 to $5,992 million in 2021 while spending less on advertising and $435 million less on total sales and marketing (my calculation: $1,621.5M minus $1,186.3M).
One caution for anyone citing this as proof that brand beats performance: the trend is moving again. Airbnb’s Q3 2026 10-Q reports nine-month sales and marketing of $2,388 million, up 26%, driven by “a $345 million increase in marketing spend, driven by higher paid growth marketing initiatives and partnerships.”
Lyft marketing spend: $875 million in 2025
Lyft’s 2025 10-K reports sales and marketing of $875.1 million, up 11% from $789.0 million. Advertising is small: $122.0 million in 2023, $136.9 million in 2024 and $122.9 million in 2025. The biggest piece is rider incentives. Lyft’s sales and marketing line “primarily consist[s] of rider incentives,” and the 10-K says costs related to its incentive programs rose from $402.8 million to $445.8 million in 2025, more than three times its advertising.
That gap widened in 2026. Lyft’s Q3 2026 10-Q shows nine-month sales and marketing of $974.9 million, up 58%, with incentive program costs nearly doubling from $312.1 million to $599.4 million. Most of Lyft’s driver incentives, by contrast, are recorded as a reduction to revenue.
Instacart marketing spend: $854 million in 2025
Instacart, which files as Maplebear Inc., reported sales and marketing of $854 million in its 2025 10-K, 23% of revenue by its own rounding. Advertising expenses, mostly online, were $388 million in 2023, $457 million in 2024 and $485 million in 2025. The 2023 10-K explains why 2023 sales and marketing peaked at $961 million: a $346 million rise in compensation costs, primarily stock-based compensation tied to its IPO. Promotional coupons that acquire or re-engage users are recorded as a reduction of revenue; referral coupons go to sales and marketing.
Why the 10-K number understates what these apps spend to win customers
Ride and delivery apps buy customers with discounts as much as with ads. Each company decides, under its own accounting policy, whether a discount is a marketing expense or a cut to revenue. That choice changes the marketing line by hundreds of millions of dollars. This table summarizes the policy in each 10-K.
| Company | Consumer discounts and promotions | Referral credits | Disclosed amount inside S&M (FY2025) |
|---|---|---|---|
| Uber | Targeted discounts to end-users who are not customers: sales and marketing. Market-wide promotions and subscription discounts: reduction of revenue. | Customer referrals paid for a distinct service are customer acquisition costs | $1.6B of discounts, promotions, refunds and credits |
| DoorDash | New and existing consumer promotions: primarily reduction of revenue | Up to fair value of acquiring a consumer: sales and marketing; excess: reduction of revenue | Not broken out |
| Airbnb | “Portions of referral incentives and coupons” in sales and marketing | Partly in sales and marketing | Not broken out |
| Lyft | Rider incentives (and certain driver incentives): sales and marketing. Other driver incentives: reduction to revenue. | Included in incentive programs | $445.8M of incentive program costs |
| Instacart | Promotional coupons: reduction of revenue | Referral coupons: sales and marketing | Not broken out |
The practical result: Uber’s and Lyft’s sales and marketing lines include a large chunk of discounts, while DoorDash’s and Instacart’s mostly do not. Comparing DoorDash’s 18.1% with Uber’s 9.4% therefore overstates how much more DoorDash spends on marketing relative to revenue. Here is what each 2025 line is made of, as far as the filings let you split it.
| Company (FY2025) | Total S&M | Advertising | Discounts or incentives in S&M | Everything else (calc.): staff, product marketing, partnerships, overhead |
|---|---|---|---|---|
| Uber | $4,898M | $2,200M (45%) | $1,600M (33%) | $1,098M (22%) |
| DoorDash | $2,476M | $1,600M (65%) | Not disclosed | $876M (35%) |
| Airbnb | $2,588M | $843M (33%) | Not disclosed | $1,745M (67%), incl. $993M field operations and policy |
| Lyft | $875.1M | $122.9M (14%) | $445.8M (51%) | $306.4M (35%) |
| Instacart | $854M | $485M (57%) | Not disclosed | $369M (43%) |
“Everything else” is my subtraction of the disclosed parts from the total. Uber’s and DoorDash’s advertising figures are rounded, so the subtractions for those two are approximate.
Sales and marketing as a share of revenue, 2021 to 2025
Five years from the same line in each company’s 10-Ks (2021 to 2023 from the FY2023 filings, 2023 to 2025 from the FY2025 filings, Airbnb 2021 from its FY2023 10-K). Percentages are my calculation.
| Company | 2021 | 2022 | 2023 | 2024 | 2025 | 9 months 2026 |
|---|---|---|---|---|---|---|
| Uber | $4,789M (27.4%) | $4,756M (14.9%) | $4,356M (11.7%) | $4,337M (9.9%) | $4,898M (9.4%) | $4,404M (10.4%) |
| DoorDash | $1,619M (33.1%) | $1,682M (25.6%) | $1,876M (21.7%) | $2,037M (19.0%) | $2,476M (18.1%) | $2,332M (17.8%) |
| Airbnb | $1,186M (19.8%) | $1,516M (18.0%) | $1,763M (17.8%) | $2,148M (19.3%) | $2,588M (21.1%) | $2,388M (21.4%) |
| Lyft | $411.4M (12.8%) | $531.5M (13.0%) | $481.0M (10.9%) | $789.0M (13.6%) | $875.1M (13.9%) | $974.9M (18.3%) |
| Instacart | $394M (21.5%) | $660M (25.9%) | $961M (31.6%) | $808M (23.9%) | $854M (22.8%) | $706M (22.4%) |
Sources: Uber FY2023, DoorDash FY2023, Airbnb FY2023, Lyft FY2023 and Maplebear FY2023 10-Ks, the FY2025 10-Ks linked above, and each company’s Q3 2026 10-Q. Uber’s and DoorDash’s ratios fell for one main reason: revenue grew much faster than marketing. Uber’s revenue rose from $17,455 million to $52,017 million over the period while sales and marketing barely moved. Instacart’s 2023 spike is the IPO stock compensation noted above.
What a service business should copy from these filings
You are not Uber, but the filings carry three lessons that hold at any size. The broader marketing budget benchmarks for your sector matter less than whether you can see what your own spend is doing.
- Split your marketing line the way Uber does. Uber reports ads, discounts and people separately, which is why you can see that discounts outran advertising in 2021. Most firms lump fee discounts, free consultations and referral payments into “sales,” so their real cost per client is invisible. Track them in one place, then work out true customer acquisition cost.
- Test whether paid channels are incremental. Uber’s Meta result came from switching a channel off and watching what happened, not from platform reporting. A last-click attribution model will credit paid ads for clients who would have called anyway.
- Brand reduces paid dependence, but it is not free. Airbnb cut performance marketing and kept growing because about 91% of its traffic in the first nine months of 2020 already came through direct or unpaid channels, per the S-1. If your referrals and branded search are weak, cutting paid first will hurt. The tradeoff is covered in brand awareness vs demand generation.
Copy-ready: a channel holdout test, with pass/fail criteria
This is the structure Swaminathan describes, scaled down for a firm spending a few thousand dollars a month on one channel.
| Step | What to do | Pass | Fail |
|---|---|---|---|
| 1. Baseline | Pull 12 months of weekly new leads and new clients, plus the same weeks last year | You can see seasonality year over year | Fewer than 12 months of clean data: fix tracking first |
| 2. Spend check | Plot weekly spend on the channel against weekly new clients | New clients move when spend moves | Spend flat, clients swinging: the signal Uber saw, run the test |
| 3. Holdout | Pause the channel fully for 8 to 12 weeks, or pause it in one location or service line only | Nothing else changes during the test | You launch a promo or new site mid-test: restart |
| 4. Read | Compare new clients during the pause with the same weeks last year and with the control area | Clients drop by more than seasonality explains: the channel is incremental, restore it | No measurable drop: the channel was taking credit, move the money |
| 5. Redeploy | Put saved budget into an untested channel or brand work, and test that next | New spend has its own holdout plan | Money spent because “use it or lose it” |
For firms with several channels running at once, a marketing mix model is the next step up. If you want a second pair of eyes on where your budget leaks, book a consultation.
Related questions people ask
How much does Chick-fil-A spend on marketing? Chick-fil-A describes itself as a family business and files no 10-K, so there is no audited figure. Any number you see is an estimate.
What is the 3-3-3 rule for marketing? There is no standard definition. Versions online describe different things, and none comes from an industry body, so ask whoever cites it what they mean.
Can you make $1,000 a day doing DoorDash? DoorDash’s 2025 10-K does not publish an average earnings figure for Dashers per day or per hour, so there is no official number to check that against. This page covers DoorDash’s corporate marketing budget, not Dasher pay.
Which company spends the most on marketing? Among companies that disclose it, Amazon is the largest: “advertising and other promotional costs” of $23.5 billion in 2025, per its 2025 10-K. That is more than ten times Uber’s advertising. Other household names are compared in big brand marketing budgets.
Ready to scale your revenue?
Book a free 30-min consultation. We’ll diagnose your growth bottleneck and map out the 3 highest-leverage moves for your business.
Frequently asked questions
How much does Uber spend on advertising?
Uber's 2025 10-K reports advertising expenses of $2.2 billion, up from $1.9 billion in 2024 and $1.7 billion in each of 2021, 2022 and 2023. Advertising sits inside a larger sales and marketing line of $4,898 million, which also includes $1.6 billion of consumer discounts, promotions, refunds and credits plus marketing staff costs.
What is DoorDash's marketing budget?
DoorDash reported sales and marketing expense of $2,476 million for 2025, 18.1% of its $13,717 million revenue, including $1.6 billion of advertising. Most consumer promotions are recorded as a reduction of revenue rather than marketing, so the true cost of acquiring customers is higher than the reported line. Nine-month 2026 spend was $2,332 million.
What is Airbnb's advertising budget?
Airbnb's 2025 10-K puts advertising expenses at $843 million, down from $1.1 billion in 2024. Its broader brand and performance marketing line was $1,595 million, and total sales and marketing was $2,588 million, or 21% of revenue. Since 2020 Airbnb has shifted spending from performance marketing toward brand marketing.
Has Uber ever made a profit?
Yes. Uber's 2023 10-K reports net income attributable to Uber of $1,887 million for 2023, after a $9,141 million loss in 2022. Its 2025 10-K shows $9,856 million for 2024 and $10,053 million for 2025, though the 2025 figure includes a $5.0 billion benefit from releasing a tax valuation allowance.
How much is Uber's CEO paid?
Uber's 2026 proxy statement reports total 2025 compensation of $35,595,826 for CEO Dara Khosrowshahi, made up mostly of stock and option awards. His base salary was $1,083,333 for 2025 after a 10% raise to $1.1 million, and his annual cash incentive paid $2,838,660. His 2024 total was $39,408,629.
Which company spends the most money on marketing?
Among companies that disclose a figure, Amazon is the largest we have checked: its 2025 10-K reports advertising and other promotional costs of $23.5 billion. That is more than ten times Uber's $2.2 billion of advertising and about 15 times DoorDash's $1.6 billion. Many companies do not report advertising separately, so no complete ranking exists.
What is the 70/20/10 rule for marketing budget?
It splits marketing effort into 70% on proven, low-risk work, 20% on variations of what already works, and 10% on high-risk new ideas. Social Media Today described Coca-Cola using this split in its Content 2020 plan in November 2012. It is a rule of thumb for allocating budget, not a benchmark drawn from any company filing.
What big companies spend on marketing