

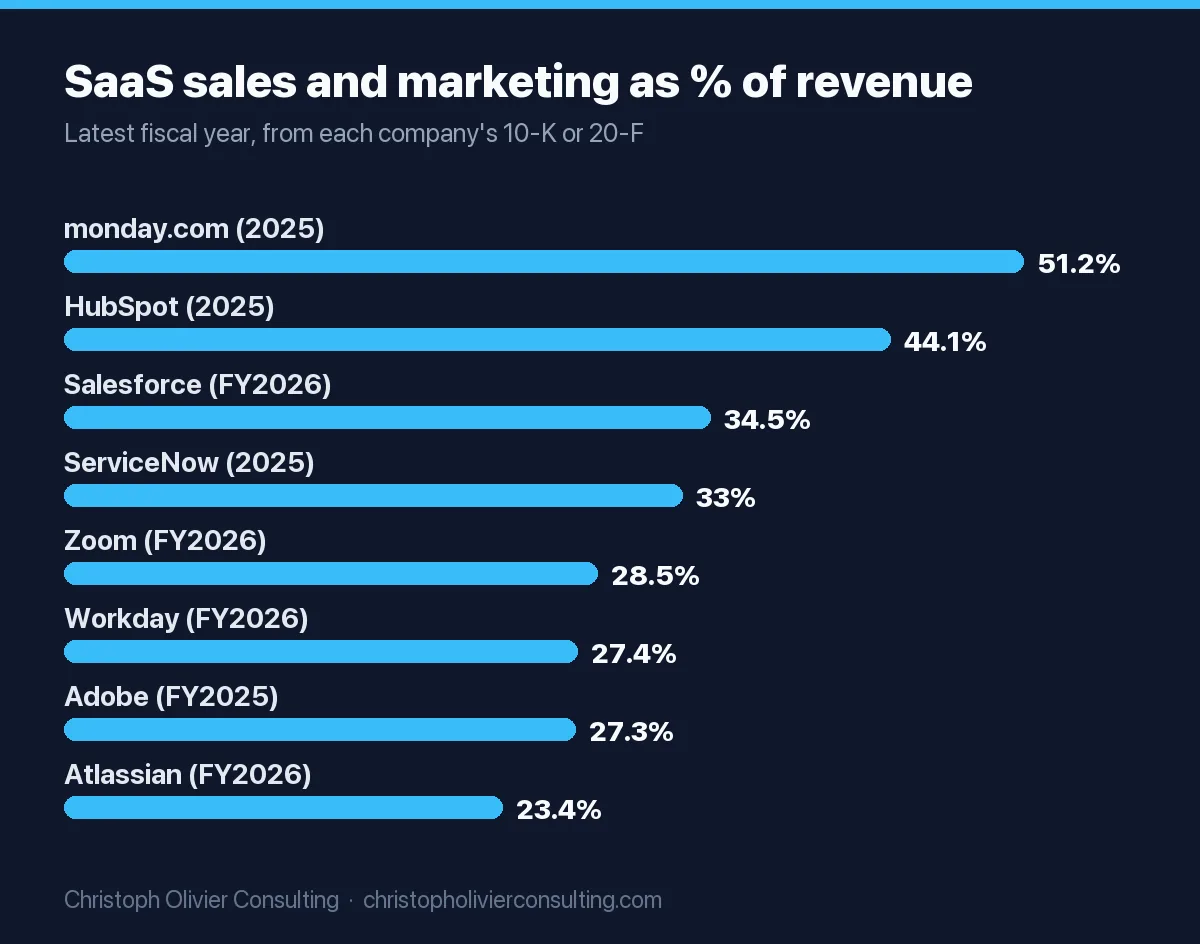
Public SaaS companies spend between 14% and 51% of revenue on sales and marketing, and the middle of the nine below sits at 28.5%. Salesforce spent $14.3 billion (34.5% of revenue) in fiscal 2026 and HubSpot $1.38 billion (44.1%) in 2025. Private B2B SaaS companies are far leaner: the median spends 8% of ARR on marketing and 15% on selling, according to SaaS Capital’s 2026 survey of more than 1,000 companies.
Short answer: Salesforce: $14.3 billion of sales and marketing in fiscal 2026 (34.5% of revenue), of which $0.8 billion was advertising. HubSpot: $1.38 billion in 2025 (44.1%), including $144.3 million of advertising. A private B2B SaaS company typically spends about 8% of ARR on marketing and 23% on sales and marketing combined (SaaS Capital, 2026 survey). Equity-backed companies spend roughly twice what bootstrapped ones do on marketing.
Every company figure below comes from the company’s own annual report on SEC EDGAR, read in November 2026. SaaS companies do not report “marketing” on its own. They report one combined line, sales and marketing (Salesforce’s fiscal 2024 10-K and earlier ones call it “marketing and sales”, and Atlassian still does), which bundles salespeople, commissions, marketing staff, programs, events and stock-based pay. The only pure marketing number most of them disclose is advertising expense, in the accounting policy notes. This page shows both.
SaaS company marketing spend compared (latest fiscal year)
Spend and revenue in each row come from the same filing. The two percentages are my calculations, with one formula for every company: line item ÷ total revenue × 100. Worked example, Salesforce fiscal 2026: $14,345 million ÷ $41,525 million × 100 = 34.5%.
| Company | Fiscal year end | Sales and marketing (reported) | Revenue | S&M % of revenue | Advertising expense (reported) | Advertising % of revenue | Source |
|---|---|---|---|---|---|---|---|
| Salesforce | Jan 31, 2026 | $14,345M | $41,525M | 34.5% | $0.8B | 1.9% | 10-K, FY2026 |
| Adobe | Nov 28, 2025 | $6,488M | $23,769M | 27.3% | $1.37B | 5.8% | 10-K, FY2025 |
| ServiceNow | Dec 31, 2025 | $4,388M | $13,278M | 33.0% | $348M | 2.6% | 10-K, 2025 |
| Workday | Jan 31, 2026 | $2,616M | $9,552M | 27.4% | $181M | 1.9% | 10-K, FY2026 |
| Shopify | Dec 31, 2025 | $1,663M | $11,556M | 14.4% | $753M | 6.5% | 10-K, 2025 |
| Atlassian | Jun 30, 2026 | $1,541.2M (“marketing and sales”) | $6,572.3M | 23.4% | $206.4M | 3.1% | 10-K, FY2026 |
| Zoom | Jan 31, 2026 | $1,388.3M | $4,868.8M | 28.5% | $56.9M | 1.2% | 10-K, FY2026 |
| HubSpot | Dec 31, 2025 | $1,379.4M | $3,131.3M | 44.1% | $144.3M | 4.6% | 10-K, 2025 |
| monday.com | Dec 31, 2025 | $630.9M | $1,232.0M | 51.2% | $237.9M | 19.3% | 20-F, 2025 |
Three things stand out. First, the median of these nine is 28.5% of revenue (Zoom), which is close to the 33% that Benchmarkit’s 2025 benchmark report gives for public SaaS companies. Second, advertising is a small slice of the total: from 4.1% of sales and marketing at Zoom to 45.3% at Shopify (my calculation, advertising ÷ sales and marketing). Most of the money is people. Third, the two companies that sell most to small businesses through self-serve signups, monday.com and Shopify, have the highest advertising share, while enterprise sellers like Salesforce, Workday and ServiceNow spend under 3% of revenue on ads.
How much does Salesforce spend on marketing? $14.3 billion in fiscal 2026
Salesforce reported sales and marketing expense of $14,345 million for the fiscal year ended January 31, 2026, 35% of its $41,525 million revenue as the company rounds it, per its fiscal 2026 10-K. That makes it the largest sales and marketing budget in SaaS on this list, more than twice Adobe’s. The 10-K says the dollar increase came mainly from employee-related costs, including stock-based compensation, and from amortization of intangibles tied to the Informatica acquisition, which closed in November 2025.
How much does Salesforce spend on advertising?
Much less than the headline suggests. The same 10-K states advertising expense of $0.8 billion in fiscal 2026, down from $1.0 billion in fiscal 2025 and $1.1 billion in fiscal 2024. So Salesforce cut advertising by roughly a quarter over two years while total sales and marketing rose by $1.5 billion. Advertising was 5.6% of the sales and marketing line in fiscal 2026 (my calculation). The 10-K says the line consists primarily of employee-related costs and commissions for sales and marketing staff, payments to partners, marketing programs (advertising, events, corporate communications, brand building and product marketing) and allocated overhead.
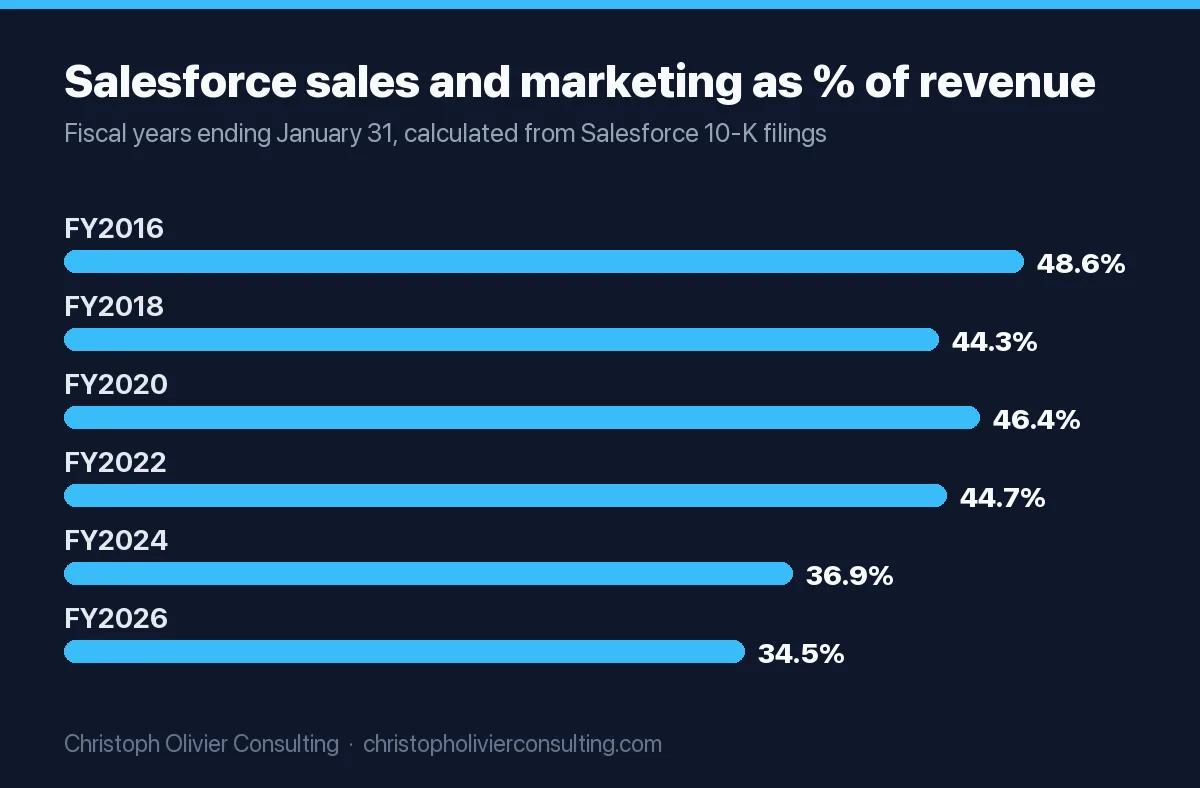
Salesforce marketing and sales expense as a share of revenue, fiscal 2016 to 2026
Salesforce has pulled its sales and marketing ratio down from about half of revenue to about a third. The figures below are calculated from four Salesforce 10-Ks (FY2016, FY2020, FY2024, FY2026).
| Fiscal year (ends Jan 31) | Marketing and sales / sales and marketing | Total revenue | % of revenue |
|---|---|---|---|
| FY2016 | $3,239.8M | $6,667.2M | 48.6% |
| FY2018 | $4,671M | $10,540M | 44.3% |
| FY2020 | $7,930M | $17,098M | 46.4% |
| FY2022 | $11,855M | $26,492M | 44.7% |
| FY2024 | $12,877M | $34,857M | 36.9% |
| FY2026 | $14,345M | $41,525M | 34.5% |
The step down came in fiscal 2024, the year Salesforce’s spending fell in absolute dollars (from $13,526 million to $12,877 million) while revenue grew 11%. The fiscal 2026 10-K says Salesforce expects sales and marketing may fall further as a share of revenue as it relies more on self-serve and partner-led channels and on AI and agents to raise sales productivity. In the first half of fiscal 2027 (six months to July 31, 2026) it spent $7,628 million, 33.9% of revenue, per its Q2 FY2027 10-Q.
HubSpot marketing spend: $1.38 billion in 2025, 44% of revenue
HubSpot reported sales and marketing expense of $1,379.4 million for 2025, 44% of its $3,131.3 million revenue, down from 46% in 2024, per its 2025 10-K. Advertising expense, which HubSpot includes in sales and marketing, was $144.3 million, up from $117.8 million in 2024 and $105.3 million in 2023.
HubSpot is unusually open about where the increase went. Of the $160.5 million year-over-year rise, the 10-K breaks out:
- Employee-related costs: +$115.7 million, from more sales and marketing headcount.
- Marketing programs: +$26.5 million, for new-customer acquisition.
- Professional fees: +$15.0 million, for outside contractors on marketing work.
- Allocated overhead: +$5.4 million. Software and services: +$5.1 million.
- Solutions Partner commissions: down $7.1 million.
The line also includes the cost of its annual INBOUND conference and commissions paid to agency partners who resell HubSpot. For the first nine months of 2026, HubSpot spent $1,185.7 million on sales and marketing, 43.3% of $2,740.3 million revenue, against 44.7% a year earlier, per its Q3 2026 10-Q. HubSpot itself is one of the best-documented examples of content-led acquisition, which is the subject of our guide to SaaS content marketing.
Adobe sales and marketing: $6.49 billion in fiscal 2025, with $1.37 billion of advertising
Adobe spent $6,488 million on sales and marketing in the fiscal year ended November 28, 2025, 27% of revenue, per its fiscal 2025 10-K. Advertising expense was $1.37 billion, up from $1.04 billion in fiscal 2024. Adobe says the sales and marketing increase was primarily due to higher advertising, and to a lesser extent compensation. That is the opposite of Salesforce: Adobe sells a lot to individual creators and small teams, where paid media does more of the work.
Atlassian marketing and sales: $1.54 billion in fiscal 2026
Atlassian, which now files a 10-K, reported marketing and sales expense of $1,541.2 million for the year to June 30, 2026, 23.4% of revenue, up 36% on the year, per its fiscal 2026 10-K. The rise includes $225.3 million more compensation, $78.5 million more advertising and marketing programs, and $51.5 million of restructuring charges. Advertising alone was $206.4 million. Atlassian’s filing explains why its ratio has historically been low: it relies mainly on word of mouth and low-touch demand generation to drive trials and first expansions, and uses field sales and partners for large enterprises.
Zoom sales and marketing: $1.39 billion in fiscal 2026
Zoom spent $1,388.3 million on sales and marketing in the year to January 31, 2026, 28.5% of revenue, per its fiscal 2026 10-K. That was 2.7% lower than the year before, mainly because stock-based compensation in the line fell by $64.7 million. Advertising was $56.9 million, the smallest share of revenue on this list (1.2%).
Shopify sales and marketing: $1.66 billion in 2025
Shopify reported $1,663 million of sales and marketing for 2025, 14% of revenue, per its 2025 10-K. The increase came from $242 million more marketing program spend and $41 million more employee-related costs, offset by $15 million lower affiliate partner payouts. Advertising inside sales and marketing was $753 million, up from $546 million. Shopify’s ratio is low partly because most of its revenue is merchant solutions, mainly payments: $8,804 million of the $11,556 million total in 2025.
monday.com sales and marketing: $630.9 million in 2025, 51% of revenue
monday.com spent $630.9 million on sales and marketing in 2025, up 18%, per its 2025 annual report on Form 20-F. That is 51.2% of its $1,232.0 million revenue, the highest share here. Advertising costs were $237.9 million. The filing calls sales and marketing its largest operating expense, and says sales commissions fell to about 2% of revenue in 2025 from 5% in 2024 after a change to its commission model.
ServiceNow and Workday: the enterprise pattern
ServiceNow spent $4,388 million on sales and marketing in 2025, 33.0% of revenue, per its 2025 10-K. Advertising was $348 million, a figure that excludes its annual Knowledge conference. Workday spent $2,616 million in the year to January 31, 2026, 27.4% of revenue, per its fiscal 2026 10-K, with $181 million of advertising, down from $204 million. Of Workday’s $184 million increase, only $19 million went to marketing programs. Enterprise SaaS budgets are mostly salaries and commissions for account teams.
SaaS marketing spend benchmarks for private companies
Public companies are not a good template for a $5 million ARR business. Two survey sources publish usable private-company medians. Both are self-reported surveys, and they measure different things: SaaS Capital reports percent of ARR, Benchmarkit reports percent of GAAP revenue.
| Benchmark | Median | Who it covers | Source |
|---|---|---|---|
| Marketing spend, all private B2B SaaS | 8% of ARR (unchanged from prior year) | 1,000+ companies, surveyed March 2026 | SaaS Capital 2026 |
| Selling costs, all private B2B SaaS | 15% of ARR (up from 13%) | Same survey | SaaS Capital 2026 |
| Marketing: bootstrapped vs equity-backed | About 5% vs about 10% of ARR (read from SaaS Capital’s chart; text says equity-backed spend 100% more) | Same survey | SaaS Capital 2026 |
| Sales: bootstrapped vs equity-backed | About 10% vs about 17% of ARR (chart; text says 70% more) | Same survey | SaaS Capital 2026 |
| Total spend, all departments | 96% of ARR bootstrapped, 101% equity-backed | Same survey | SaaS Capital 2026 |
| Sales and marketing combined, private SaaS | 37% of revenue | 157 respondents to this question (583 survey participants), 2024 data | Benchmarkit 2025 |
| Sales and marketing: VC-backed vs PE-backed | 45% vs 33% of revenue | Same survey (the report’s summary page says 47% for VC-backed) | Benchmarkit 2025 |
| Sales and marketing, private companies over $100M ARR | 33% of revenue, the same as public SaaS | Same survey | Benchmarkit 2025 |
| New-customer CAC ratio | $2.00 of sales and marketing per $1.00 of new-customer ARR (up 14%) | 73 respondents, 2024 data | Benchmarkit 2025 |
SaaS marketing budget by ARR size
SaaS Capital’s 2026 company-size chart, read by eye, puts median marketing at about 5% of ARR under $3 million, about 10% from $3 million to $20 million, and about 9% above $20 million. Median selling costs climb steadily with size, from about 9% of ARR under $1 million to about 18% above $20 million. One caution: the article’s own text example for a $3 million to $5 million company says 8% on marketing and 12% on selling, slightly below what its chart shows. Use the range, not a single decimal.
The pattern matches the public filings: as companies grow, selling costs rise faster than marketing, because enterprise deals need account executives, not more ads. If you are deciding which channels deserve that marketing money, our breakdown of SaaS marketing channels and plays covers the options by motion.
How much should a SaaS company spend on marketing?
Pick your starting benchmark from the row that matches your company, then test it against your growth target with the formula in the next section.
| Your situation | Marketing starting point | Sales and marketing starting point | Where it comes from |
|---|---|---|---|
| Bootstrapped, profitable, under $3M ARR | About 5% of ARR | About 15% of ARR | SaaS Capital 2026 medians (funding and size charts) |
| Equity-backed, $3M to $20M ARR | About 10% of ARR | About 25% of ARR | SaaS Capital 2026 medians |
| VC-backed, growth priority | Not split out | About 45% of revenue | Benchmarkit 2025 median |
| PE-backed or efficiency priority | Not split out | About 33% of revenue | Benchmarkit 2025 median |
| Self-serve, low price point (product-led) | Higher advertising share | Compare monday.com (51%, ads 19% of revenue) and Atlassian (23%) | Company 20-F and 10-K |
| Enterprise, sales-led | Advertising under 3% of revenue | Compare Salesforce (34.5%), ServiceNow (33%), Workday (27%) | Company 10-Ks |
The “sales and marketing starting point” for the first two rows adds SaaS Capital’s marketing and sales medians together, which is my approximation, not a figure the survey publishes. In my view, the percentage should be the output of your plan, not the input: a benchmark tells you if your number is unusual, not if it is right.
SaaS marketing budget formula, with a worked example
Use two methods and compare them. The gap between them is the real budget conversation.
Top-down: Marketing budget = ARR × benchmark marketing % of ARR. Sales budget = ARR × benchmark sales %.
Bottom-up: Sales and marketing budget = target new-customer ARR × new-customer CAC ratio. The CAC ratio is your last four quarters of sales and marketing spend divided by new-customer ARR added in the same period. If you do not have it, use Benchmarkit’s $2.00 median as a placeholder. Our customer acquisition cost benchmarks explain how to calculate yours.
Worked example (illustrative company, my numbers): an equity-backed SaaS company at $6 million ARR wants to add $1.2 million of ARR from new customers next year.
- Top-down marketing: $6,000,000 × 10% = $600,000. Top-down sales: $6,000,000 × 15% = $900,000. Combined: $1,500,000, or 25% of ARR.
- Bottom-up: $1,200,000 new ARR × $2.00 = $2,400,000 of sales and marketing, or 40% of ARR.
- Gap: $2,400,000 minus $1,500,000 = $900,000.
- Choose one: fund the $2.4 million (40% of ARR sits between Benchmarkit’s 37% private median and 45% VC-backed median, so it is defensible if you have the cash); cut the new-ARR target to what $1.5 million buys at $2.00, which is $750,000; or commit to a better CAC ratio, which at $1.5 million and $1.2 million of new ARR would have to be $1.25.
Copy-ready SaaS marketing budget worksheet
| Line | Formula | Example ($6M ARR) | Your number |
|---|---|---|---|
| A. Current ARR | From billing system | $6,000,000 | |
| B. Target new-customer ARR | Growth plan minus expected expansion | $1,200,000 | |
| C. New-customer CAC ratio | Trailing 4 quarters S&M ÷ new-customer ARR (placeholder $2.00) | $2.00 | |
| D. Required S&M budget | B × C | $2,400,000 | |
| E. Benchmark S&M budget | A × your row from the table above | $1,500,000 | |
| F. Gap | D minus E | $900,000 | |
| G. Marketing share of S&M | Your current split (benchmark example: 10 ÷ 25 = 40%) | 40% = $960,000 of D | |
| H. Paid media inside marketing | Decide by motion: self-serve high, enterprise low (public range: 4% to 45% of S&M is advertising) | Set per channel test | |
| Pass/fail check | D ÷ A within your benchmark row ±10 points, and payback within your cash runway | 40% vs 25%: fail on benchmark, review |
When the worksheet fails, the fix is usually the CAC ratio, not the budget. The LTV to CAC ratio guide shows how to judge whether paying more per customer is still worth it. For the general method behind percent-of-revenue budgeting outside SaaS, see how to set a marketing budget, and if you want someone to pressure-test your plan, you can book a consultation.
SaaS rules of thumb people ask about
What is the 3 3 2 2 2 rule of SaaS?
It is T2D3, “triple, triple, double, double, double”, a growth path described by Battery Ventures partner Neeraj Agrawal in a 2015 article. Once a company reaches $2 million of ARR, it triples to $6 million, triples to $18 million, then doubles to $36 million, $72 million and $144 million. It is a growth target, not a spending rule, but it explains why venture-backed companies accept sales and marketing ratios of 45% or more.
What is the Rule of 40 in SaaS?
Revenue growth rate plus profit margin should add up to at least 40%. Brad Feld described it in February 2015, crediting a late-stage investor. Investors vary in which profit measure they use. Using GAAP operating margin (my calculation): Salesforce fiscal 2026 scores 9.6% growth plus 20.1% margin, about 30. HubSpot 2025 scores 19.2% growth plus 0.2% margin, about 19. On free cash flow margins both would score higher, so always state which margin you used.
What is the 70/20/10 rule for a marketing budget?
A common planning heuristic: about 70% of the budget on proven channels, 20% on promising ones and 10% on experiments. No survey or filing sets it as a standard. For a SaaS company it is a sensible way to split the marketing line (G in the worksheet), not a way to size it.
Which company spends the most on marketing?
In SaaS, Salesforce, with $14.3 billion of sales and marketing in fiscal 2026. Across all companies that disclose advertising, Amazon is far ahead: $23.5 billion of “advertising and other promotional costs” in 2025, per its 2025 10-K. Consumer brands are compared in big brand marketing budgets.
What the filings do not tell you
- No company here discloses a marketing-only total. Sales and marketing combines both teams. Advertising is the only marketing-specific figure, and definitions differ: ServiceNow excludes its Knowledge conference, HubSpot’s line includes INBOUND and partner commissions.
- Stock-based compensation is inside the line. Zoom’s 2026 decline was mostly lower stock pay, not less marketing activity.
- Acquisitions distort trends. Salesforce’s fiscal 2026 figure includes amortization of intangibles from Informatica.
- Fiscal years differ. Salesforce, Workday and Zoom end January 31; Adobe ends in late November; Atlassian ends June 30. Compare percentages, not calendar years.
- Private surveys are self-reported. SaaS Capital and Benchmarkit figures are medians from companies that chose to answer, and the two use different denominators (ARR vs revenue).
Ready to scale your revenue?
Book a free 30-min consultation. We’ll diagnose your growth bottleneck and map out the 3 highest-leverage moves for your business.
Frequently asked questions
How much do SaaS companies spend on marketing?
Public SaaS companies report sales and marketing of 14% to 51% of revenue; the median of nine large ones (Salesforce, Adobe, ServiceNow, Workday, Shopify, Atlassian, Zoom, HubSpot, monday.com) is 28.5% in their latest 10-K or 20-F. Private B2B SaaS companies spend a median 8% of ARR on marketing and 15% on selling, per SaaS Capital's 2026 survey of over 1,000 companies.
How much does Salesforce spend on marketing?
Salesforce reported sales and marketing expense of $14,345 million for fiscal 2026 (year ended January 31, 2026), 34.5% of its $41,525 million revenue. Advertising within that was $0.8 billion, down from $1.0 billion in fiscal 2025 and $1.1 billion in fiscal 2024. Most of the line is staff, commissions, partner payments and marketing programs.
How much does HubSpot spend on marketing?
HubSpot's 2025 10-K reports sales and marketing expense of $1,379.4 million, 44% of its $3,131.3 million revenue, down from 46% in 2024. Advertising expense was $144.3 million. In the first nine months of 2026 it spent $1,185.7 million on sales and marketing, 43.3% of revenue, per its Q3 2026 10-Q.
What is a typical SaaS marketing budget as a percentage of ARR?
SaaS Capital's 2026 survey of private B2B SaaS companies puts the median marketing spend at 8% of ARR, with equity-backed companies spending about twice what bootstrapped ones do (roughly 10% versus 5%, read from its chart). Sales and marketing combined runs at a 37% median of revenue in Benchmarkit's 2025 report, 45% for VC-backed and 33% for PE-backed companies.
What is the 3 3 2 2 2 rule of SaaS?
It is T2D3, triple, triple, double, double, double, described by Battery Ventures partner Neeraj Agrawal in 2015. From $2 million of ARR a company triples to $6 million and $18 million, then doubles to $36 million, $72 million and $144 million. It is a growth target, not a spending rule.
What is the Rule of 40 in SaaS?
A SaaS company's revenue growth rate plus its profit margin should total at least 40%. Brad Feld described it in February 2015. Using GAAP operating margin, Salesforce's fiscal 2026 scores about 30 (9.6% growth plus 20.1% margin) and HubSpot's 2025 about 19. Investors often use free cash flow margin instead, which scores higher.
What is the 70/20/10 rule for a marketing budget?
It is a planning heuristic: about 70% of the marketing budget on proven channels, 20% on promising ones and 10% on experiments. No survey or regulator sets it as a standard. Use it to split a SaaS marketing budget you have already sized from ARR benchmarks and your CAC ratio, not to decide how big the budget should be.
What big companies spend on marketing