

A typical paid tax preparer handles somewhere between 100 and 300 individual returns a year, and the single best current benchmark is a median of 160 filings per preparer, from a 2026 CPA Journal analysis that linked IRS e-file and PTIN records. The spread is huge: the last time the IRS published a full distribution, a quarter of everyone who signed a paid return did fewer than five, while about 6,000 preparers did more than 1,000 each. At the 2025 average fee of $236 for a basic Form 1040, 160 clients works out to roughly $38,000 in gross fees before any add-on schedules.
Short answer: The median tax preparer files about 160 returns a year (CPA Journal, 2024 e-file data), and the last official IRS average was 122 returns per preparer in 2013. Most practices land between 21 and 1,000 returns: in the 2025 NATP Fee Study, 28% of offices prepared 101 to 300 Form 1040s and 13% prepared more than 1,000. At NATP’s 2025 average fee of $236 for a basic 1040, each individual client is worth roughly $236 to $370 in prep fees, depending on schedules.
How many clients does a tax preparer have? The benchmarks that exist
No agency publishes a live “clients per preparer” number. What you can build an honest answer from is four sets of data, each measuring something slightly different. Read the “what it measures” column before you compare yourself to any of them.
| Benchmark | Figure | What it measures | Period | Source |
|---|---|---|---|---|
| Median filings per preparer | 160 | E-file submissions per matched PTIN holder, excluding the largest e-filers | 2024 e-file data | CPA Journal (Garrett and Donnelly) |
| Filings per person, multi-preparer firms | 183 to 322 on average | Firms with two or more matched PTIN holders | 2024 e-file data | CPA Journal |
| Average returns per preparer (official) | 122 | Individual returns signed per paid preparer, all preparers | Processing year 2013 | IRS Return Preparer Industry Analysis |
| Most common office size | 101 to 300 returns (28% of offices) | Form 1040s prepared per office, survey of NATP members | 2025 | 2025 NATP Fee Study |
| Crude national ratio | About 100 | 90,095,000 returns e-filed by tax professionals divided by 902,514 current PTIN holders | 2026 season to Oct. 16; PTINs as of Nov. 1, 2026 | Our calculation from IRS filing season statistics and IRS PTIN statistics |
The crude ratio understates working preparers, because plenty of PTIN holders sign few or no returns (reviewers, managers, credentialed people who keep a PTIN current). The CPA Journal median overstates “clients” slightly, because the IRS e-file dataset it used counts submissions, which the authors note include amended returns and extensions as well as originals. Put together, 100 to 160 is the honest middle for one person, and a full-time solo practice usually sits well above it.
One more distinction matters when you count: a client is not always one return. A married couple filing jointly is one Form 1040, but the same household may also bring a partnership return, a trust return or a separate state filing. If you are setting a capacity target, count returns. If you are setting a revenue target, count households.
How many clients does the average tax preparer have?
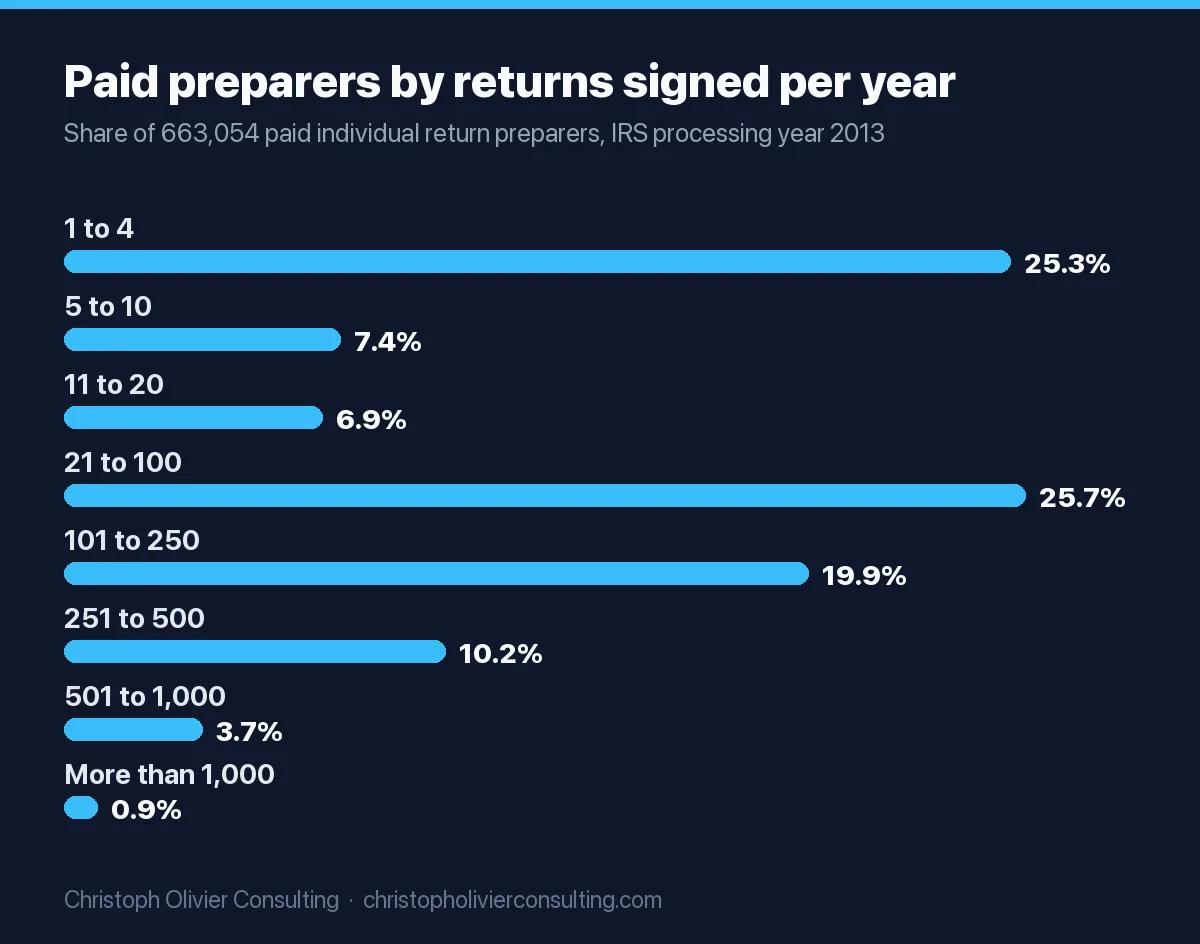
The average is pulled down by a long tail of very small preparers. In the IRS Office of Research study by Langetieg, Payne and Vigil, the average rose from 64 returns per preparer in 2004 to 82 in 2010, 99 in 2011, 111 in 2012 and 122 in 2013, as PTIN registration and the e-file mandate pushed occasional preparers out. Over that period the share of preparers doing fewer than five returns fell from 52% to 25%. The authors also found that preparers with more than 100 returns produced about 87% of all paid-prepared returns by 2013.
The CPA Journal analysis shows the same shape a decade later. Among firms with a single matched PTIN, 9% filed under 10 returns, 31% under 50 and 45% under 100. Firms with two or more preparers had a much more normal spread, averaging 183 to 322 submissions per person. In plain terms: the “average” preparer is a mix of part-timers and full-time professionals, and the full-time professionals are the 200 to 300 group.
Returns per preparer: the full IRS distribution
This is the only official breakdown of how many returns individual preparers sign, split by credential. It is old (processing year 2013) but nothing newer has been published at this level of detail. We compiled the shares from Table 1 and Table 2 of the IRS study.
| Returns signed per year | All paid preparers | Share of all | CPAs (share) | Enrolled agents (share) | Average returns in this band |
|---|---|---|---|---|---|
| 1 to 4 | 167,582 | 25.3% | 13.4% | 7.1% | 2 |
| 5 to 10 | 49,176 | 7.4% | 8.8% | 5.0% | 7 |
| 11 to 20 | 45,945 | 6.9% | 8.4% | 5.3% | 15 |
| 21 to 100 | 170,175 | 25.7% | 29.1% | 23.7% | 54 |
| 101 to 250 | 131,886 | 19.9% | 23.3% | 26.9% | 163 |
| 251 to 500 | 67,654 | 10.2% | 12.3% | 21.1% | 346 |
| 501 to 1,000 | 24,585 | 3.7% | 4.1% | 8.8% | 668 |
| More than 1,000 | 6,051 | 0.9% | 0.6% | 2.1% | not shown |
| Total | 663,054 | 100% | 175,035 CPAs | 42,472 EAs | 122 |
Source: IRS, Return Preparer Industry Analysis, processing year 2013. CPA and EA columns cover PTIN holders who self-reported that credential; the IRS ranked people with several credentials as CPA first, then EA. Counts are individual income tax returns only, so a CPA whose work is mostly business returns looks smaller here than they are.
How many clients does a CPA usually have?
For individual returns, the typical CPA preparer in the IRS data sat in the 21 to 250 band: 52% of CPAs signed between 21 and 250 Form 1040s, and only 17% signed more than 250. Enrolled agents skewed bigger: 59% of EAs signed more than 100 returns and 32% signed more than 250. That fits what you would expect. Many CPAs do audit, advisory or business returns and sign a modest number of 1040s, while many EAs run individual-return practices. Today the IRS counts 210,487 CPAs and 72,945 enrolled agents among 902,514 current PTIN holders (data as of Nov. 1, 2026).
How many returns a tax office prepares in 2025
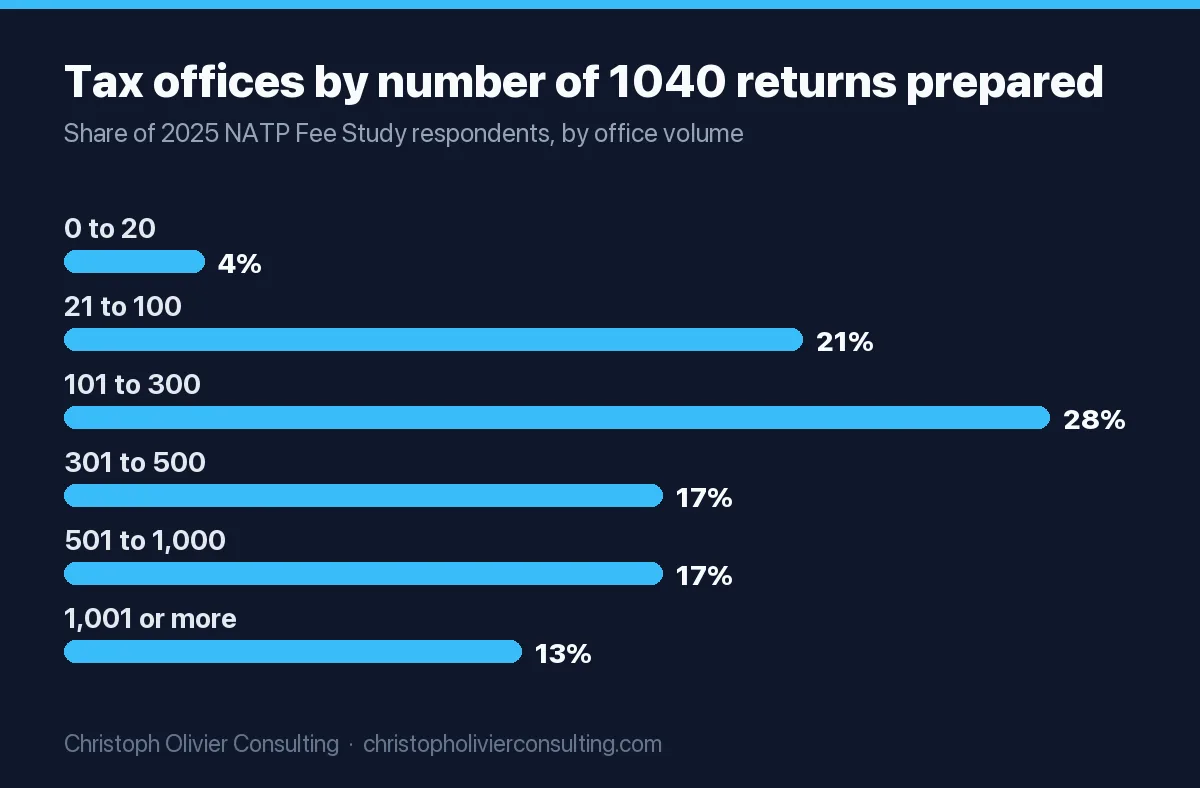
The 2025 NATP Fee Study asked practitioners how many Form 1040s their office prepares. The answers lean larger than the IRS averages because NATP respondents are committed professionals: 59% have 21 or more years in the business and 83% are practice owners or partners. So treat this as the benchmark for an established practice, not for the profession as a whole.
| 1040 returns prepared by the office | Share of NATP respondents (2025) | What that usually looks like |
|---|---|---|
| 0 to 20 | 4% | Family, friends, a few legacy clients |
| 21 to 100 | 21% | Part-time or seasonal solo practice |
| 101 to 300 | 28% | Full-season solo preparer |
| 301 to 500 | 17% | Solo with seasonal help, or two preparers |
| 501 to 1,000 | 17% | Small firm with several preparers |
| 1,001 or more | 13% | Multi-preparer firm |
The third column is our reading of each band, not part of the survey. The same study found 87% of clients are returning clients and 13% are new each year, which is why client count in this business grows slowly and compounds. A practice that keeps its book and adds referrals gains a little every season; one that loses its retention gains nothing from new marketing.
How much does a tax preparer make per client?
Per client, a preparer charges the base return plus each schedule and state return the client needs. The NATP analysis of its 2025 Fee Study gives the anchors: an average of $236 for a Form 1040 with Schedules 1 to 3, with the middle half of preparers charging $150 to $328, plus about $59 for Schedule A and about $69 for Schedule D. Its own worked example of a 1040 with Schedules A and D comes to $364.
| Client type | Typical fee build | Average fee per client | Source |
|---|---|---|---|
| W-2 household, standard deduction | 1040 with Schedules 1 to 3 | $236 (middle half $150 to $328) | NATP 2025 |
| Homeowner who itemizes | $236 base + Schedule A (~$59) | About $295 | Our sum of NATP averages |
| Itemizer with investments | Base + Schedule A + Schedule D | $364 | NATP worked example |
| Sole proprietor | Base + Schedule C ($123 to $135 by community size) | About $359 to $371 | Our sum; Schedule C averages via Accounting Today’s NATP coverage |
| Business entity return | Minimum fee, then complexity | $634 average minimum (middle half $350 to $850) | Accounting Today, NATP 2025 |
| Hourly billing (7% of preparers) | Set hourly rate | $182 per hour average (middle half $129 to $250) | NATP 2025 |
State returns are extra for most practices: 54% of NATP respondents charge for any state return, while 18% add no fee for a state return prepared with the federal one, per Accounting Today. The NATP figures are averages of what preparers charge, not what any one client must pay, and they come from a member survey, so read them as a strong signal rather than a census.
How much are you supposed to pay your tax preparer?
For a straightforward individual federal return in 2025, the NATP data puts the national average at $236, and credentials move it noticeably. Market size matters too.
| Preparer profile | Average 1040 (Schedules 1 to 3) | Typical range (middle half) | Schedule A average |
|---|---|---|---|
| CPA | $280 | $200 to $425 | $65 |
| Enrolled agent | $228 | $150 to $300 | $59 |
| No designation | $186 | $121 to $248 | $54 |
| AFSP participant | $184 | $115 to $235 | $53 |
| Clients in towns under 10,000 people | $185 | $125 to $250 | $53 |
| Clients in places of 50,000 or more | $233 | $150 to $320 | $61 |
Source: NATP, “What the 2025 NATP Fee Study Tells You, At a Glance”, November 2025. Prices also keep moving: 83% of respondents raise fees every one to two years, typically by 6% to 10%, and 68% planned an increase for the next season.
The gap between AFSP participants ($184) and enrolled agents ($228) is one reason credentials matter for income. The Annual Filing Season Program is the IRS’s voluntary program for preparers who are not CPAs, EAs or attorneys, and the IRS walks through how to join it in a short video on its official IRSvideos channel.
How much can a tax preparer make?
It depends on whether you are an employee or own the practice, because the two are measured in completely different ways.
Employed preparers. The Bureau of Labor Statistics counts 76,480 wage-and-salary tax preparers in its May 2025 Occupational Employment and Wage Statistics. Their median annual wage was $54,920 and the mean was $60,930, or $26.40 median and $29.30 mean per hour. The 10th percentile earned $33,760 and the 90th percentile $99,270. BLS excludes self-employed owners, so these numbers describe people on a payroll, often in seasonal or year-round staff roles.
Practice owners. For owners the better measure is gross revenue. In the 2025 NATP Fee Study, 27% of respondents reported gross revenue of $300,000 or more, up from 19% in 2023, while 20% reported under $50,000, down from 29%. Tax form preparation made up 65% of revenue on average, with bookkeeping at 12%. That is gross revenue for the practice, which pays software, insurance, rent and any staff before the owner is paid.
Which tax preparer pays the most?
Within the employed group, the top 10% earn $99,270 or more (BLS, May 2025). Among owners, the fee data points at three levers: credentials (CPAs average $280 per basic 1040 against $186 for preparers with no designation), market size ($233 in places of 50,000 or more against $185 in towns under 10,000) and business returns, where the average minimum fee is $634. Practices that pair individual returns with advisory services also price higher, according to NATP.
What 160 clients is worth: tax preparer income per client, worked out
Here is the arithmetic that connects client count to income. Gross fees equal returns times the average fee per return. The table uses the NATP averages above and client counts taken from the benchmarks in this article. It is a model, not survey data, and it shows gross fees, not profit.
| Scenario | Returns per year | At $236 (basic 1040) | At $295 (1040 + Schedule A) | At $364 (1040 + A + D) |
|---|---|---|---|---|
| Side practice (45% of solo firms file 100 or fewer) | 75 | $17,700 | $22,125 | $27,300 |
| Official 2013 IRS average | 122 | $28,792 | $35,990 | $44,408 |
| Median preparer (CPA Journal) | 160 | $37,760 | $47,200 | $58,240 |
| Top of the most common NATP band | 300 | $70,800 | $88,500 | $109,200 |
| Busy solo with seasonal help | 500 | $118,000 | $147,500 | $182,000 |
| Multi-preparer firm | 1,000 | $236,000 | $295,000 | $364,000 |
Two adjustments make the model more realistic for your practice. First, most books are a mix: a few business returns at a $634 average minimum change the total far more than another 20 simple 1040s. Second, if tax prep is 65% of your revenue, as it is for the average NATP respondent, divide prep fees by 0.65 to estimate total practice revenue including bookkeeping, payroll and advisory work.
Is tax preparer a good side hustle?
The data says many people treat it as one. The CPA Journal authors found 45% of single-PTIN firms submit 100 or fewer returns a year and concluded that many “may be operating on a seasonal basis or supplementing another business line.” The entry cost to start is low: a PTIN costs $18.75 to obtain or renew. The ceiling is the season. NATP respondents earn 64% of their gross revenue from February to April, 21% from May to October and 15% from November to January. At 75 returns and NATP’s average fee, a side practice grosses about $17,700 to $27,300 before costs, per the model above.
Season capacity planner: how many clients can you take?
Client count is capped by hours in the busy season, not by demand. Use this planner before you spend on marketing, so you know whether you need more clients, more time or a higher fee. Fill in your own numbers; the returns per day figure is the one only you can know, so pull it from your software’s completion log for last season.
- Busy-season weeks (W). Count the weeks you will take new appointments before the April deadline.
- Working days per week (D). Be honest about Saturdays.
- Returns completed per day (R). Completed and filed, not started.
- Average fee per return (F). Use last season’s total prep fees divided by returns, or start from the NATP averages above.
- Season returns = W × D × R.
- Season fees = W × D × R × F.
- Full-year estimate = season fees ÷ 0.64, only if your seasonality looks like the NATP average (64% of revenue in February to April).
Worked example with illustrative inputs: 10 weeks × 6 days × 3 returns per day = 180 returns. At $295 per return that is $53,100 in season fees, and $53,100 ÷ 0.64 = about $82,970 for the year if the rest of your revenue follows the NATP pattern.
| Returns per day (10 weeks × 6 days) | Season capacity (returns) | Season fees at $236 | Season fees at $295 | Pass/fail check against a 250-client goal |
|---|---|---|---|---|
| 2 | 120 | $28,320 | $35,400 | Fail: extend the season or raise fees |
| 3 | 180 | $42,480 | $53,100 | Fail: move 70 returns to extension season or add help |
| 4 | 240 | $56,640 | $70,800 | Borderline: no slack for complex returns |
| 5 | 300 | $70,800 | $88,500 | Pass, with 50 returns of slack |
| 6 | 360 | $84,960 | $106,200 | Pass: capacity for growth |
If the check fails, you have three options: push some returns to extension season (NATP preparers already earn 21% of revenue from May to October), add seasonal help, or raise the average fee so fewer clients reach the same income. In my view the third option is underused, since the fee data shows a wide middle-half spread at every credential level, so the same client book can carry very different revenue. If you raise prices, our price increase letter templates for accountants give you wording to send before the season opens.
Who prepares America’s returns
What percentage of people use a tax preparer?
About 57% of e-filed individual returns in 2026 came from tax professionals. Through October 16, 2026, the IRS received 90,095,000 e-filed returns from tax professionals and 67,997,000 self-prepared e-filed returns, out of 166,946,000 total returns received. Professional e-filings rose 3.8% from 2025, faster than self-prepared e-filings at 1.7%. Measured against all returns received, including paper, the professional e-file share is about 54%; some paper returns are also paid-prepared, so the true share is somewhat higher.
How many clients does H&R Block have?
H&R Block prepared 11.3 million U.S. assisted tax returns in its fiscal year ended June 30, 2026, and its clients filed another 3.6 million paid DIY online returns, according to its fiscal 2026 Form 10-K. The company’s peak employment during that year, including seasonal workers, was about 73,400. You cannot divide one number by the other to get returns per preparer: the return count includes franchise offices whose staff are not H&R Block employees, and the headcount includes people who do not prepare returns. In the IRS e-file data analyzed by the CPA Journal, H&R Block accounted for 10% of submissions, behind Intuit at 20%.
How to use these numbers in your own practice
Most solo preparers will never see a national dashboard, but you can see your own count. Every PTIN holder can open the “Returns per PTIN” tile in their IRS PTIN account, which shows Form 1040 series returns processed under that PTIN, updated weekly. Compare it with the bands above:
- Under 100 returns: you are in the same bracket as 45% of single-PTIN firms. Growth usually comes from retention and referrals first, since 87% of a typical book is returning clients. Our referral program ideas for accountants cover how to ask without sounding needy.
- 100 to 300 returns: you are the typical full-season solo. The capacity planner usually shows a ceiling here, so the next dollar comes from fee mix (more Schedule C and business returns) or a second preparer. If you want to shape demand around that ceiling, a seasonal marketing plan for tax firms helps book work into the off months.
- 300 returns and up: you are above the median by a wide margin and probably need staff. At this point the question is less “how many clients” and more “which clients,” and a year-round plan for getting more of the right tax clients is worth more than raw volume.
If you would like a second opinion on where your practice’s growth should come from, you can book a consultation.
Ready to scale your revenue?
Book a free 30-min consultation. We’ll diagnose your growth bottleneck and map out the 3 highest-leverage moves for your business.
Frequently asked questions
How many clients does a tax preparer have?
Most paid preparers handle between 100 and 300 individual returns a year. A 2026 CPA Journal study of IRS e-file and PTIN records found a median of 160 filings per preparer, and the last official IRS average was 122 returns per preparer in 2013. Part-timers pull the average down: 45% of single-preparer firms file 100 or fewer returns a year.
How much does a tax preparer make per client?
In the 2025 NATP Fee Study the average fee for a Form 1040 with Schedules 1 to 3 was $236, with the middle half of preparers charging $150 to $328. Itemizing adds about $59 for Schedule A and investments about $69 for Schedule D, so NATP's example client with both pays $364. Business entity returns average a $634 minimum fee.
How many clients does a CPA usually have?
In the IRS preparer study for 2013, 52% of CPAs who signed returns did between 21 and 250 individual returns a year, and only 17% did more than 250. Enrolled agents ran larger individual books, with 59% signing more than 100. CPAs often focus on business returns, audit or advisory work, so their 1040 count understates their total client list.
What percentage of people use a tax preparer?
About 57% of e-filed individual returns in 2026 came from tax professionals. IRS filing season statistics through October 16, 2026 show 90.1 million e-filed returns from tax professionals and 68.0 million self-prepared e-filed returns. Against all 166.9 million returns received, including paper returns, the professional e-file share is about 54%.
How many clients does H&R Block have?
H&R Block prepared 11.3 million U.S. assisted tax returns in its fiscal year ended June 30, 2026, and clients filed another 3.6 million paid DIY online returns, according to its Form 10-K. Peak employment, including seasonal workers, was about 73,400. Franchise offices are included in the return count but their staff are not company employees.
How much can a tax preparer make?
Employed tax preparers earned a median of $54,920 and a mean of $60,930 in May 2025, according to BLS, with the top 10% at $99,270 or more. Practice owners are measured by gross revenue: in the 2025 NATP Fee Study, 27% reported $300,000 or more and 20% reported under $50,000, before paying expenses.
Is tax preparer a good side hustle?
Many preparers run it as one. The CPA Journal found 45% of single-preparer firms file 100 or fewer returns a year. A PTIN costs $18.75, but income is seasonal: NATP respondents earn 64% of revenue from February to April. At 75 returns and NATP's average fees, a side practice grosses roughly $17,700 to $27,300 before costs.
How many clients: caseload research