

DraftKings reported $1,379.9 million of sales and marketing expense in 2025, of which $1,124.8 million was advertising, according to its 2025 Form 10-K. FanDuel does not file on its own, but parent Flutter Entertainment reports a U.S. segment, and that segment spent $1,319 million on sales and marketing in 2025, per Flutter’s 2025 10-K. Together, the two market leaders put about $2.7 billion into U.S. sales and marketing last year (our sum of the two filings).
Short answer: DraftKings: $1.38 billion sales and marketing in 2025 (22.8% of revenue), including $1.12 billion of advertising. FanDuel (Flutter U.S. segment): $1.32 billion sales and marketing in 2025 (18.9% of segment revenue). Both are spending faster in 2026: through September, DraftKings is up 41.9% and FanDuel’s segment is up 21%. BetMGM, Caesars Sportsbook and Fanatics do not publish a comparable figure.
Every company number below comes from an SEC filing or the operator’s own results release, read in November 2026. Where a company does not break a figure out, the table says “not disclosed” instead of filling the gap. One warning before the numbers: press stories that quote much smaller totals (one 2026 article put DraftKings at $485 million) are usually citing ad-tracking estimates of measured media, not the company’s accounts. The filings are the only full picture.
Sports betting marketing spend by company (fiscal 2025)
Line items differ by company, so the second column keeps each filing’s exact wording. Percentages are our calculation: disclosed spend divided by revenue from the same filing.
| Sportsbook (filer) | Exact line item | FY2025 spend | Revenue base | % of revenue | Source |
|---|---|---|---|---|---|
| DraftKings | “Sales and marketing” (advertising costs inside it: $1,124.8M) | $1,379.9M | $6,054.5M total revenue | 22.8% (advertising alone 18.6%) | DraftKings 10-K 2025 |
| FanDuel (Flutter U.S. segment) | Segment “Sales & marketing expenses” (excludes trademark amortization, stock pay, restructuring) | $1,319M | $6,967M U.S. segment revenue | 18.9% | Flutter 10-K 2025 |
| Flutter (all brands, worldwide) | “Advertising costs” / total “Sales and marketing expenses” | $2,053M / $3,678M | $16,383M group revenue | 12.5% / 22.5% | Flutter 10-K 2025 |
| BetMGM (50/50 MGM and Entain joint venture) | Not disclosed | Not disclosed | $2,796M net revenue | Not calculable | BetMGM FY2025 update |
| Caesars Sportsbook (Caesars Digital segment) | Not broken out; digital advertising is “primarily recorded in Casino expense” | Not disclosed (group advertising $237M) | $1,408M segment net revenue | Not calculable | Caesars 10-K 2025 |
| theScore Bet / ESPN BET (PENN Interactive segment) | Segment “Media and advertising” | $310.4M | $1,302.6M segment revenue (includes $588.3M of tax reimbursements) | 23.8% reported; 43.5% excluding the reimbursements | PENN 10-K 2025 |
| Fanatics Sportsbook | Private company, no filing | About $350M expected for 2026 (CEO statement) | About $2B betting and gaming sales (CEO statement) | Not calculable | Casino.org, citing Bloomberg, Oct 2, 2026 |
If you want the closest like-for-like comparison of the two leaders, use DraftKings’ own “adjusted sales and marketing expenses” from its segment note, which also strips out stock-based pay: $1,338.6 million, or 22.1% of revenue, against FanDuel’s $1,319 million and 18.9%. On that basis the two spent almost the same dollars, and FanDuel spread them over more revenue.
What is DraftKings’ marketing budget? $1.38 billion in 2025
DraftKings does not publish a forward “budget.” What it reports is what it spent. Its 10-K defines sales and marketing as “advertising, conferences, costs related to free to play contests, rent and facilities maintenance and the compensation of sales and marketing personnel.” Advertising costs, the narrower number, include media of every kind “such as internet, radio, print, television or billboards” plus “costs associated with strategic league and team partnerships.” That second clause matters: league and team sponsorship deals sit inside the advertising figure.
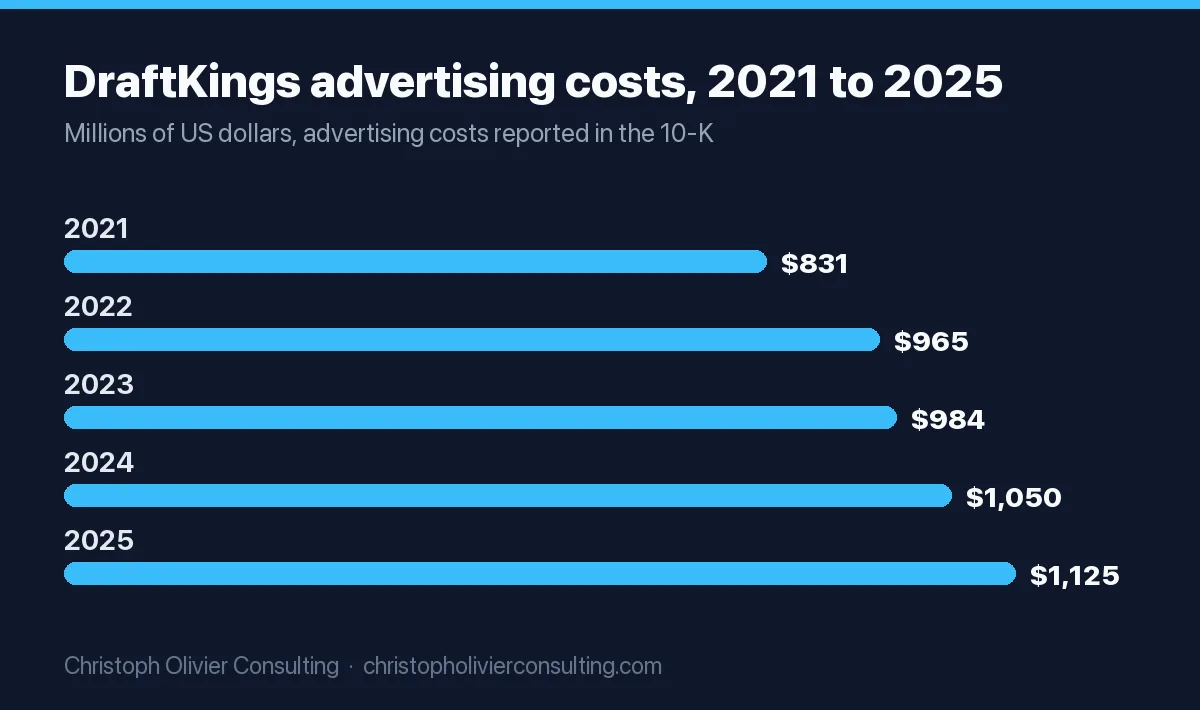
DraftKings advertising spend, 2021 to 2025
| Fiscal year | Revenue | Sales and marketing | Advertising costs | S&M % of revenue | Source |
|---|---|---|---|---|---|
| 2025 | $6,054.5M | $1,379.9M | $1,124.8M | 22.8% | 10-K 2025 |
| 2024 | $4,767.7M | $1,264.9M | $1,049.6M | 26.5% | 10-K 2025 |
| 2023 | $3,665.4M | $1,200.7M | $984.4M | 32.8% | 10-K 2023 |
| 2022 | $2,240.5M | $1,186.0M | $964.9M | 52.9% | 10-K 2023 |
| 2021 | $1,296.0M | $981.5M | $831.1M | 75.7% | 10-K 2023 |
The pattern is the story. Dollars kept rising every year, from $981.5 million to $1,379.9 million, while marketing as a share of revenue fell from 75.7% to 22.8%. The 2025 filing says the $115.0 million increase was “primarily attributable to an increase in advertising costs of $75.2 million.” This is what scale economics look like in a land-grab market: spend stays high in absolute terms, revenue grows into it, and the company swung from a $507.3 million net loss in 2024 to $3.7 million of net income in 2025.
DraftKings marketing in 2026 so far
The ratio has turned back up this year. In its third-quarter 2026 10-Q, DraftKings reported $1,329.9 million of sales and marketing for the nine months to September 30, 2026, up 41.9% from $937.2 million a year earlier, against revenue up 8.7%. Q3 alone was $605.7 million, up 68.1%. The company names the drivers: “external marketing costs primarily related to our prediction markets offering and the launch of our Super App, as well as customer acquisition costs associated with the FIFA World Cup and launches in new jurisdictions.” By our math, nine-month marketing reached 30.1% of revenue, up from 23.1%.
How much does FanDuel spend on advertising? $1.32 billion U.S. sales and marketing in 2025
FanDuel is a subsidiary of Flutter Entertainment, and Flutter’s 10-K reports the U.S. business as a segment. The segment’s sales and marketing line was $1,319 million in 2025, $1,278 million in 2024 and $1,150 million in 2023. As a share of U.S. revenue that is 18.9%, 22.0% and 26.1% (our calculation). Flutter’s own text confirms the direction: U.S. sales and marketing “increased by 3%” in 2025, driven by the Missouri launch and the new FanDuel Predicts product, while falling 310 basis points as a share of revenue.
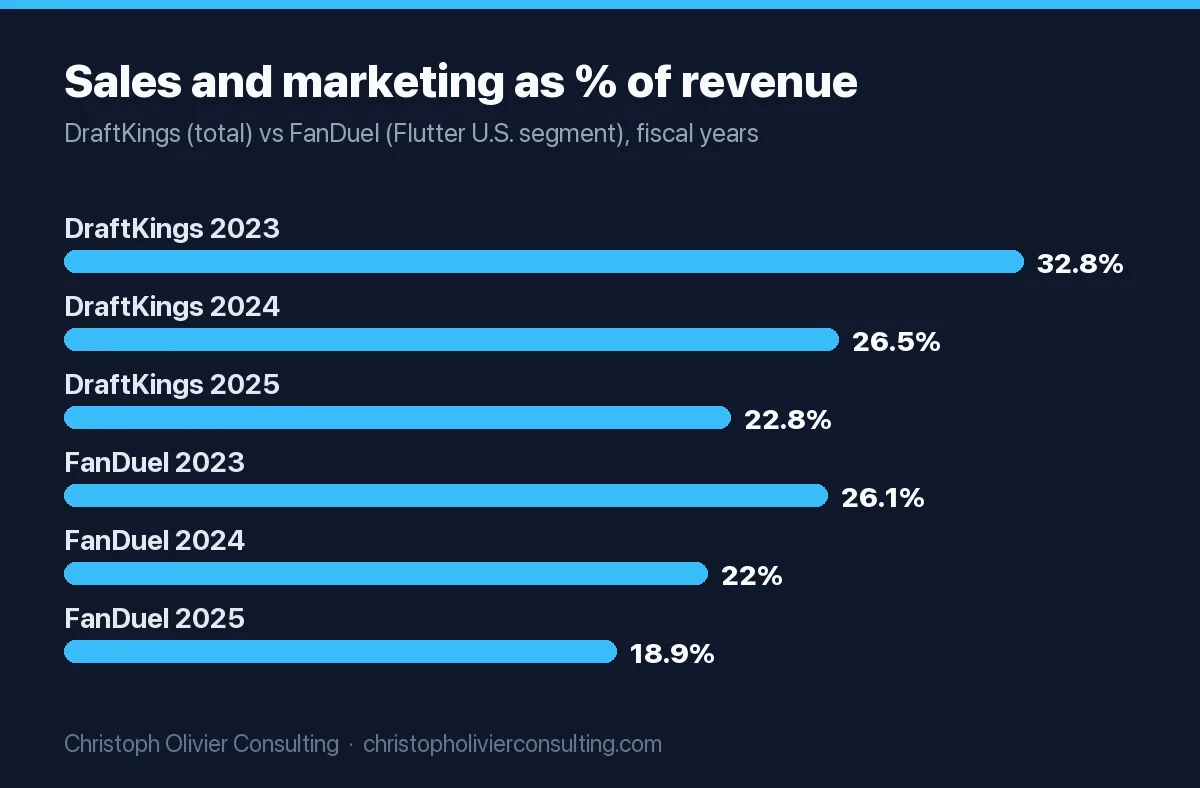
Two cautions when you quote FanDuel. First, Flutter only discloses an advertising-only figure for the whole group: $2,053 million in 2025, which includes Sky Bet, Paddy Power, PokerStars, Sisal and other international brands. Do not label that number “FanDuel.” Second, the segment line excludes trademark amortization and stock-based pay, so it runs a little cleaner than a GAAP total would.
FanDuel marketing in 2026 so far
Flutter’s third-quarter 2026 10-Q shows U.S. segment sales and marketing of $1,089 million for the nine months to September 30, 2026, up 21% from $900 million, on revenue of $4,901 million versus $4,825 million. That moves the ratio from 18.7% to 22.2% by our calculation. Flutter attributes the increase to “investments in the FIFA World Cup, new state launches and FanDuel Predicts.”
BetMGM, Caesars, ESPN BET and Fanatics: what is and is not disclosed
BetMGM
BetMGM is owned 50/50 by MGM Resorts and Entain and is not consolidated by either parent, so neither 10-K nor annual report line shows its marketing. Its FY2025 business update (Feb 4, 2026) reports net revenue of $2,796 million, EBITDA of $220 million and net income of $175 million, and credits “tailored marketing” and “sharper player management,” but gives no marketing dollar figure. MGM Resorts’ 10-K reports $398 million of advertising in 2025, but that is MGM’s consolidated resorts and LeoVegas business, not BetMGM.
Caesars Sportsbook
Caesars’ 10-K reports group advertising of $237 million in 2025 and says advertising “related to the Caesars Digital segment are primarily recorded in Casino expense.” The digital segment’s marketing is folded into $805 million of “other segment expenses,” which also covers platform labor, professional fees and software licenses. Caesars Digital produced $1,408 million of net revenue and $236 million of adjusted EBITDA. Marketing alone: not disclosed.
ESPN BET, now theScore Bet (PENN Entertainment)
PENN is the most transparent of the casino-owned operators. Its 2025 10-K shows Interactive segment “media and advertising” of $310.4 million in 2025, $407.0 million in 2024 and $144.9 million in 2023. The 2025 figure includes $155.6 million under the ESPN sportsbook agreement and $57.1 million tied to the ESPN investment agreement. PENN had agreed to pay ESPN $150.0 million a year in cash for “media marketing services and brand and other rights.” That agreement ended in November 2025 and the app was rebranded theScore Bet. The ratio needs care: segment revenue of $1,302.6 million includes $588.3 million of gaming-tax reimbursements from partners, so marketing was 23.8% of reported segment revenue but 43.5% of revenue excluding those pass-throughs (our calculation).
Fanatics Sportsbook
Fanatics is private. The only figures are its CEO’s: Michael Rubin told Bloomberg the company expects to spend about $350 million on betting promotion in 2026 and could spend as much as $1 billion in 2027, as reported by Casino.org on October 2, 2026. Treat that as a stated intention, not an audited number.
Sports betting advertising spend: the industry total
No regulator or trade body publishes an audited industry total for U.S. sports betting advertising. What you can build from filings: DraftKings ($1,379.9 million) plus FanDuel’s U.S. segment ($1,319 million) equals about $2.7 billion of 2025 sales and marketing for the two operators that dominate the market. Add PENN Interactive’s $310.4 million and the disclosed total passes $3.0 billion before counting BetMGM, Caesars, Fanatics and smaller books.
Television is the most visible slice but a small one. Measurement firm iSpot, as reported by Marketing Brew (Oct 4, 2024), estimated that between August 15 and the third week of the 2024 NFL season DraftKings spent $36.4 million on national linear TV, FanDuel $27.1 million and BetMGM $11.5 million. iSpot does not count streaming, regional ads or social, so these figures are a floor, not a budget.
Why the 10-K number understates customer acquisition cost
The biggest acquisition cost in sports betting never appears in the marketing line. Sign-up bonuses, deposit matches and bonus bets are booked as a reduction of revenue. DraftKings’ 10-K says the amount “reducing the revenues” of its products is “the portion of gross revenue that we allocate to new and existing user incentives and promotions,” including “free plays, deposit bonuses, discounts, rebates or other rewards.” Flutter describes sportsbook revenue as the spread “less winnings paid and expenses associated with promotional activity.” Neither company discloses the dollar amount of promotions. So when you see “$1.38 billion,” read it as paid media, sponsorships and marketing staff, with the bonus money spent on top and invisible.
For marketers in any category, the lesson transfers: if your offer discounts are booked against revenue, your reported marketing ratio flatters you. Our guide to the advertising-to-sales ratio by industry shows how much these ratios swing on accounting choices alone.
Formula: marketing cost per active customer (copy and reuse)
| Step | DraftKings, FY2025 | FanDuel (Flutter U.S.), FY2025 |
|---|---|---|
| 1. Sales and marketing expense | $1,379.9M | $1,319M |
| 2. Average monthly paying customers (company KPI) | 4.0M average monthly unique payers | 4.028M U.S. average monthly players |
| 3. Step 1 ÷ step 2 | $345 per average monthly payer | $327 per average monthly player |
| 4. Revenue per customer per month (company KPI) | $125 ARPMUP | Not disclosed in the same form |
| 5. Months of revenue needed to cover step 3 (step 3 ÷ step 4) | 2.8 months | n/a |
These are our calculations from each 10-K, and they ignore promotions, which would raise the cost. The method works for any subscription or repeat-purchase business: total marketing over average active customers, then compare with monthly revenue per customer. If you want to run it on your own numbers, our customer lifetime value guide and the CAC benchmark by industry give the inputs and comparisons.
How sportsbook advertising is restricted
Budget size is capped in practice by where and how operators are allowed to advertise. Three rule sets shape most U.S. sportsbook campaigns.
| Rule | AGA Responsible Marketing Code | Ohio Casino Control Commission | New Jersey DGE / Attorney General |
|---|---|---|---|
| Status | Industry self-regulation, updated March 28, 2023 | Binding rules: 3775-16-08 (effective Oct 15, 2022) and 3775-16-09 (effective Oct 26, 2024) | Advertising standards announced April 20, 2023 |
| Audience age | Place ads only where at least 73.6% of the audience is reasonably expected to be 21 or older | Must not target anyone under 21 or depict anyone under 21 (live game footage excepted) | Limit advertising where it would entice those under 21 |
| “Risk free” and “free” | No “risk free” language | “Free” or “risk-free” only if the patron need not risk their own money to use or withdraw winnings | No “risk-free” unless the patron is fully compensated for losses |
| Help messaging | Conspicuous responsible gaming message with toll-free helpline, where practical | Must include an approved problem gambling helpline | 1-800-GAMBLER displayed prominently |
| Colleges | No college partnerships promoting wagering; no NIL deals with amateur athletes | No advertising on Ohio college campuses except generally available media | Not specified in the announcement |
| Opt-out | Opt-out in every marketing email and text | Opt-out in every direct ad, honored within 15 days | Public must be able to opt out of direct advertising swiftly |
| Source | AGA code (PDF) | OAC 3775-16-08, 3775-16-09 | NJ Attorney General |
The 73.6% audience test is the one that quietly shapes media plans: it rules out many youth-skewing placements regardless of budget. Any regulated advertiser, from financial services to legal, faces a version of this. Our FTC advertising enforcement statistics show what happens when claims outrun the rules.
How much does the CEO of FanDuel make?
Amy Howe, FanDuel’s CEO through May 6, 2026, received total 2025 compensation of $8,979,757, mostly stock awards ($6,967,517) on a $1,059,898 salary, per Flutter’s 2026 proxy statement. Flutter’s May 2026 8-K says she left under a separation agreement with severance of $4,370,828, and that FanDuel President Christian Genetski “will assume responsibility for leading the FanDuel business.” His pay has not been disclosed in a proxy. For comparison, DraftKings CEO Jason Robins received $22,621,941 for 2025, almost all in stock, on a $1 salary, per DraftKings’ 2026 proxy. If you benchmark marketing leadership pay outside betting, our CMO salary data is a more useful reference.
Which company has the highest marketing budget?
Among U.S. sportsbooks, DraftKings reports the largest single-company figure: $1,379.9 million of sales and marketing in 2025. Flutter spends more in total ($3,678 million worldwide across all its brands), but its U.S. arm, FanDuel, spent $1,319 million. Across all industries, sportsbooks are not close to the top: Amazon reported $23.5 billion of “advertising and other promotional costs” in 2025 in its 10-K. Our breakdown of big brand marketing budgets compares Amazon, Coca-Cola, Nike and others on the same basis.
The useful takeaway for a non-betting business is the shape, not the size: the leaders bought share with marketing at 50% to 75% of revenue in their early years, then let revenue catch up. If you are weighing a similar push, set the ceiling with a payback rule first. That is the conversation I have most often with owners, and you can book a consultation if you want to work through your own numbers.
Ready to scale your revenue?
Book a free 30-min consultation. We’ll diagnose your growth bottleneck and map out the 3 highest-leverage moves for your business.
Frequently asked questions
How much does FanDuel spend on advertising?
FanDuel's parent Flutter reports the U.S. business as a segment. That segment spent $1,319 million on sales and marketing in 2025, 18.9% of U.S. revenue, and $1,089 million in the first nine months of 2026. Flutter only gives an advertising-only number for the whole group: $2,053 million in 2025 across all brands worldwide, so that figure should not be labeled FanDuel.
What is DraftKings' marketing budget?
DraftKings does not publish a forward budget, but its 2025 Form 10-K reports $1,379.9 million of sales and marketing expense, 22.8% of its $6,054.5 million revenue. Advertising costs, which include league and team sponsorships, were $1,124.8 million. Spending is higher in 2026: $1,329.9 million in the nine months to September 30, up 41.9%.
How much does the CEO of FanDuel make a year?
Amy Howe, FanDuel's CEO until May 6, 2026, received total 2025 compensation of $8,979,757 per Flutter's 2026 proxy, including a $1,059,898 salary and $6,967,517 in stock awards. She left with severance of $4,370,828. FanDuel President Christian Genetski now leads the business, and his pay has not yet been disclosed in a proxy statement.
What company has the highest marketing budget?
Among U.S. sportsbooks, DraftKings reports the largest single-company figure: $1,379.9 million of sales and marketing in 2025. Flutter spends more worldwide, $3,678 million across all brands, but its U.S. arm FanDuel spent $1,319 million. Across all industries, Amazon is far larger, with $23.5 billion of advertising and promotional costs in 2025.
How much do sports betting companies spend on advertising in total?
No regulator publishes an audited industry total. From filings, DraftKings and FanDuel's U.S. segment together reported about $2.7 billion of sales and marketing in 2025, and PENN's Interactive segment added $310.4 million of media and advertising. BetMGM, Caesars Sportsbook and Fanatics do not disclose comparable figures, so the true total is higher.
Are sportsbook sign-up bonuses counted as marketing spend?
No. DraftKings and Flutter book promotions such as deposit bonuses and bonus bets as a reduction of revenue, not as sales and marketing expense. Neither company discloses the dollar amount. That means the reported marketing line understates the full cost of acquiring and keeping a customer.
What big companies spend on marketing