

US native advertising spending is forecast to reach $147.98 billion in 2026, up 13.1%, according to EMARKETER’s December 2025 forecast. That is the only current, published US figure labeled “native.” The IAB/PwC Internet Advertising Revenue Report, the other number everyone quotes, does not break out native at all: it folds native into display ($74.3 billion in 2024, $81.6 billion in 2025) and counts in-feed social ads inside social media ($88.8 billion in 2024, $117.7 billion in 2025).
Below: every native spend figure with what it actually counts, the exact IAB 2024 and 2025 numbers with page references, Taboola and Teads (formerly Outbrain) revenue from their 10-K filings, the FTC disclosure rules for sponsored content, and engagement benchmarks labeled by who produced them.
Native advertising spending: every published figure and what it counts
The numbers below disagree because each publisher defines “native” differently. EMARKETER defines native as “digital ads that match the visual design of a specific user experience,” which includes “ads in social media feeds, content recommendation widgets, custom ads and sponsored content” (EMARKETER, March 13, 2019). So almost every Facebook, Instagram and LinkedIn feed ad counts as native in its model.
| Figure | Value | Year | Publisher | What it counts |
|---|---|---|---|---|
| US native display ad spending | $147.98B (+13.1%) | 2026 forecast | EMARKETER, Dec 2025 forecast (article Jan 15, 2026) | US, social feeds included |
| US native display ad spending, implied | about $130.8B | 2025 | Our arithmetic: $147.98B ÷ 1.131 | Derived, not an EMARKETER-published number |
| US native display ad spending | $43.90B (62.7% of display) | 2019 forecast | EMARKETER, Mar 2019 | US, social feeds included |
| US native display ad spending | $22.09B (+36.2%, 52.9% of display) | 2017 forecast | EMARKETER’s first native forecast, as reported by Global Dating Insights, Apr 14, 2017 | US, social feeds included |
| Global native advertising market | $105.9B (2024), $122.09B (2025), $141.1B (2026), $346.9B (2033) | 2024 to 2033 | Grand View Research | Global market-sizing model, 13.9% CAGR 2025 to 2033 |
| US display ad revenue (includes native) | $74.3B (2024), $81.6B (2025) | Actuals | IAB/PwC | Banner, rich media, sponsorship and native combined |
| US social media ad revenue | $88.8B (2024), $117.7B (2025) | Actuals | IAB/PwC | All ads on social platforms, any format |
One check tells you how far apart the definitions are: Grand View’s global native market for 2026 ($141.1 billion) is smaller than EMARKETER’s US-only native forecast for the same year ($147.98 billion). Both cannot be measuring the same thing. Never put them in the same sentence as if they were comparable, and always say “US native display, social included” when you quote the EMARKETER number.
IAB 2024 figures: $258.6 billion total, $102.9 billion search, $88.8 billion social
If you searched for “102.9” and “88.7,” you are probably checking IAB’s full-year 2024 numbers. Here they are, read from the IAB/PwC Internet Advertising Revenue Report: Full Year 2024 (PDF) and the IAB release, next to the full-year 2025 figures from IAB’s April 16, 2026 release.
| IAB category | FY 2024 | 2024 growth | 2024 share | FY 2025 | 2025 growth | 2025 share |
|---|---|---|---|---|---|---|
| Total US internet advertising | $258.6B | +14.9% | 100% | $294.6B | +13.9% | 100% |
| Search | $102.9B | +15.9% | 39.8% | $114.2B | +11.0% | 38.8% |
| Display (banner, rich media, sponsorship, native) | $74.3B | +12.4% | 28.7% | $81.6B | +9.8% | 27.7% |
| Digital video (incl. CTV) | $62.1B | +19.2% | 24.0% | $78.0B | +25.4% | 26.5% |
| Podcast | $2.43B | +26.4% | 0.9% | $2.9B | +17.6% | 1% |
| Overlapping cut: social media | $88.8B | +36.7% | 34.3% | $117.7B | +32.6% | 40.0% |
| Overlapping cut: retail media (2024) / commerce media (2025) | $53.7B | +23.0% | 20.8% | $63.4B | +18.0% | 21.5% |
| Overlapping cut: programmatic | $134.8B | +18.0% | n/a | $162.4B | +20.5% | n/a |
Where each 2024 number sits in the PDF (viewer page numbers): the $258.6 billion total and the format highlights are on pages 5 and 6, the social media highlight on page 7, the format breakdown with search at $102.9 billion and video at $62.1 billion on page 16, the five-year revenue chart by format on page 17, and the social media section on page 21. The FY 2025 full report sits behind a free account on the IAB report page.
Why you keep seeing $88.7 billion for social in 2024
IAB reports 2024 social media ad revenue as $88.8 billion, up $23.8 billion or 36.7%. The $88.7 billion figure comes from adding IAB’s own half-year bars on page 21: $40.5 billion in the first half plus $48.2 billion in the second half equals $88.7 billion. IAB prints a note under that chart that “individual values may not sum to total due to rounding.” Cite $88.8 billion.
A second trap on page 17: search revenue in 2023 was also $88.8 billion. If you see “$88.8 billion” next to search, it is the 2023 search figure, not 2024 social.
How native, social and feed ads fit inside the IAB report
- Native is inside display. Footnote 18 on page 16 says “Display includes Banner, Rich Media, Sponsorship and Native revenues.” IAB does not publish the native slice of that $74.3 billion.
- Social is a cut, not a format. IAB defines social media ads as “ads that reach targeted audiences through social media platforms, messaging apps, and social media news feeds” (page 27). A Reels video ad counts in video and in social; a feed image ad counts in display and in social.
- Formats add up; cuts do not. Search, display, video, audio and other sum to the total. Social, commerce media and programmatic overlap with them, which is why the 2025 shares of 40.0% social plus 38.8% search plus 27.7% display exceed 100%.
The practical answer: if someone asks for “IAB native ad revenue,” there is no such line. The closest proxies are display (includes native, but also banners) and social (mostly native in format, per EMARKETER’s split below). Our contextual advertising statistics page walks through the same IAB tables from the targeting side, with the format rows reconciled to the total.
Native’s share of display: social feeds versus the open web
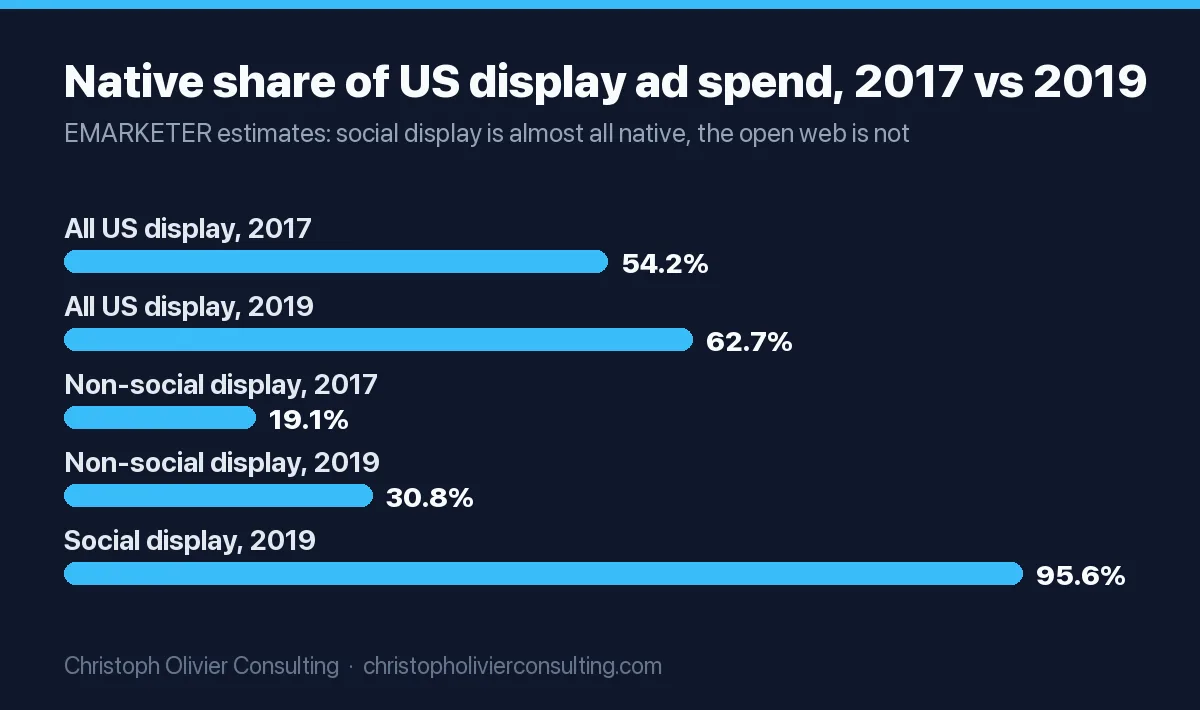
Native is close to universal on social platforms and a minority format everywhere else. EMARKETER’s last openly published split (Ross Benes, EMARKETER, March 13, 2019) put native at 95.6% of US social display spend in 2019, but only 30.8% of non-social display spend, up from 19.1% in 2017. Overall, native was 62.7% of US display in 2019, up from 54.2% in 2017. EMARKETER also wrote that “outside of social networks, more than two-thirds of display spend will not be native.”
Native advertising statistics from 2017
EMARKETER’s first native forecast, published in March 2017, put US native display spending at $22.09 billion for 2017, up 36.2%, and 52.9% of all US display spend. Social networks were expected to take 84.2% of native display spend, or $18.59 billion, and EMARKETER projected about $28 billion for 2018 (as reported April 14, 2017). EMARKETER later revised native’s 2017 share of display to 54.2%. If you see “$22.09 billion, 54.2%” together, that combines two different EMARKETER vintages.
Open-web native: Taboola and Teads (Outbrain) revenue from their 10-K filings
Off the social platforms, native mostly means content-recommendation widgets (“around the web” modules under articles) and in-article units. Two public companies dominate that business, and their annual reports are the most reliable open-web native numbers you can cite.
The Outbrain and Teads merger is done: Outbrain completed its acquisition of Teads on February 3, 2025 for consideration of “approximately $900 million,” made up of $625 million in cash and 43.75 million shares, changed its corporate name to Teads Holding Co. on June 6, 2025, and began trading as TEAD on Nasdaq on June 10, 2025 (Teads Holding Co. 10-K for 2025). Reports of a “$1 billion” deal overstate the consideration in the filing.
| FY 2025 (year to Dec 31) | Taboola 10-K | Teads Holding Co. 10-K |
|---|---|---|
| Revenue | $1,912.0M | $1,300.5M |
| Prior year revenue | $1,766.2M | $889.9M (Outbrain alone, before the deal) |
| Reported growth | +8.3% | +46.1% (Legacy Teads included from Feb 3, 2025) |
| Pro forma, as if combined from Jan 1, 2024 | n/a | $1,330.9M in 2025 vs $1,507.2M in 2024, a decline of about 11.7% (our arithmetic) |
| Traffic acquisition cost (paid to publishers and media partners) | $1,214.9M, 63.5% of revenue | $770.8M, 59.3% of revenue |
| Ex-TAC gross profit (non-GAAP) | $713.5M | $529.7M |
| Net income (loss) | $42.3M | ($517.1M), incl. $367.7M non-cash impairments |
| Reach and supply | 600M+ daily active users; about 14,000 digital property partners | About 10,000 media owners in 30+ countries |
| Concentration | Yahoo and Microsoft: about 34% of gross revenue from advertisers on digital properties; top five: about 44% | 93% of revenue bought directly by advertisers; about 50 joint business plans averaging $4M a year |
Three things to take from the filings:
- Most of your open-web native budget goes to publishers. Taboola’s traffic acquisition cost was 63.5% of revenue ($1,214.9M ÷ $1,912.0M), so roughly 64 cents of each advertiser dollar is paid out to the site that shows the ad. Teads paid out 59.3%.
- Neither company is “pure native” anymore. Taboola’s Realize platform runs “across various ad formats and placements,” and Teads calls itself an “omnichannel advertising platform” spanning CTV, video, high-impact display and native. Their revenue is an upper bound on open-web recommendation spend, not a native-only number.
- Open-web native is small next to social. Taboola plus Teads revenue was about $3.2 billion in 2025 ($1,912.0M + $1,300.5M), against $117.7 billion of US social ad revenue in IAB’s count. The comparison mixes global company revenue with US market spend, so read it as order of magnitude only.
Native ad CTR and engagement benchmarks (vendor data, labeled)
There is no audited, cross-platform native CTR benchmark. We found no first-party CTR benchmark published by Taboola or Teads, and the “0.1% to 0.6%” ranges on affiliate blogs do not trace to a dataset. What exists is vendor research and vendor-compiled ad account data. Use it as a starting point, labeled as such.
| Metric | Value | Source and type | Caveat |
|---|---|---|---|
| Visual attention, native vs banner | Native looked at 53% more often | Sharethrough/IPG Media Lab: vendor co-run, 4,770 surveyed, 200 eye-tracked | Study first covered in August 2013 (that write-up says 52%); Sharethrough’s summary is dated April 20, 2015 |
| In-feed placement attention | 25% more consumers looked at in-feed native than at display units | Same study | Same |
| Purchase intent and brand affinity lift | +18% purchase intent, +9% brand affinity vs banner | Same study | EMARKETER’s 2026 FAQ attributes these to the Native Advertising Institute; the originating study is Sharethrough/IPG |
| Would share the ad | 32% native vs 19% display | Same study | Stated intent, not measured shares |
| Facebook feed ads, traffic campaigns | CTR 1.93% (prior year 1.71%), CPC $0.60 | LocaliQ/WordStream: vendor client data, page updated Sept 23, 2026 | No sample size or data period stated on the page |
| Facebook feed ads, leads campaigns | CTR 2.70%, conversion rate 8.54%, cost per lead $27.39 | Same | Same |
| Facebook traffic CTR, professional services | Attorneys and legal 1.77%, business services 1.64%, finance and insurance 1.46% (lowest of 20 industries) | Same | Same |
| “Strong” native CTR | Above 0.4% | EMARKETER FAQ, Jan 2026 | Rule of thumb; no dataset cited |
If you sell a professional service, the finance and insurance row matters most: the lowest feed CTR of the 20 industries LocaliQ tracks. In my view, that is a better planning baseline for an accounting or advisory firm than a cross-industry average. Our paid social media advertising guide covers how to set those campaigns up.
Sponsored content disclosure rules: what the FTC requires
The FTC announced its Enforcement Policy Statement on Deceptively Formatted Advertisements on December 22, 2015, and published it in the Federal Register on April 18, 2016 (81 FR 22596). Alongside it came Native Advertising: A Guide for Businesses (December 2015). Both still frame how the FTC reviews native ads, and the case record behind them is tallied in our FTC advertising enforcement statistics.
The legal standard, quoted from the statement:
- The Commission “will find an advertisement deceptive if the ad misleads reasonable consumers as to its nature or source.”
- Misleadingly formatted ads “are deceptive even if the product claims communicated are truthful and non-misleading.”
- The FTC applies the “misleading door opener” principle: “when the first contact between the seller and a buyer occurs through a deceptive practice, the law may be violated, even if the truth is subsequently made known to the purchaser.” A disclosure only on the landing page does not cure a deceptive headline in the feed.
- The statement cites a court holding that an “advertorial” label “simply does not convey to the reader that the articles… were indeed purchased.”
Native ad disclosure checklist (pass/fail, from the FTC business guide)
| Check | Pass | Fail |
|---|---|---|
| Label wording | “Ad,” “Advertisement,” “Paid Advertisement,” “Sponsored Advertising Content” | “Promoted,” “Promoted Stories” (the guide calls these at best ambiguous); “Presented by [brand]” when the brand created the content; a logo alone |
| Label position | Immediately in front of or above the headline | Below the ad (the guide says this “increases the risk that consumers will click”) |
| Image-led units | Disclosure placed on the thumbnail itself | Disclosure only in surrounding text |
| Grouped units (recommendation widgets) | Each ad labeled individually | One “sponsored” header over a mix of ads and editorial links |
| Click-through page | Disclosure “as close as possible to the headline” on the article page too, since readers can arrive from search or shares | Article page with no label because the feed unit had one |
| Search and sharing | Disclosure at the beginning of the title tag; disclosure at the beginning of shared URLs | Page title that reads like editorial in search results |
| Video and audio | Disclosure before the advertising message, on screen long enough to read | Disclosure at the end of the video |
| Prominence | Large and visible enough to notice readily | Small gray text or background shading alone |
Which native advertising statistic to cite
Use this table to pick the right number for the claim you are making, with a citation line you can paste.
| If you need to say | Use | Cite as | Do not use |
|---|---|---|---|
| How much the US spends on native ads | $147.98B in 2026, +13.1% | EMARKETER forecast, December 2025 (US native display, social included) | IAB display ($81.6B): it includes banners and excludes video |
| How big native is worldwide | $105.9B in 2024, $346.9B by 2033 | Grand View Research market report | Next to the EMARKETER US figure, as if comparable |
| Total US digital ad revenue in 2024 | $258.6B, +14.9% | IAB/PwC Internet Advertising Revenue Report: Full Year 2024, April 2025 | Forecast numbers from other firms |
| US social ad revenue in 2024 | $88.8B, +36.7% | IAB/PwC Full Year 2024, page 21 | $88.7B (sum of rounded half-year bars) |
| US search ad revenue in 2024 | $102.9B, 39.8% share | IAB/PwC Full Year 2024, page 16 | $88.8B (that is 2023 search) |
| Native’s share of social vs open web | 95.6% of social display, 30.8% of non-social (2019) | EMARKETER, March 2019 | Presented as a current-year figure |
| Open-web native platform size | Taboola $1,912.0M; Teads $1,300.5M (FY 2025) | Each company’s 10-K for fiscal 2025 | Teads pro forma and reported revenue mixed in one sentence |
| Native gets more attention than banners | 53% more looks; +18% purchase intent | Sharethrough/IPG Media Lab (vendor co-run, first reported 2013) | Presented as new research |
The same IAB totals are set against Gartner and CMO Survey budget data on our CMO and marketing budget statistics page, and the wider spend picture is in our US digital ad spend statistics. If you are deciding whether open-web native, social feeds or search should get the next dollar of your budget, you can book a consultation to work through it with your own numbers.
Frequently asked questions
What are the latest native advertising stats for US spending?
EMARKETER forecasts US native display ad spending at $147.98 billion in 2026, up 13.1%, per its December 2025 forecast. That figure includes in-feed ads on social platforms. Dividing by 1.131 implies about $130.8 billion for 2025, which is our arithmetic, not an EMARKETER number. IAB/PwC does not publish a native line.
How much is spent on native advertising worldwide?
Grand View Research values the global native advertising market at $105.9 billion in 2024 and $122.09 billion in 2025, and projects $346.9 billion by 2033, a 13.9% CAGR from 2025 to 2033. Its 2026 global figure of $141.1 billion is below EMARKETER's US-only 2026 forecast, so the two use different definitions and should not be compared.
Does the IAB report break out native advertising revenue?
No. The IAB/PwC Full Year 2024 report says display "includes Banner, Rich Media, Sponsorship and Native revenues" (footnote 18, page 16), so native sits inside display: $74.3 billion in 2024 and $81.6 billion in 2025. In-feed social ads also appear in the social media cut, $88.8 billion in 2024 and $117.7 billion in 2025.
Is IAB 2024 social ad revenue $88.7 billion or $88.8 billion?
$88.8 billion, up 36.7%, per the IAB/PwC Full Year 2024 report and IAB's April 2025 release. The $88.7 billion figure comes from adding the report's rounded half-year bars on page 21 ($40.5 billion plus $48.2 billion). IAB notes that individual values may not sum to the total because of rounding.
What were the IAB 2024 figures for search, digital video and total internet advertising?
Total US internet ad revenue was $258.6 billion in 2024, up 14.9%. Search was $102.9 billion (39.8% share, up 15.9%), digital video $62.1 billion (24.0% share, up 19.2%) and display $74.3 billion (28.7%, up 12.4%), per the IAB/PwC Internet Advertising Revenue Report: Full Year 2024.
How much revenue do Taboola and Outbrain make?
Taboola reported $1,912.0 million of revenue for 2025, up 8.3%, in its 10-K. Outbrain bought Teads on February 3, 2025 for about $900 million and renamed itself Teads Holding Co.; it reported $1,300.5 million for 2025. Pro forma, as if combined all of 2024, revenue fell from $1,507.2 million to $1,330.9 million.
What are the FTC rules for native ads and sponsored content?
The FTC's December 2015 Enforcement Policy Statement on Deceptively Formatted Advertisements treats an ad as deceptive if it misleads reasonable consumers about its nature or source, even when the product claims are true. Its business guide recommends labels like "Ad" or "Sponsored Advertising Content" placed in front of or above the headline, and warns that "Promoted" is ambiguous.