

oesm24nat.zip is the Bureau of Labor Statistics (BLS) file of national Occupational Employment and Wage Statistics (OEWS) for May 2024. It has been replaced by oesm25nat.zip, the May 2025 national file, which BLS lists first on its OEWS tables page. Both stay downloadable at https://www.bls.gov/oes/special-requests/. This page gives you the exact links, what is inside each zip, the SOC codes that cover advertising work, the May 2025 numbers already pulled out, and the Census and industry data you usually need next.
oesm24nat.zip and oesm25nat.zip: links, contents and status
BLS keeps every year’s national file on the same path, with the year in the file name. The table shows what we found when we downloaded and opened both files on November 1, 2026.
| File | Reference period | Direct URL | What is inside | Status |
|---|---|---|---|---|
| oesm25nat.zip | May 2025 | bls.gov/oes/special-requests/oesm25nat.zip | One Excel file, national_M2025_dl.xlsx: 1,401 data rows (830 detailed occupations), 32 columns | Current |
| oesm24nat.zip | May 2024 | bls.gov/oes/special-requests/oesm24nat.zip | One Excel file, national_M2024_dl.xlsx: 1,402 data rows (831 detailed occupations), 32 columns | Superseded, still listed |
| oesm25st.zip | May 2025 | oesm25st.zip | State estimates | Current |
| oesm25ma.zip | May 2025 | oesm25ma.zip | Metro and nonmetro area estimates | Current |
| oesm25in4.zip | May 2025 | oesm25in4.zip | National estimates by industry (sector, 3-, 4-, 5- and 6-digit NAICS), about 31 MB | Current |
| oesm25all.zip | May 2025 | oesm25all.zip | Every geography and industry in one file, about 79 MB | Current |
The OEWS tables page was last modified May 15, 2026, and the oldest Internet Archive copy of oesm25nat.zip is dated May 16, 2026. Each zip opens to a folder with the data sheet plus a “Field Descriptions” sheet.
Why an old oesm link breaks
- Dot instead of hyphen. Older links and scripts used
/oes/special.requests/with a dot. The Internet Archive shows files served from that dotted path from 2020 to 2021, for exampleoesm18nat.zip. Current links usespecial-requestswith a hyphen. Ifhttps://www.bls.gov/oes/special.requests/oesm24nat.zipfails, change the dot to a hyphen. - Scripted downloads get a 403. When we ran a scripted request for oesm25nat.zip on November 1, 2026, bls.gov returned HTTP 403 (forbidden). Downloading in a normal browser is the reliable route. If you must script it, the Internet Archive keeps dated copies of each file, like the one linked above.
- Wrong year. “oesm24” means May 2024 data. If you want the latest wages, you want oesm25nat.zip.
BLS OEWS data files for advertising jobs
Advertising work is spread across five SOC (Standard Occupational Classification) codes. Filter the OCC_CODE column for these and you have the core of US advertising employment and pay. All figures below come straight from national_M2025_dl.xlsx (May 2025) and national_M2024_dl.xlsx (May 2024), all industries, wage and salary workers only.
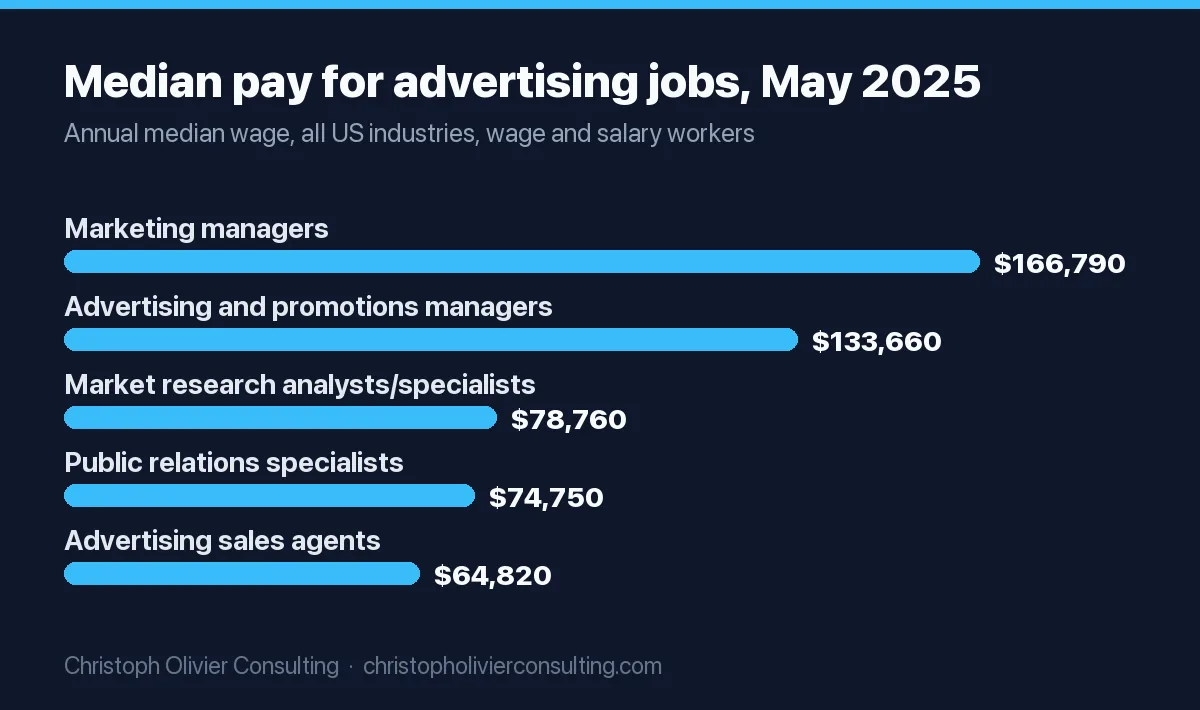
| SOC code | Occupation | Employment, May 2025 | Median annual wage, May 2025 | Mean annual wage, May 2025 | Median, May 2024 | Median change |
|---|---|---|---|---|---|---|
| 11-2011 | Advertising and Promotions Managers | 21,470 | $133,660 | $154,280 | $126,960 | +5.3% |
| 11-2021 | Marketing Managers | 395,240 | $166,790 | $177,770 | $161,030 | +3.6% |
| 13-1161 | Market Research Analysts and Marketing Specialists | 899,580 | $78,760 | $89,490 | $76,950 | +2.4% |
| 41-3011 | Advertising Sales Agents | 91,700 | $64,820 | $80,670 | $61,460 | +5.5% |
| 27-3031 | Public Relations Specialists | 283,380 | $74,750 | $84,120 | $69,780 | +7.1% |
| 00-0000 | All occupations (benchmark) | 155,495,730 | $50,980 | $69,770 | $49,500 | +3.0% |
Source: BLS OEWS May 2025 national file and May 2024 national file. Median change is our arithmetic. These are two separate survey estimates, so small moves can be noise: the EMP_PRSE column puts the relative standard error of the advertising and promotions manager employment count at 3.9%, versus 0.8% for marketing managers.
Three things stand out. Advertising and promotions managers are a small, well-paid group: 21,470 jobs at a $133,660 median, or $64.26 an hour. Marketing managers outnumber them about 18 to 1. And advertising sales agents are the only one of the five that lost jobs between the two files, falling from 97,470 to 91,700. Our advertising manager job guide breaks the $133,660 figure down by percentile and metro using the same May 2025 files.
Columns you need in national_M2025_dl.xlsx
OCC_CODEandOCC_TITLE: the SOC code and name.O_GROUP: keep “detailed” rows. Some occupations appear twice (as “broad” and “detailed”), so filtering prevents double counting.TOT_EMP: employment rounded to the nearest 10, excluding the self-employed.A_MEDIAN,A_MEAN,A_PCT10toA_PCT90: annual wages.H_MEDIANand the otherH_columns are hourly.- Symbols:
*means a wage is not available,**means employment is not available, and#means the wage is at or above $115.00 an hour or $239,200 a year (top-coded). Replace these before you do math.
Pull the advertising rows in five lines of Python
import pandas as pd
df = pd.read_excel("oesm25nat/national_M2025_dl.xlsx")  # needs openpyxl installed
codes = ["11-2011", "11-2021", "13-1161", "41-3011", "27-3031"]
ad = df[df["OCC_CODE"].isin(codes) & (df["O_GROUP"] == "detailed")]
print(ad[["OCC_CODE", "OCC_TITLE", "TOT_EMP", "A_MEDIAN", "A_MEAN"]])
Swap oesm25nat for oesm24nat and M2025 for M2024 to run the same filter on the older file. In Excel, the equivalent is an AutoFilter on OCC_CODE with those five values checked.
Who actually works inside ad agencies (NAICS 541800, May 2025)
The national file covers every employer. To see the staff of agencies themselves, open nat4d_M2025_dl.xlsx inside oesm25in4.zip and filter NAICS for 541800 (Advertising, Public Relations, and Related Services). OEWS counts 481,600 jobs in the industry in May 2025, with a mean wage of $92,910 and a median of $73,830. In May 2024 the same table showed 490,930 jobs.
| Occupation (SOC) | Jobs in NAICS 5418 | Share of industry jobs | Median wage in the industry | Share of all US jobs in this occupation |
|---|---|---|---|---|
| Advertising Sales Agents (41-3011) | 43,870 | 9.11% | $72,910 | 48% |
| Market Research Analysts and Marketing Specialists (13-1161) | 41,070 | 8.53% | $76,660 | 4.6% |
| Public Relations Specialists (27-3031) | 37,610 | 7.81% | $77,480 | 13% |
| General and Operations Managers (11-1021) | 25,680 | 5.33% | $127,760 | n/a |
| Graphic Designers (27-1024) | 19,600 | 4.07% | $61,200 | n/a |
| Art Directors (27-1011) | 16,040 | 3.33% | $121,490 | n/a |
| Marketing Managers (11-2021) | 14,450 | 3.00% | $168,420 | 3.7% |
| Advertising and Promotions Managers (11-2011) | 8,940 | 1.86% | $133,550 | 42% |
Source: BLS OEWS May 2025, national industry-specific file, NAICS 541800. The last column is our division of the industry count by the all-industry count in the national file.
The practical reading: 58% of advertising and promotions managers and 95% of market research analysts and marketing specialists work outside agencies, in brands, retailers, publishers and other employers. If you benchmark an in-house hire, use the national row. If you benchmark agency staff, use the 541800 row. The 13-1161 median of $78,760 is the one our PPC management cost guide uses to compare an in-house specialist against agency fees.
Advertising job outlook, 2025 to 2035
BLS released new Employment Projections for 2025 to 2035 on August 27, 2026 (USDL-26-1422). Total US employment is projected to grow 3.5%. The table below comes from BLS Table 1.2. Unlike OEWS, these job counts include the self-employed, so they run higher.
| Occupation (SOC) | Jobs 2025 (thousands) | Jobs 2035 (thousands) | Change 2025-35 | Openings per year (thousands) | Self-employed, 2025 |
|---|---|---|---|---|---|
| Market research analysts and marketing specialists (13-1161) | 952.7 | 1,019.0 | +7.0% | 82.0 | 3.8% |
| Marketing managers (11-2021) | 421.6 | 450.8 | +6.9% | 34.0 | 5.3% |
| Public relations specialists (27-3031) | 314.5 | 320.2 | +1.8% | 23.0 | 1.1% |
| Advertising and promotions managers (11-2011) | 33.2 | 31.9 | -3.7% | 2.3 | 35.1% |
| Advertising sales agents (41-3011) | 99.3 | 92.2 | -7.2% | 7.8 | 7.7% |
| All occupations | 170,280.8 | 176,198.5 | +3.5% | 17,461.8 | 5.8% |
Note the 35.1% self-employed share for advertising and promotions managers. It explains why BLS projections count 33,200 of them while OEWS, which excludes the self-employed, counts 21,470. The 2024 to 2034 projections the old version of this page quoted are now superseded.
US advertising industry size: every official count for NAICS 5418
Five federal programs measure the advertising, public relations and related services industry (NAICS 5418). They count different things, so the totals do not match. Use the one that fits your question and cite it with its year.
| Program and year | Establishments or firms | Employment | Payroll or wages | Revenue | Method |
|---|---|---|---|---|---|
| BLS QCEW, 2025 annual average | 79,336 establishments | 478,109 (down 2.3% from 2024) | $53.03 billion; average pay $110,916 (up 3.4%) | Not measured | Unemployment-insurance tax records, private ownership, a near-complete count of covered jobs |
| Census AIES, 2024 (released September 2026) | Not in this table | 474,764 | $44.56 billion | $149.87 billion; operating expenses $102.47 billion | Annual Integrated Economic Survey, employer establishments, sample based |
| Census County Business Patterns, 2023 | 38,864 establishments | 465,231 (mid-March) | $43.35 billion | Not measured | Business Register, establishments with paid employees |
| Census Economic Census, 2022 | 34,694 firms; 38,542 establishments | 527,028 | $42.74 billion | $134.76 billion | Five-year census of employer establishments |
| Census Nonemployer Statistics, 2024 | 221,163 nonemployer businesses | None (no paid staff) | None | $13.72 billion receipts | IRS tax records for businesses with no employees |
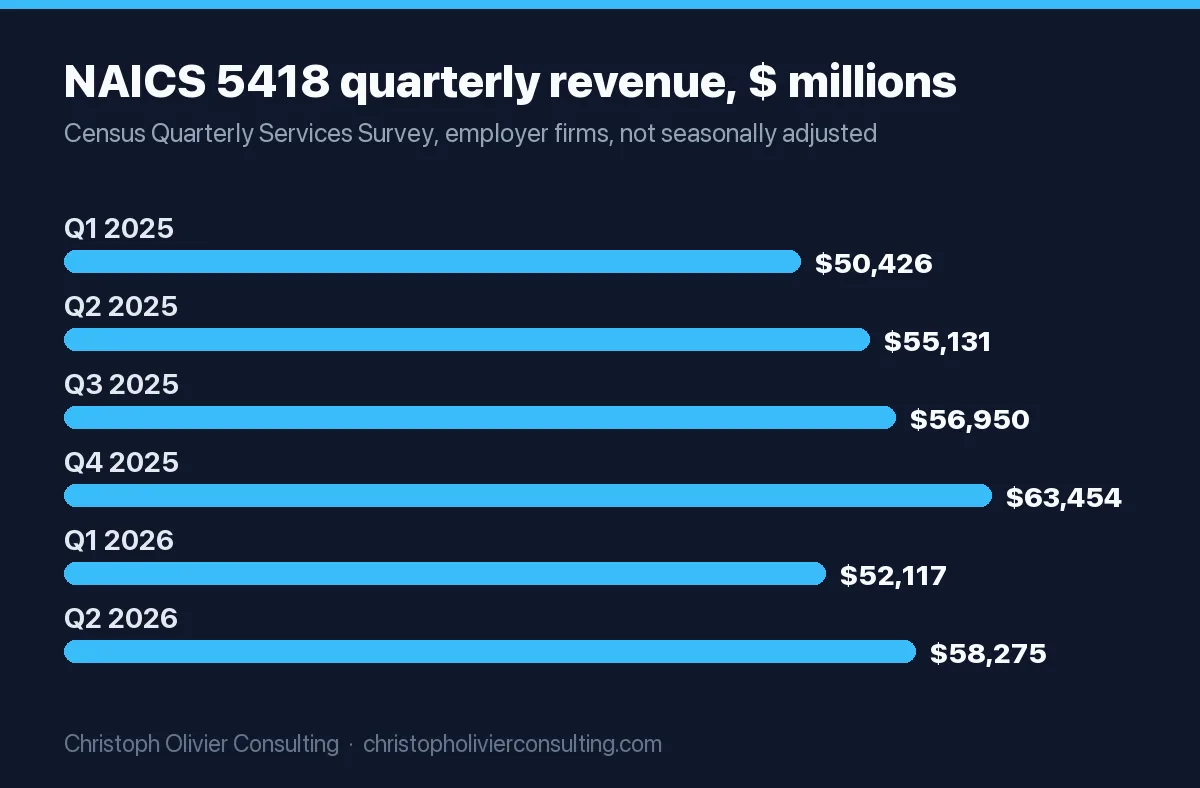
| Census Quarterly Services Survey, Q2 2026 | Not published | Not published | Not published | $58,983 million in Q2 2026, seasonally adjusted; 2025 quarters sum to $225,961 million | Quarterly sample of employer firms (Release CB26-146, September 9, 2026) |
Why the counts disagree
- Establishments: 79,336 or 38,864? QCEW counts every reporting unit on state unemployment-insurance files. County Business Patterns counts establishments on the Census Business Register. The frames differ and Census does not publish a reconciliation, so pick one and stay with it. Use QCEW for the newest year (2025). Use CBP when you need size classes or county detail.
- Revenue: $150 billion or $226 billion? AIES and the Economic Census tabulate establishments. The Quarterly Services Survey estimates revenue for employer firms. The two series are built differently, so do not add or compare them. For an annual industry size, quote AIES 2024 ($149.87 billion). For the latest trend, quote QSS.
- Solo operators. None of the employer counts include the 221,163 nonemployer businesses in NAICS 5418, which averaged about $62,000 in receipts each in 2024 (our division of Census totals).
Industry structure by segment
| NAICS | Segment | Establishments, 2025 (QCEW) | Employment, 2025 (QCEW) | Average annual pay, 2025 (QCEW) | Revenue, 2024 (AIES) |
|---|---|---|---|---|---|
| 54181 | Advertising agencies | 39,155 | 207,990 | $132,313 | $69.40B |
| 54182 | Public relations agencies | 15,212 | 62,537 | $147,787 | $18.57B |
| 54183 | Media buying agencies | 1,582 | 17,666 | $137,346 | $10.76B |
| 54184 | Media representatives | 3,573 | 16,531 | $129,394 | $7.27B |
| 54185 | Indoor and outdoor display advertising | 2,972 | 30,221 | $87,720 | $9.52B |
| 54186 | Direct mail advertising | 2,500 | 30,852 | $81,148 | $9.13B |
| 54187 | Advertising material distribution | 3,868 | 17,316 | $77,652 | $2.55B |
| 54189 | Other services related to advertising | 10,473 | 94,995 | $54,774 | $22.66B |
| 5418 | Total | 79,336 | 478,109 | $110,916 | $149.87B |
Sources: BLS QCEW 2025 annual averages (private ownership, one CSV per NAICS code) and Census AIES 2024. QCEW segment rows do not sum exactly to the 5418 total.
Ratios worth knowing, all our arithmetic from the Census files above:
- Revenue per employee: $315,700 for the industry in 2024 (AIES). Media buying agencies run the highest at about $494,400, advertising agencies about $337,800, PR agencies about $280,800.
- Payroll as a share of revenue: 29.7% for the industry (2024 AIES payroll of $44.56 billion against $149.87 billion revenue).
- Small shops dominate: 26,709 of 38,864 establishments (68.7%) had fewer than five employees in CBP 2023. Only 20 had 1,000 or more.
- Revenue growth: AIES 2024 revenue ($149.87 billion) is 11.2% above the 2022 Economic Census ($134.76 billion). These are different surveys, so treat the gap as directional, not as a measured growth rate.
Quarterly revenue, latest release
The Census Quarterly Services Survey released September 9, 2026 shows NAICS 5418 revenue of $58,983 million in Q2 2026, seasonally adjusted. That is up 5.1% from Q1 2026 ($56,100 million, revised) and 5.7% from Q2 2025. Not seasonally adjusted, first-half 2026 revenue was $110,392 million, 4.6% above first-half 2025. The next release is scheduled for November 19, 2026.
US ad spend totals: what IAB/PwC and WPP Media report
Ad spend is a different measure from agency revenue. It is the money advertisers pay media sellers, much of which never touches an agency’s books. These are the named, dated totals you can cite.
| Statistic | Value | Source and date | Method |
|---|---|---|---|
| US internet advertising revenue, 2025 | $294.6 billion, up 13.9% | IAB/PwC Internet Advertising Revenue Report, Full Year 2025, April 16, 2026 | Revenue reported to PwC by companies selling internet ads plus public filings; PwC does not audit it |
| US internet advertising revenue, 2024 | $258.6 billion, up 14.9% | IAB/PwC Full Year 2024, April 17, 2025 | Same survey |
| Programmatic, 2025 | $162.4 billion, up 20.5% | IAB/PwC, April 16, 2026 | A way of selling, overlaps the format rows |
| Social, 2025 | $117.7 billion, up 32.6% | IAB/PwC, April 16, 2026 | Seller revenue |
| Search, 2025 | $114.2 billion, up 11% | IAB/PwC, April 16, 2026 | Seller revenue |
| Display, 2025 | $81.6 billion, up 9.8% | IAB/PwC, April 16, 2026 | Seller revenue |
| Digital video including CTV, 2025 | $78 billion, up 25.4% | IAB/PwC, April 16, 2026 | Seller revenue |
| Commerce media, 2025 | $63.4 billion, up 18.0% | IAB/PwC, April 16, 2026 | Seller revenue |
| Podcast, 2025 | $2.9 billion, up 17.6% | IAB/PwC, April 16, 2026 | Seller revenue |
| US ad revenue growth forecast, 2026 | 11.9%, raised from WPP Media’s prior estimate | WPP Media This Year Next Year, Midyear 2026, June 16, 2026 | Media-owner revenue forecast; the full forecast is for WPP clients only |
| Global ad revenue, 2025 | $1.14 trillion, up 8.8%; 7.1% growth forecast for 2026 (both excluding US political) | WPP Media This Year Next Year, December 2025, December 10, 2025 | Forecast; superseded by the June 2026 midyear update |
IAB format rows overlap, so they add up to more than the total. Programmatic in particular is a way of buying, not a channel, as our programmatic advertising statistics explain with the full IAB tables. For how search, social and display compare on price, see our guide to internet advertising channels and pricing models. The $78 billion video line includes connected TV, which our connected TV advertising statistics split out. For print and newspaper ad revenue from the Census side, see news media advertising statistics.
Magna and GroupM. GroupM’s website now redirects to WPP Media, which publishes the This Year Next Year forecasts, so the rows above carry the WPP Media name. For Magna, the newest forecast post we could find on magnaglobal.com is dated September 16, 2024, and we could not fetch a newer Magna release from Magna itself. So we do not quote a Magna figure here.
Do not compare ad spend with industry revenue. IAB’s $294.6 billion counts what sellers like Google, Meta and publishers earned from internet ads. The Census $149.87 billion counts what agencies and other NAICS 5418 businesses earned for their services. Most digital ad dollars flow straight from advertisers to platforms without passing through an agency’s revenue line.
Which number to quote: a source picker
Most mistakes with these data come from using the right number for the wrong question. Match your question to the row.
| Your question | Use | File or table | Latest period | Watch out for |
|---|---|---|---|---|
| What does an advertising job pay nationally? | OEWS national | oesm25nat.zip, A_MEDIAN | May 2025 | Excludes the self-employed |
| What does it pay in my state or metro? | OEWS state or metro | oesm25st.zip, oesm25ma.zip | May 2025 | Small cells show ** |
| Which roles do agencies employ? | OEWS industry | oesm25in4.zip, nat4d file, NAICS 541800 | May 2025 | Agency pay differs from in-house pay |
| Will this job grow? | Employment Projections | BLS Table 1.2 | 2025-35 | Counts include the self-employed |
| How many agencies and agency jobs this year? | QCEW | CSV for NAICS 5418 to 54189 | 2025 annual | Reporting units, not firms |
| How big is the industry in dollars? | AIES | AIES00BASIC.zip | 2024 | Employer establishments only |
| Is industry revenue rising right now? | QSS | qss-current.pdf, Tables 1a and 1c | Q2 2026 | Firm based; do not mix with AIES |
| How many agencies are tiny? | County Business Patterns | cbp23us.zip, size-class columns | 2023 | Employment is a mid-March snapshot |
| How many freelancers and solo shops? | Nonemployer Statistics | nonemp24us.zip | 2024 | Receipts only, no jobs or payroll |
| How much do advertisers spend online? | IAB/PwC | Full Year 2025 report | 2025 | Seller-reported, not audited |
| Where is the ad market heading? | WPP Media | This Year Next Year, Midyear 2026 | 2026 forecast | Public page shows headline growth only |
If you are using these numbers to size a marketing hire, an agency retainer or a budget and want a second set of eyes on the assumptions, you can book a consultation.
Frequently asked questions
What is oesm24nat.zip?
oesm24nat.zip is the Bureau of Labor Statistics download of national Occupational Employment and Wage Statistics for May 2024. It holds one Excel workbook, national_M2024_dl.xlsx, with 1,402 rows of employment and wage estimates for every occupation, from the all-occupations total down to 831 detailed SOC codes, plus a sheet that defines the 32 columns.
Where can I download oesm24nat.zip?
The file is at https://www.bls.gov/oes/special-requests/oesm24nat.zip and is still listed on the BLS OEWS tables page. Download it in a normal browser, because scripted requests to bls.gov often get an HTTP 403 error. The Internet Archive also holds dated copies of the file if the BLS server blocks you.
Is there a newer file than oesm24nat.zip?
Yes. oesm25nat.zip holds the May 2025 national estimates and is the current file. It sits on the same path, https://www.bls.gov/oes/special-requests/oesm25nat.zip, and contains national_M2025_dl.xlsx with 1,401 rows and the same 32 columns, so scripts written for the May 2024 file work after you change the year in the file names.
Why does https://www.bls.gov/oes/special.requests/oesm24nat.zip not work?
That link uses special.requests with a dot, a path format from older BLS links. Current OEWS downloads use special-requests with a hyphen. Change the dot to a hyphen and the link resolves to the same file. If it still fails, the likely cause is the 403 block bls.gov applies to many automated downloads.
What is the median salary for advertising and promotions managers in the OEWS data?
In the May 2025 national file, advertising and promotions managers (SOC 11-2011) had a median annual wage of $133,660, or $64.26 an hour, with 21,470 wage and salary jobs. The May 2024 file showed a $126,960 median. Marketing managers (11-2021) earned a $166,790 median in May 2025.
How big is the US advertising industry?
The Census Bureau's Annual Integrated Economic Survey puts 2024 revenue for advertising, public relations and related services (NAICS 5418) at $149.87 billion, with 474,764 employees and $44.56 billion in payroll. BLS QCEW counted 79,336 establishments and 478,109 jobs in 2025. Separately, IAB/PwC put 2025 US internet ad revenue at $294.6 billion.
More original research from CO Consulting
- Small Business Website Speed: A 320-Site Performance Study (2026)
- Consumer Trust in Advertising and Marketing Statistics for 2026
- The AI Search Readiness Study 2026: 15 Data Points on How Small-Business Websites Score for AI Citation
- Marketing Employment and Salary Statistics 2026: 45 Verified Data Points From the U.S. Bureau of Labor Statistics
- Marketing Cost & CAC Benchmark by Industry 2026: The True Cost Per Acquired Client
- US Digital Advertising Spend: 42 Statistics, Trends, and Data Points for 2026
- CMO and Marketing Budget Statistics 2026: Verified Benchmarks From Gartner and The CMO Survey
- 27 Local SEO and Google Business Profile Statistics and Data Points for 2026
Advertising & ad-tech research
More Marketing Research guides
- Consumer Trust in Advertising and Marketing Statistics for 2026
- FTC Advertising and Endorsement Enforcement: 12 Compliance Statistics for 2026
- Marketing Cost & CAC Benchmark by Industry 2026: The True Cost Per Acquired Client
- Marketing Employment and Salary Statistics 2026: 45 Verified Data Points From the U.S. Bureau of Labor Statistics
- Small Business Website Speed: A 320-Site Performance Study (2026)
- US Digital Advertising Spend: 42 Statistics, Trends, and Data Points for 2026
- All Marketing Research guides →