
A licensed in-home daycare owner caring for six children at the national average price keeps roughly $55,000 to $69,000 a year before income tax in my worked model below, and a 60-child center owner who also works as the director keeps roughly $50,000 to $157,000, depending almost entirely on enrollment. Those are my calculations, built from the Child Care Aware of America 2025 national average price of $13,184 per child, Georgia’s licensing ratios and BLS May 2025 wages. The typical real-world business is smaller: the median U.S. child day care business with no employees took in only $10,000 to $24,999 in 2022, per Census Nonemployer Statistics.
Short answer: A full six-child licensed home daycare can clear about $69,000 before tax (about $23 an hour over 3,000 working hours), but most home providers earn far less because they run fewer children or part of the year. A daycare center with staff averaged $723,100 in revenue per location in 2022 (Census). Margins are thin: Bright Horizons’ center segment earned a 3.2% operating margin in 2025, and Primrose franchise schools averaged 16.3% EBITDA after rent, ranging from 8.2% to 21.6% by occupancy.
No government survey publishes “daycare owner salary” as a line item. Owners are paid from profit, so the honest answer comes from three directions: what the businesses take in (Census), what their staff earn (BLS), and what the few operators who publish financials actually keep (a 10-K and franchise disclosures). Where a number is my calculation, I say so and show the inputs.
How much does a daycare owner make? What each primary source says
| Source and year | What it measures | Figure | How it was calculated |
|---|---|---|---|
| Census SUSB 2022, NAICS 624410 | Revenue per daycare location with paid employees | $723,103 | $57.94 billion receipts ÷ 80,120 establishments (my calculation) |
| Census SUSB 2022, NAICS 624410 | Revenue per employer firm (some run several sites) | $919,268 | $57.94 billion ÷ 63,023 firms (my calculation) |
| Census Nonemployer Statistics 2022, NAICS 6244 | Revenue per child day care business with no employees (mostly in-home) | $19,512 | $10.69 billion ÷ 547,758 businesses (my calculation); 99.3% are sole proprietorships |
| BLS OEWS May 2025, Child Care Services industry | Median pay of an employed daycare director (Education and Childcare Administrators, Preschool and Daycare) | $58,090 | Published; 60,540 employed in the industry; 90th percentile $91,400 |
| BLS OEWS May 2025, Child Care Services industry | Median pay of a childcare worker | $34,170 ($16.43/hr) | Published; preschool teachers in the same industry: $36,850 |
| Bright Horizons 10-K, FY2025 | Revenue of a mature center | $1.8M to $2.8M | Published; gross margins at mature centers “typically average between 20% and 25%” |
Two things jump out. First, the employed director’s median of $58,090 is a useful floor for a center owner: if your center cannot pay you at least what you would earn running someone else’s, it is a job with extra risk attached. Second, employer daycares are only 12.8% of child day care locations but take in 84.4% of the industry’s receipts (my calculation across both Census files). In-home care is a very different business, so I model the two separately.
How much does an in-home daycare owner make?
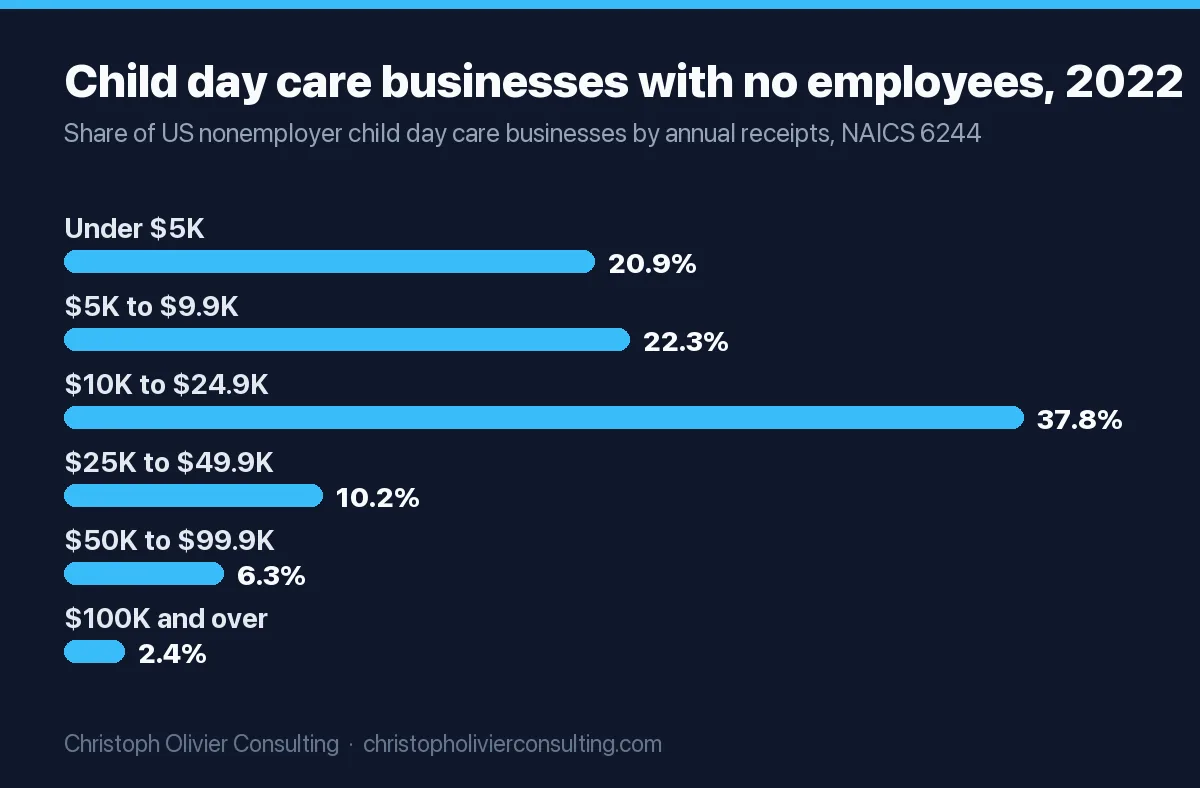
Census counted 547,758 child day care businesses with no paid employees in 2022. Their revenue spread is the reality check every “home daycare income” article skips:
| Annual receipts (2022) | Businesses | Share |
|---|---|---|
| Less than $5,000 | 114,520 | 20.9% |
| $5,000 to $9,999 | 122,360 | 22.3% |
| $10,000 to $24,999 | 207,241 | 37.8% |
| $25,000 to $49,999 | 56,054 | 10.2% |
| $50,000 to $99,999 | 34,395 | 6.3% |
| $100,000 and over | 13,188 | 2.4% |
Source: U.S. Census Bureau, Nonemployer Statistics 2022, NAICS 6244, size classes per the Census record layout. Shares are my calculation. Receipts are revenue, not profit.
Only 8.7% of these businesses took in $50,000 or more. A median between $10,000 and $24,999 tells you most filers are running part time, part of the year, or with one or two children. A full, licensed home that charges market rates sits near the top of this distribution, which is what the worked model shows.
Worked P&L: a licensed six-child family child care home
I used Georgia’s rule because it states the capacity plainly: a Family Child Care Learning Home cares for “at least three but not more than six” unrelated children under 13 for pay (Ga. Comp. R. & Regs. 290-2-3-.03). Your state’s limit may differ. Meal income uses the USDA Child and Adult Care Food Program Tier I day care home rates for July 2026 to June 2027: $1.74 breakfast, $3.31 lunch, $0.98 snack (Federal Register notice 2026-15071).
| Line (annual) | Amount | Assumption |
|---|---|---|
| Tuition, 6 children | $79,104 | 6 × $13,184, the CCAoA 2025 national average price |
| CACFP meal reimbursement | $9,045 | 6 children × ($1.74 + $3.31 + $0.98) × 250 days, Tier I |
| Total revenue | $88,149 | |
| Food | ($9,045) | Assumed equal to the CACFP reimbursement |
| Supplies, toys, curriculum | ($3,000) | Assumption; replace with your own |
| Liability insurance | ($1,500) | Assumption; get a quote |
| License, training hours, background checks | ($500) | Assumption; check your state fee schedule |
| Substitute or assistant coverage | ($3,000) | Assumption: covers sick days and breaks |
| Extra utilities and wear on the home | ($2,400) | Assumption: incremental cost only |
| Net profit before tax | $68,704 | 78% of revenue |
| Self-employment tax | ($9,708) | 15.3% on 92.35% of net earnings, per IRS Topic 554 |
| Owner pay after SE tax, before income tax | $58,996 |
The number that matters is the hourly one. Open 11 hours a day for 250 days, plus about 5 hours a week of cleaning, shopping and paperwork, the owner works about 3,000 hours a year. $68,704 ÷ 3,000 = $22.90 an hour before tax. The BLS May 2025 median for a childcare worker across all industries is $16.82 an hour (OEWS national file). So a full home pays about 36% more per hour than working in someone else’s room, with all the business risk on you.
Enrollment moves this fast, because almost every cost stays fixed:
| Children enrolled | Revenue | Net profit before tax | Per hour (3,000 hrs) |
|---|---|---|---|
| 6 (full) | $88,149 | $68,704 | $22.90 |
| 5 | $73,458 | $55,520 | $18.51 |
| 4 | $58,766 | $42,336 | $14.11 |
At four children the owner earns less per hour than the median employed childcare worker. One open slot costs about $13,200 a year in profit, which is why waitlists, sibling discounts and a steady flow of inquiries matter more than any expense you can trim. My guide to daycare marketing covers how centers and homes keep that inquiry flow full.
How much does a daycare center owner make?
Center revenue is concentrated in a small group of large operators. Census reports employer firms by annual receipts:
| Annual receipts of the firm (2022) | Firms | Share of firms |
|---|---|---|
| Under $100,000 | 12,978 | 20.6% |
| $100,000 to $499,999 | 24,733 | 39.2% |
| $500,000 to $999,999 | 12,395 | 19.7% |
| $1 million to $2.49 million | 9,113 | 14.5% |
| $2.5 million to $4.99 million | 2,048 | 3.2% |
| $5 million and over | 1,756 | 2.8% |
Source: U.S. Census Bureau, SUSB 2022, NAICS 624410. Shares are my calculation.
The median employer daycare firm takes in $100,000 to $499,999 a year, and 59.8% of firms are below $500,000. The average location employs 12.1 people and brings in $59,968 per employee, and payroll alone (before benefits and payroll taxes) equals 47.6% of receipts (my calculations from the same file).
Staffing a 60-child center by Georgia’s ratio rule
Labor sets a center’s profit, and ratios set labor. Georgia’s rule for Child Care Learning Centers requires 1:6 for infants, 1:8 for walking one-year-olds, 1:10 for two-year-olds, 1:15 for three-year-olds and 1:18 for four-year-olds (Ga. Comp. R. & Regs. 591-1-1-.32). Here is the minimum floor staffing for a 60-child mix:
| Age group | Children (my mix) | Georgia ratio | Staff in ratio |
|---|---|---|---|
| Infants under 1 (or non-walking under 18 months) | 8 | 1:6 | 2 |
| Walking one-year-olds | 10 | 1:8 | 2 |
| Two-year-olds | 12 | 1:10 | 2 |
| Three-year-olds | 15 | 1:15 | 1 |
| Four-year-olds | 15 | 1:18 | 1 |
| Total | 60 | 8 at any moment |
Notice the economics: 18 infants and one-year-olds need as many staff (4) as the other 42 children. Infant rooms lose money unless they are priced well above the preschool room, which is why Bright Horizons charges $2,765 a month for infants against $2,175 for preschoolers across a sample of about 350 U.S. centers (10-K, FY2025). For pricing tiers by age, my pricing strategy guide walks through the method.
Worked P&L: a 60-child center (my calculation)
Eight staff in ratio across an 11-hour day, with shifts staggered around the lighter open and close hours, works out to about 10 full-time classroom staff plus a cook or floater. Wages use the BLS May 2025 medians for the Child Care Services industry. Tuition again uses the $13,184 CCAoA average for every child, which blends infant and preschool prices, so a center that prices infants higher will see more revenue than shown.
| Line (annual) | Amount | % of revenue | Assumption |
|---|---|---|---|
| Tuition, 60 children | $791,040 | 100% | 60 × $13,184 (CCAoA 2025) |
| Classroom wages | ($355,100) | 44.9% | 5 FTE at $34,170 (childcare worker median) + 5 FTE at $36,850 (preschool teacher median) |
| Cook or floater | ($34,170) | 4.3% | Childcare worker median |
| Payroll taxes and benefits | ($46,712) | 5.9% | Assumption: 12% of wages |
| Rent | ($120,000) | 15.2% | Assumption: $10,000 a month; Primrose schools averaged 12.3% (below) |
| Food | ($45,000) | 5.7% | Assumption: $3.00 per child per day, 250 days |
| Utilities, cleaning, maintenance | ($36,000) | 4.6% | Assumption |
| Supplies and curriculum | ($15,000) | 1.9% | Assumption |
| Insurance | ($12,000) | 1.5% | Assumption; get a quote |
| Software, marketing, admin | ($15,000) | 1.9% | Assumption |
| Profit before owner pay | $112,058 | 14.2% | What the owner keeps if the owner is the director |
| Hired director instead | ($65,061) | 8.2% | $58,090 BLS industry median + 12% |
| Profit to an absentee owner | $46,997 | 5.9% |
Now move only enrollment, adjusting staff to the ratio need:
| Scenario | Children | Classroom FTE | Revenue | Owner-director keeps | Absentee owner keeps |
|---|---|---|---|---|---|
| Under-enrolled | 52 | 9 | $685,568 | $52,357 (7.6%) | ($12,704) loss |
| Base case | 60 | 10 | $791,040 | $112,058 (14.2%) | $46,997 (5.9%) |
| Full | 70 | 12 | $922,880 | $156,855 (17.0%) | $91,794 (9.9%) |
This is the core truth about center owner pay: most owners of small centers earn a director’s salary plus a modest profit, and the profit only shows up when the building is close to full. An absentee owner of a 52-child center in this model loses money.
Daycare profit margin: what the filings actually show
Few daycare operators publish audited numbers. The two best public windows are the largest U.S. center operator’s 10-K and franchise disclosure documents.
- Bright Horizons, FY2025. The full service center-based child care segment earned $66.1 million of income from operations on $2.08 billion of revenue, a 3.2% operating margin (my calculation from the 10-K segment table). That segment figure includes $47.0 million of impairment and lease termination costs. Mature centers run 20% to 25% gross margins, and personnel costs “typically comprise approximately 70% of a center’s operating expenses.”
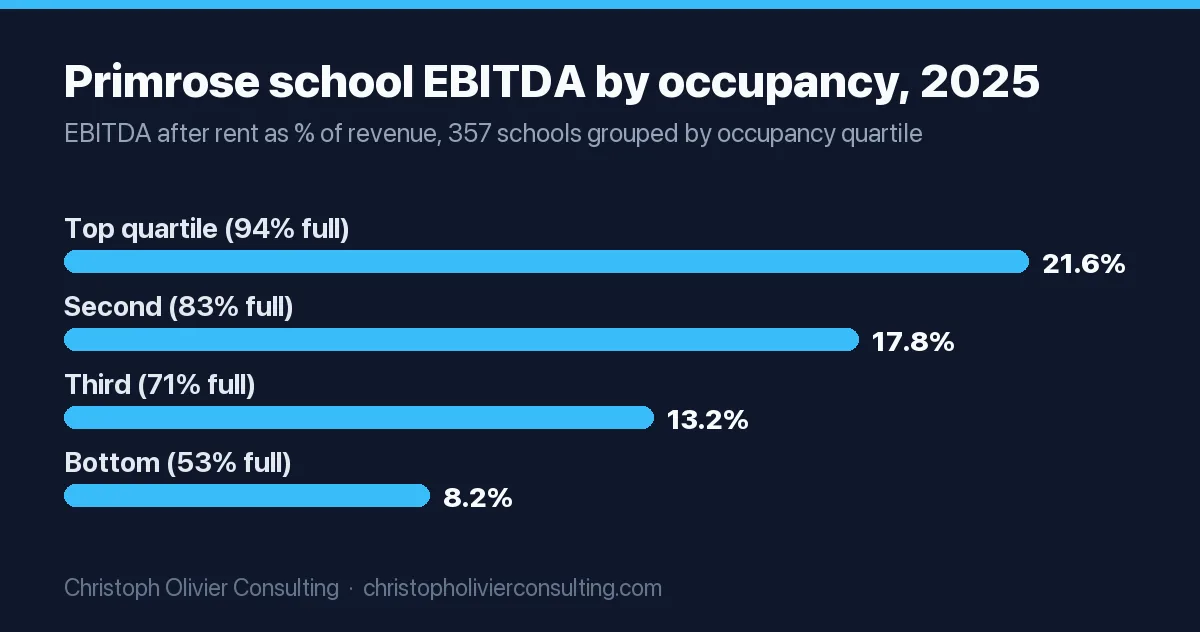
- Primrose Schools, 2026 FDD. Reported by Franchise Chatter from Item 19: 357 rent-reporting schools averaged $2,835,229 in 2025 revenue and 16.3% EBITDA after rent. The summary does not say whether owner compensation sits inside payroll, so treat EBITDA as cash available to the owner before debt and taxes, not as salary.
| Primrose occupancy quartile (2025) | Occupancy | Revenue | Payroll and taxes | Rent | EBITDA |
|---|---|---|---|---|---|
| Top (89 schools) | 94% | $3,557,271 | 42.6% | 9.5% | 21.6% |
| Second (89) | 83% | $3,242,538 | 44.3% | 11.8% | 17.8% |
| Third (89) | 71% | $2,594,458 | 45.1% | 13.6% | 13.2% |
| Bottom (90) | 53% | $1,956,524 | 46.7% | 16.7% | 8.2% |
Source: Primrose Schools 2026 Franchise Disclosure Document, Item 19, Part 6, as reported by Franchise Chatter. Advertising and royalty fees were 10.0% of revenue in every quartile.
The pattern matches my 60-child model: rent and payroll are close to fixed, so each occupancy step adds several points of margin. For context on how this compares to other service businesses, see my profit margin by industry breakdown.
Daycare startup costs
Centers. The most specific public numbers are franchise Item 7 estimates, which list every startup line from build-out to working capital. All are reported by Franchise Chatter from each brand’s 2026 FDD:
| Brand (2026 FDD) | Estimated initial investment | Initial franchise fee | Royalty |
|---|---|---|---|
| Kiddie Academy, leased facility | $590,000 to $1,010,000 | $70,000 to $150,000 | 7% of gross revenues |
| Primrose, adaptive-reuse building | $2,152,500 to $7,265,300 | $50,000 to $80,000 | 7% of gross revenues |
| Primrose, new build | $5,016,600 to $7,960,300 | $50,000 to $80,000 | 7% of gross revenues |
An independent center skips the franchise fee and royalty but still pays for build-out, licensing inspections, furniture, playground and, above all, operating losses while enrollment ramps. Bright Horizons says a new P&L center “will typically achieve breakeven operating performance between 12 to 24 months” and takes about three years to reach steady-state enrollment (10-K, FY2025). Budget working capital for at least that first year. Kiddie Academy’s own Item 19 shows the ramp too: 22 academies open 12 to 24 months averaged $1,540,666 in 2025 revenue against $2,193,815 for 293 mature academies, as reported by Franchise Chatter. If you are weighing a franchise, my notes on franchise marketing explain what the advertising fee does and does not buy you.
In-home. There is no national dataset on home daycare startup costs, so be wary of any page that quotes one without a source. The items you will actually price:
- State license or registration fee, fingerprint background checks for every adult in the home, and required pre-service training hours.
- Home safety fixes your licensing inspection requires: smoke and carbon monoxide detectors, fire extinguisher, outlet covers, gates, fencing.
- Cribs or cots meeting your state’s sleep rules, high chairs, and age-appropriate toys and books.
- Business liability insurance, and a written answer from your homeowner’s insurer on whether your policy still covers the home while you run a paid daycare.
- Enrollment with a CACFP sponsoring organization, which pays the meal reimbursement shown above.
- One to two months of living expenses while your first families enroll.
Is daycare 100% tax deductible?
No. Your business expenses (food, supplies, insurance) are fully deductible, but your home is only partly deductible. IRS Publication 587 (2025) gives licensed daycare providers an exception to the “exclusive use” rule, then has you multiply a space percentage by a time percentage. Applied to my six-child home model:
| Step | Example (my numbers) | Result |
|---|---|---|
| Space: area regularly used ÷ total home | 1,500 ÷ 2,000 sq ft | 75% |
| Time: hours used for daycare ÷ 8,760 hours in a year | 11 hrs × 250 days = 2,750 ÷ 8,760 | 31.4% |
| Time-space percentage | 75% × 31.4% | 23.5% |
| Deductible share of $24,000 in rent, utilities and home insurance | $24,000 × 23.5% | $5,651 |
Pub 587 also lets family daycare providers use standard meal and snack rates instead of tracking food receipts: for 2025 returns, $1.66 breakfast, $3.15 lunch or dinner and $0.93 snack in the contiguous states. The simplified home office method ($5 per square foot, capped at 300 square feet) must be reduced for daycare space that is not used exclusively for business. Ask a tax preparer which method gives you more.
Is buying a daycare a good investment? A pass/fail checklist
Use this before you sign a letter of intent on an existing center. Each line comes from the numbers above.
| Test | Pass | Fail |
|---|---|---|
| Enrollment versus licensed capacity, trailing 12 months | 80% or higher (Primrose top two quartiles: 83% to 94%) | Below 70% with no waitlist |
| Payroll and payroll taxes as % of revenue | Under 47% (Primrose quartiles: 42.6% to 46.7%) | Above 47% even with occupancy over 80% |
| Rent as % of revenue | Under 12% (Primrose average 12.3%) | Over 16% (Primrose bottom quartile 16.7%) |
| Profit after paying a market-rate director | Positive, with the director at or above the $58,090 BLS median | Profit exists only because the seller works unpaid |
| Infant tuition versus preschool tuition | Infant priced high enough to cover 1:6 staffing | Same price across ages |
| Subsidy and CACFP dependence | You know what share of revenue is public money and its current rates | Seller cannot break it out |
| Lease term remaining | Remaining term plus options is longer than your payback period | Shorter than your payback period, or not assignable to you |
The biggest trap is the third row of my center scenario table: a center that looks profitable while the owner is the unpaid director can lose money the day you hire one. Price the business on profit after a market salary.
Where the extra owner income comes from
The models above point to the same three levers, in order of size:
- Occupancy. In the center model, going from 52 to 70 children moves owner-director pay from $52,357 to $156,855. In the home model, one empty slot costs about $13,200. Filling seats is a demand-generation problem, and a small, steady Google Ads budget plus strong local search visibility is usually cheaper than an empty room.
- Price by age. Ratios make infants the costliest children to serve. Charge for that.
- Rent. Primrose’s bottom quartile pays 16.7% of revenue in rent versus 9.5% at the top. A lease signed before enrollment is proven is the hardest cost to undo.
If you own a center and want a second opinion on your enrollment funnel, you can book a consultation.
Ready to scale your revenue?
Book a free 30-min consultation. We’ll diagnose your growth bottleneck and map out the 3 highest-leverage moves for your business.
Frequently asked questions
How much does a daycare owner make a year?
It depends on the setting and enrollment. In my worked models, a full six-child licensed home clears about $68,700 before tax, and a 60-child center owner who is also the director keeps about $112,000 before tax. Most real businesses are smaller: the median U.S. child day care business with no employees took in $10,000 to $24,999 in 2022 (Census).
How much does an in-home daycare owner make?
A licensed home caring for six children at the 2025 national average price of $13,184 per child, plus USDA CACFP Tier I meal reimbursement, earns about $88,100 in revenue and $68,700 in profit before tax in my model, or about $22.90 an hour over 3,000 hours. With four children, profit falls to about $42,300, below the hourly median for employed childcare workers.
What is the profit margin of a daycare?
Thin and driven by occupancy. Bright Horizons' center segment earned a 3.2% operating margin in 2025 per its 10-K. Primrose franchise schools averaged 16.3% EBITDA after rent in 2025, from 8.2% at 53% occupancy to 21.6% at 94%, as reported by Franchise Chatter from the 2026 FDD. Payroll is the biggest cost.
How much money do you need to start a daycare?
For a franchise center, 2026 FDD estimates reported by Franchise Chatter run from $590,000 to $1,010,000 for a leased Kiddie Academy to $5.0 million to $8.0 million for a new-build Primrose. Plan working capital too: Bright Horizons says new centers typically break even in 12 to 24 months. There is no reliable national figure for in-home startup costs; price your state's license, safety fixes, equipment and insurance.
Is daycare 100% tax deductible?
No. Business costs such as food, supplies and insurance are deductible, but home costs are only partly deductible. IRS Publication 587 lets licensed providers multiply the share of the home used by the share of hours used. In my example, 75% of the space for 31.4% of the year gives 23.5% of rent and utilities. Owners also pay 15.3% self-employment tax on 92.35% of net earnings.
Is buying a daycare a good investment?
Only if it is profitable after paying a market-rate director. Check trailing enrollment against licensed capacity (80% or more is strong), payroll under about 47% of revenue, rent under about 12%, and a lease long enough to recover your price. In my center model, a 52-child center loses money once the owner stops working as the unpaid director.
Practice economics benchmarks