
The average independent pharmacy owner earns roughly $150,000 to $175,000 a year per store in owner pay plus operating profit, by my estimate from the latest NCPA figures, and owners with two or three stores earn a multiple of that. The best public estimate before NCPA stopped publishing owner profit came from Drug Channels Institute: about $158,000 in 2020 for a pharmacist who owned a single pharmacy, down from about $200,000 in 2015. That is only modestly above what an employed pharmacist makes: the BLS median for pharmacists working in pharmacies and drug retailers was $132,940 in May 2025.
Short answer: The average independent pharmacy had $5.41 million in sales in 2024 but kept only an 18.2% gross margin, the lowest in ten years (2025 NCPA Digest). After staff payroll, about $411,000 is left per store to cover rent, insurance, software, fees and the owner. My worked estimate puts owner pay plus profit at about $154,000 to $172,000 per store. NCPA does not publish owner income, so treat any single number as an estimate.
Most pages on this question quote one old figure or a salary-site range with no source. Below, I combine the four public datasets that measure pharmacy money: the NCPA Digest (independent pharmacies only), Census Statistics of U.S. Businesses (every pharmacy with a payroll), the BLS wage survey (employed pharmacists) and Drug Channels’ owner-profit estimates. Every calculation I added is labeled. The worked P&L and an owner checklist are further down.
How much does a pharmacy owner make? What each source actually measures
| Figure | What it measures | Amount | Source and year |
|---|---|---|---|
| Owner’s discretionary profit, single-store owner | Owner compensation plus the pharmacy’s operating income, estimated | about $158,000 (2020); $141,000 (2019); $129,000 (2018); about $200,000 (2015) | Drug Channels Institute, Feb 2022 and Feb 2021, estimated from NCPA Digest data |
| Owner pay plus profit, average store, 2024 | My estimate from 2024 Digest averages (method below) | $154,000 to $172,000 | My calculation from the 2025 NCPA Digest |
| Employed pharmacist, pharmacies and drug retailers | Median annual wage, employees only | $132,940 | BLS Occupational Outlook Handbook, May 2025 |
| Staff pharmacist at an independent pharmacy | Average hourly wage reported by owners | $64.30 an hour, about $133,744 a year at 2,080 hours (my calculation) | 2025 NCPA Digest, Table 7 (2024 data) |
| All pharmacists, all settings | Median annual wage; 10th and 90th percentiles | $140,910; under $99,290 to over $174,230 | BLS, May 2025 |
Three things to know before you use any of these numbers:
- Owner income is not a salary line. An owner can pay herself a large salary and show a small profit, or a small salary and a large profit. Drug Channels uses “owner’s discretionary profit” (owner compensation plus operating income) for that reason, and so do I.
- NCPA stopped publishing the figure. Drug Channels notes that the Digest “formerly reported the ODP, but it has hidden the figure in recent years.” The 2025 Digest has sales, cost of goods, gross profit and payroll, but no operating expense detail and no owner pay. Anyone quoting a precise current owner salary is estimating.
- Most owners own more than one store. The average independent owner has an ownership stake in 2.3 pharmacies (2025 NCPA Digest, Table 1). Per-owner income can be two or three times the per-store figure, minus the cost of paying a pharmacist-in-charge at each extra location.
How much does an independent pharmacy make in revenue?
The average independent pharmacy location had $5,411,000 in sales in 2024, a ten-year high, up from $4,997,000 in 2023 and $3,400,000 in 2019 (2025 NCPA Digest, Table 2). It filled 67,601 prescriptions, about 217 a day, at an average charge of $76.21. Multiply those two and prescriptions account for about $5.15 million, or 95% of sales (my calculation). The Digest itself says prescriptions are over 95% of independent pharmacy sales.
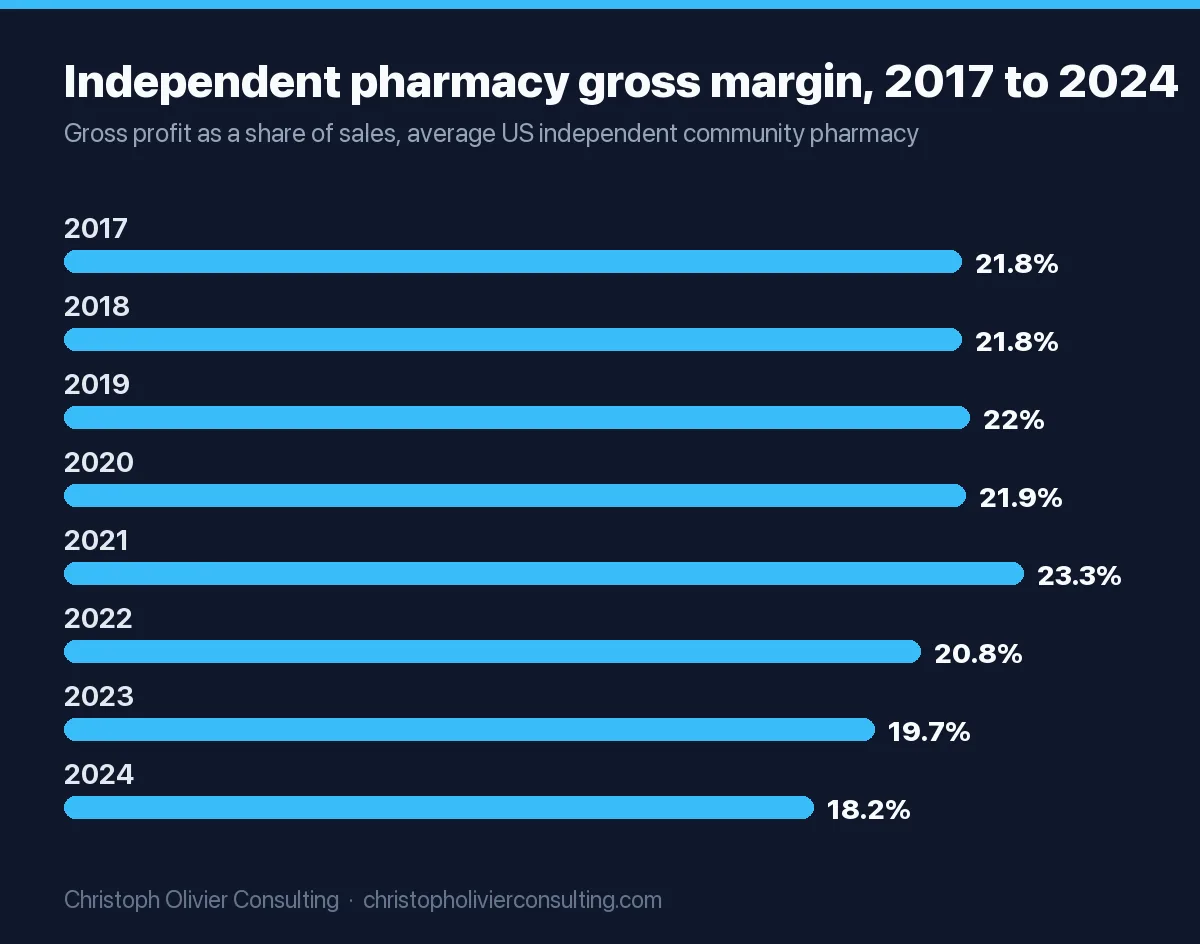
Rising sales did not mean rising profit. Cost of goods rose faster than sales: from 78.0% of sales in 2019 to 81.8% in 2024.
| Year | Average sales per location | Gross profit margin | Gross profit per location (my calculation) | Payroll, % of sales |
|---|---|---|---|---|
| 2015 | $3,678,000 | 22.3% | $820,194 | 12.8% |
| 2019 | $3,400,000 | 22.0% | $748,000 | 13.1% |
| 2020 | $3,460,000 | 21.9% | $757,740 | 12.9% |
| 2021 | $4,031,000 | 23.3% | $939,223 | 13.3% |
| 2022 | $4,385,000 | 20.8% | $912,080 | 11.0% |
| 2023 | $4,997,000 | 19.7% | $984,409 | 10.6% |
| 2024 | $5,411,000 | 18.2% | $984,802 | 10.6% |
Source: 2025 NCPA Digest, sponsored by Cardinal Health, Tables 2 and 3. The Digest is a voluntary owner survey and the data are not audited. Gross profit in dollars is sales times margin, my calculation.
Look at the last two rows. Sales rose $414,000 from 2023 to 2024, and gross profit dollars barely moved: $393 more per store. That is the core of the owner-income problem in one line.
What Census data says about pharmacy revenue (chains included)
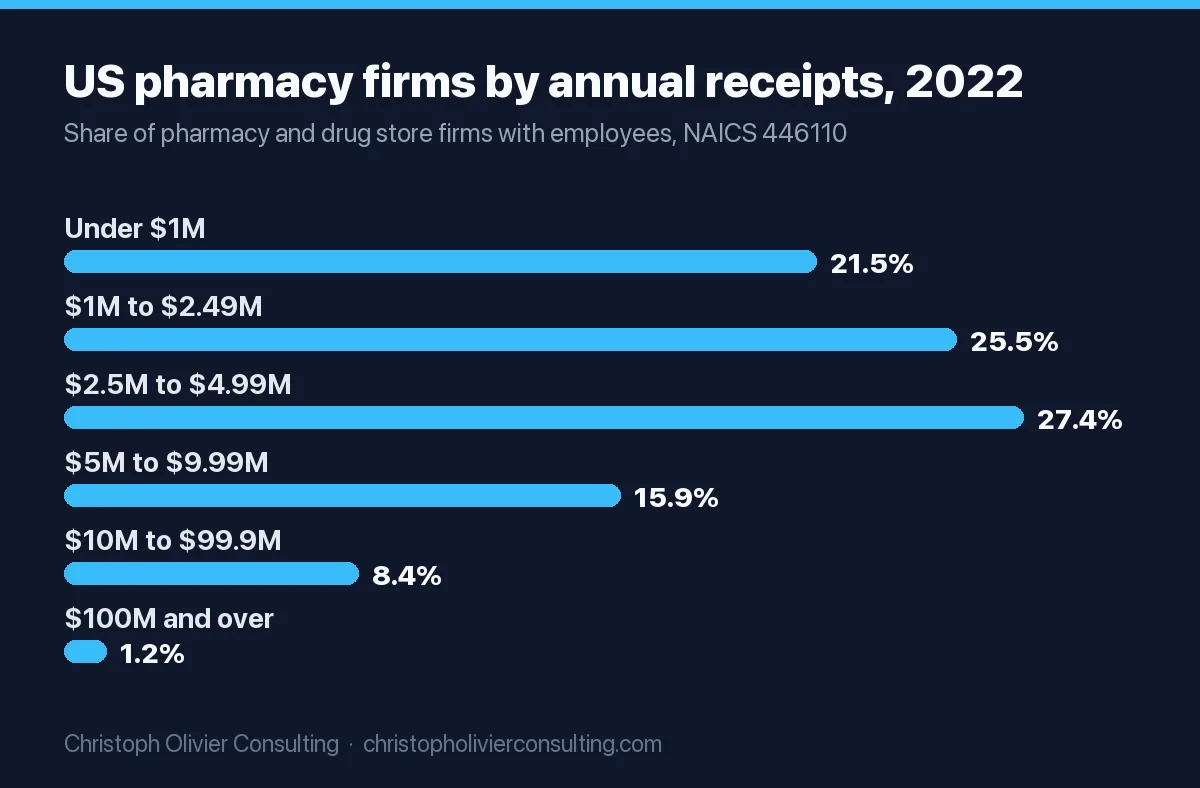
The Census Bureau counts every pharmacy with a payroll. In 2022, its Statistics of U.S. Businesses recorded 18,857 pharmacy and drug store firms (NAICS 446110) running 42,707 locations with $339.0 billion in receipts. That is $7.94 million per location on average, but the average is dominated by chains: the 234 firms with $100 million or more in receipts ran 22,379 locations and took 76.5% of all receipts (my calculations from the same file).
Strip those out and the picture looks like the independent market. The 18,623 firms under $100 million ran 20,328 locations, averaging $3.92 million per location with payroll at 10.2% of receipts and 8.9 employees per location (my calculations). The median pharmacy firm sits in the $2.5 million to $5 million band.
| Firm annual receipts (2022) | Firms | Share of firms | Average receipts per firm | Payroll, % of receipts | Employees per location |
|---|---|---|---|---|---|
| Under $1 million | 4,057 | 21.5% | $459,592 | 20.9% | 2.7 |
| $1 million to $2.49 million | 4,810 | 25.5% | $1,760,637 | 13.3% | 5.6 |
| $2.5 million to $4.99 million | 5,159 | 27.4% | $3,606,682 | 10.6% | 8.8 |
| $5 million to $9.99 million | 3,006 | 15.9% | $6,814,880 | 9.8% | 13.1 |
| $10 million to $99.9 million | 1,591 | 8.4% | $19,001,143 | 8.7% | 19.0 |
| $100 million and over | 234 | 1.2% | $1,108,317,538 | 8.0% | 22.0 |
Source: U.S. Census Bureau, SUSB 2022 (released April 2025), NAICS 446110 Pharmacies and Drug Stores, employer firms. Bands are combined from the published size classes; shares, averages, payroll ratios and employees per location are my calculations. Firm size counts the firm’s receipts in all industries.
The payroll column is the useful one for an owner. Small stores carry a much heavier payroll load per dollar of sales, because you need a pharmacist on duty whether you fill 80 or 300 prescriptions a day. A store under $1 million in receipts spends about 21 cents of every sales dollar on payroll; a $5 million store spends about 10 cents.
Pharmacy profit margins: gross margin is about 18% to 21%, and net margin is not published
Independent pharmacy gross margin was 18.2% in 2024, down from 22.3% in 2015 (2025 NCPA Digest, Table 3). NCPA notes that, excluding 2021, when COVID-19 vaccine payments lifted gross profit to 23.3%, the margin fell every year since 2019. For 2025, the 2026 Digest reports a rebound to 20.9%, as quoted by PCMA; the 2026 Digest’s full tables were not publicly posted when I checked, so its 2025 sales figure is not included here.
Net profit margin is the number most searchers want, and there is no current primary source for it. The NCPA Digest does not publish operating expenses or net income, and the IRS publishes sole-proprietor data only for “health and personal care retailers” as a whole, not for pharmacies. Any page that quotes a precise independent pharmacy net margin is citing an estimate or a vendor survey. What you can compute from primary data is shown in the P&L below.
Two per-prescription numbers explain why margins are thin:
- Cost of dispensing: $15.00 per prescription at the average independent pharmacy in 2024, up from $13.67 in 2023 (2025 NCPA Digest).
- Gross profit per prescription: about $14.57 in 2024 ($984,802 gross profit divided by 67,601 prescriptions, my calculation, which slightly overstates it because about 5% of sales are non-prescription).
When the average gross profit on a prescription is below the average cost to fill it, the store survives on volume, a better payer mix, services and front-end sales, not on the typical script.
Who pays for the prescriptions
| Payer | 2020 | 2021 | 2022 | 2023 | 2024 |
|---|---|---|---|---|---|
| Medicare Part D | 36% | 36% | 35% | 35% | 34% |
| Medicaid | 19% | 18% | 16% | 20% | 18% |
| Other third party (commercial) | 35% | 35% | 39% | 34% | 36% |
| Non third party (cash) | 10% | 11% | 10% | 11% | 12% |
Source: 2025 NCPA Digest, Table 16, share of prescriptions.
More than half of prescriptions are paid by government programs, mostly through plans and pharmacy benefit managers. That is why federal rules move owner income directly:
- DIR fees moved to the counter in 2024. Since January 1, 2024, Part D plans and their PBMs must apply all pharmacy price concessions at the point of sale instead of clawing them back months later. In its December 14, 2023 letter, CMS said it had “heard many concerns regarding the potential impact on pharmacy cash flow” and asked plans to make cash flow arrangements with network pharmacies. The fees now show up on each claim instead of arriving later as a lump.
- Negotiated Medicare drug prices started in 2026. For drugs in the Medicare Drug Price Negotiation Program, pharmacies are paid the lower maximum fair price and wait for a manufacturer refund. CMS’s Medicare Transaction Facilitator fact sheet says refunds are reaching pharmacies within 21 days of the date of service, on average. An analysis NCPA commissioned from 3 Axis Advisors put the potential weekly cash flow shortfall at $10,838 per independent pharmacy (as summarized in the 2025 Digest).
- Below-cost Part D claims are common. In NCPA’s January 2025 member survey, 29.2% of independent pharmacists said they were paid below NADAC (the national average acquisition cost) on half or more of their Part D prescriptions, and 80.3% said their business’s financial health declined in 2024 (2025 Digest). These are survey responses from an advocacy group, so read them as owner sentiment, not audited data.
Worked P&L: what the average independent pharmacy leaves for its owner
This is my own calculation, built from the 2024 averages in the 2025 NCPA Digest. The one line the Digest does not publish, “all other operating expenses” (rent, utilities, insurance, software, delivery, card fees, accounting, licenses), I back-calculated from the last two years Drug Channels published an owner-profit estimate. Assumptions are in the table.
| Line | % of sales | Average store, 2024 | Where the number comes from |
|---|---|---|---|
| Sales | 100% | $5,411,000 | NCPA Digest, Table 2 |
| Cost of goods sold | 81.8% | $4,426,198 | Digest, Table 3; dollars my calculation |
| Gross profit | 18.2% | $984,802 | Digest, Table 3 |
| Staff payroll | 10.6% | $573,566 | Digest, Table 3 (assumed to exclude owner pay, as in Drug Channels’ method) |
| Left for overhead and owner | 7.6% | $411,236 | My calculation |
| All other operating expenses | 4.4% to 4.8% | $239,707 to $257,023 | Assumption: same share of sales as implied in 2020 (4.4%) and 2019 (4.8%), see below |
| Owner pay plus operating profit | 2.9% to 3.2% | $154,213 to $171,529 | My estimate |
How I got the 4.4% to 4.8%: in 2019 the average store had $748,000 of gross profit and $445,400 of payroll (13.1% of $3.4 million). Drug Channels estimated owner profit at $141,000. The gap, $161,600, is everything else, or 4.75% of sales. The same math for 2020 ($757,740 gross profit, $446,340 payroll, $158,000 owner profit) gives $153,400, or 4.43%. Both years land close together, which is why I use them as the range. If instead those costs stayed flat in dollars since 2020, owner pay plus profit would be closer to $250,000 to $258,000; rent, insurance and wages did not stay flat, so I treat that as an upper bound, not a forecast.
Copy-ready owner income worksheet
Put your own numbers in this order. It takes ten minutes with a year of financials or a seller’s tax returns.
- Annual prescriptions × average gross profit per prescription (not per-script revenue) = prescription gross profit. Benchmark: about $14.57 at the 2024 average store (my calculation).
- Add front-end and services gross profit (immunizations, compounding, long-term care, clinical services).
- Subtract staff payroll including taxes and benefits. Benchmark: 10.6% of sales (NCPA 2024); 13.3% for a $1 million to $2.5 million store (Census 2022).
- Subtract rent, utilities, insurance, software, delivery, card fees, professional fees and licenses. My derived benchmark: 4.4% to 4.8% of sales.
- The result is your owner’s discretionary profit before debt service and income tax. If you bought the store with a loan, subtract annual principal and interest to see what you can actually take home.
- Compare the result with $133,744, the annual equivalent of the $64.30 average staff pharmacist wage at independents (my calculation from the Digest). The difference is what you are paid for the risk and the capital you have tied up.
Sensitivity at the average 2024 store (my calculations): each 1 point of gross margin is worth $54,110 a year; the reported rebound from 18.2% to 20.9% would add about $146,000 if sales held at 2024 levels. Each 1 point of payroll as a share of sales costs the same $54,110. That is why owners watch contract rates and staffing more than anything else.
Is owning a pharmacy profitable?
Usually, but less than it used to be, and it is now the owner’s operating skill, payer contracts and store size that decide it. The evidence on both sides:
- For: the 2026 Digest counts 18,988 independent pharmacies, essentially unchanged from 18,960 in 2025, nearly 37% of US retail pharmacies, and reports gross margin back up to 20.9% for 2025 (Pharmacy Times, October 2026; PCMA). Average prescription volume was 65,795 per store in 2025.
- Against: a Health Affairs study (Guadamuz et al., December 2024) found that 29.4% of the 88,930 retail pharmacies operating during 2010 to 2020 had closed by 2021, and that independent pharmacies were at greater risk of closure than chain pharmacies in every neighborhood and market type studied.
- Thin per-script economics: gross profit of about $14.57 per prescription against a $15.00 cost of dispensing (2024) leaves little room for a weak payer mix or an overstaffed store.
Is owning an independent pharmacy worth it compared with a staff job?
On the 2024 averages, a single-store owner earns perhaps $20,000 to $40,000 more than a staff pharmacist, before debt service on the purchase, and with personal guarantees on leases and wholesaler accounts. Drug Channels made the same point in 2021, when it wrote that owning a pharmacy “now brings roughly the same financial reward as being an employee,” and again in 2022, when the gap had widened. The financial case for ownership is stronger for multi-store owners, owners who also work as the pharmacist (saving a pharmacist salary), and stores with long-term care, compounding or cash-pay services.
Owner decision checklist: pass or fail
| Test | Pass | Fail | Benchmark source |
|---|---|---|---|
| Gross margin | 18% or higher | Below 18% | NCPA: 18.2% (2024), 20.9% (2025 as reported) |
| Staff payroll as % of sales | About 11% or less at $3 million+ in sales | Above 13% at the same size | NCPA 10.6% (2024); Census 10.6% for $2.5M to $5M firms (2022) |
| Prescription volume | About 200+ per day | Under about 150 per day without a niche | NCPA average 217 per day (2024) |
| Gross profit per script vs. cost to fill | Gross profit per script above your cost of dispensing | Below it on most payer contracts | NCPA cost of dispensing $15.00 (2024) |
| Cash and credit line | Covers several weeks of drug purchases while refunds clear | No buffer | CMS: MFP refunds average 21 days; 3 Axis estimate $10,838 weekly shortfall |
| Owner pay vs. employment | Discretionary profit, after loan payments, beats about $134,000 | Below a staff pharmacist wage | NCPA $64.30 per hour (2024) |
Thresholds are my rules of thumb built from the cited averages, not industry standards. A store that fails two or more tests needs a specific turnaround plan before it is worth buying.
Can you make $200,000 or $300,000 as a pharmacist?
As an employee, rarely. The top 10% of all pharmacists earned more than $174,230 in May 2025 (BLS), so $200,000 sits above the 90th percentile and $300,000 is far outside the employee distribution. BLS wage data exclude self-employed owners.
As an owner, $200,000 is possible and $300,000 usually takes more than one store or an above-average store. On my 2024 estimate, a single average store yields $154,000 to $172,000; the same store at the 2025 reported 20.9% margin would yield about $146,000 more. Drug Channels’ estimate for a single-store owner peaked around $200,000 in 2015. No public dataset shows how many owners clear $300,000, so be skeptical of anyone who quotes a share.
What field of pharmacy makes the most money?
Among employees, hospitals pay the most. Median annual wages for pharmacists by industry, May 2025 (BLS):
| Industry | Median annual wage, May 2025 |
|---|---|
| Hospitals (state, local and private) | $157,290 |
| Ambulatory healthcare services | $153,920 |
| General merchandise retailers | $151,370 |
| Food and beverage retailers | $144,000 |
| Pharmacies and drug retailers | $132,940 |
Pharmacies and drug retailers employ the most pharmacists (37% of the 325,200 jobs in 2025) and pay the lowest median of the five. That is the honest benchmark for an owner deciding whether ownership pays: the alternative is not the hospital median, it is the retail median.
What separates the owners who earn more
The averages above hide a wide spread. The levers that show up in the data:
- Services beyond dispensing. In 2025, 91% of independents gave flu shots, 81% offered medication therapy management, 55% served long-term care patients and 48% compounded (2026 NCPA Digest via Pharmacy Times). 34% now run as retail and long-term care combination sites.
- Cash-pay share. 12% of independent prescriptions were cash-paid in 2024, up from 10% in 2020 (Digest, Table 16).
- Location. 36% of independents are in towns under 10,000 people and nearly two thirds serve areas under 50,000 (2025 Digest),.
- Multiple stores. With an average of 2.3 pharmacies per owner, scale is the most common route to a higher total income.
Growing script count is also a local marketing problem: prescriber relationships, med sync enrollment and showing up in map results for “pharmacy near me.” If that is your gap, the pharmacy marketing guide covers channels and costs, and can pharmacies advertise covers what the rules allow. For a direct conversation about your store’s numbers, you can book a consultation.
How pharmacy owner pay compares with other practice owners
Pharmacy is a high-revenue, low-margin business: $5.41 million in average sales but a gross margin under 21%. Service practices are the opposite, with far smaller revenue and much higher margins. If you are comparing ownership paths, see the same analysis for optometrist owners, physical therapy clinic owners and chiropractic practices, or the cross-industry figures in profit margin by industry.
This page covers US pharmacies only. Owner income in the UK, Canada and India runs on different reimbursement systems, so none of these figures transfer.
Ready to scale your revenue?
Book a free 30-min consultation. We’ll diagnose your growth bottleneck and map out the 3 highest-leverage moves for your business.
Frequently asked questions
How much does a pharmacy owner make?
About $154,000 to $172,000 per store in owner pay plus operating profit, by my estimate from 2024 NCPA Digest averages. Drug Channels Institute estimated about $158,000 for a single-store owner in 2020, down from about $200,000 in 2015. NCPA no longer publishes owner income, and the average owner holds a stake in 2.3 pharmacies, so per-owner income can be higher.
What is the independent pharmacy owner salary compared with a staff pharmacist?
Independent pharmacies paid staff pharmacists an average of $64.30 an hour in 2024 (NCPA Digest), about $133,744 a year at 2,080 hours. The BLS median for pharmacists in pharmacies and drug retailers was $132,940 in May 2025. A single average store leaves its owner roughly $20,000 to $40,000 more than that before loan payments, by my estimate.
How much does an independent pharmacy make in revenue?
The average independent pharmacy location had $5,411,000 in sales in 2024, a ten-year high, and filled 67,601 prescriptions, about 217 a day, at an average charge of $76.21 (2025 NCPA Digest). Census data for 2022 show pharmacy firms under $100 million in receipts averaging $3.92 million per location, with the median firm between $2.5 million and $5 million.
What are pharmacy profit margins?
Independent pharmacy gross margin was 18.2% in 2024, the lowest in ten years, down from 22.3% in 2015 (2025 NCPA Digest). The 2026 Digest reports a rebound to 20.9% for 2025, as quoted by PCMA. Net profit margin is not published by NCPA or the IRS for pharmacies; my worked estimate puts owner pay plus profit at about 3% of sales.
Is owning an independent pharmacy profitable?
Usually, but margins are thin. In 2024 the average independent pharmacy earned about $14.57 of gross profit per prescription against a $15.00 cost of dispensing (NCPA data, my calculation). A Health Affairs study found 29.4% of retail pharmacies operating in 2010 to 2020 had closed by 2021, with independents at higher risk than chains.
Can you make $200,000 as a pharmacist?
Rarely as an employee: the top 10% of pharmacists earned more than $174,230 in May 2025 (BLS). As an owner it is possible, especially with more than one store or an above-average margin. Each 1 point of gross margin is worth about $54,110 a year at the average 2024 store, by my calculation from NCPA figures.
Practice economics benchmarks