

The average veterinary clinic location in the US takes in about $1.86 million a year: 34,000 employer veterinary locations reported $63.2 billion in receipts in 2022, according to the Census Bureau’s Statistics of U.S. Businesses (NAICS 541940, Veterinary Services). The AVMA’s own survey of practice owners puts the average practice lower, at $1,572,379 in 2025, and the typical independent firm takes in under $1 million. Whether that revenue makes owning a vet clinic profitable depends mostly on payroll, which already eats about 36 cents of every dollar.
Short answer: Average revenue is about $1.86 million per veterinary location (Census, 2022) and $1.57 million per practice in AVMA’s 2025 owner survey, or about $671,830 per veterinarian. The median veterinary firm sits near the top of the $500,000 to $999,999 band. Owning a clinic is usually profitable, but no public dataset publishes an industry net margin: the hard numbers are payroll at 36.0% of receipts and an average veterinarian income of $163,014 in 2025.
Most pages ranking for this question give a range like “$300,000 to $5,000,000” or an owner salary band with no source behind it. This page compiles the primary sources that actually measure veterinary practice money: Census receipts by firm size and state, the AVMA’s practice owner survey, BLS wage data, and the 10-K filings of the public companies that run clinics. Every figure labeled “my calculation” was computed from the published totals. At the end there is a copy-ready P&L worksheet and a pass/fail scorecard you can run on your own clinic or on one you plan to buy.
Veterinary clinic average revenue: what each source says
Each source counts something different, so read the “what it measures” column before you compare your clinic to any of them.
| Source and year | What it measures | Average | How it was calculated |
|---|---|---|---|
| Census SUSB 2022, NAICS 541940 | Receipts per veterinary location (establishment) with paid employees, all owners including corporate chains | $1,858,528 | My calculation: $63,189,936,000 ÷ 34,000 locations |
| Census SUSB 2022, NAICS 541940 | Receipts per veterinary firm (one firm can own many locations) | $2,402,111 | My calculation: $63,189,936,000 ÷ 26,306 firms |
| Census SUSB 2022, firms under 20 employees | Receipts per location for small, mostly independent firms | $964,223 | My calculation: $21,671,865,000 ÷ 22,476 locations |
| AVMA Practice Owners Survey, 2025 data | Gross revenue per practice, owner-reported | $1,572,379 | Published by AVMA (about $1.5 million in 2024) |
| AVMA Practice Owners Survey, 2025 data | Gross revenue per veterinarian in the surveyed practices | $671,830 | Published by AVMA |
| AVMA Practice Owners Survey, 2024 data | Gross revenue per full-time-equivalent (FTE) veterinarian | $554,982 | Published by AVMA; down in real terms from nearly $600,000 in 2019 |
| Census Nonemployer Statistics 2022, NAICS 54194 | Receipts per veterinary business with no employees (relief and solo mobile vets) | $54,163 | My calculation: $1,382,725,000 ÷ 25,529 businesses |
Why the numbers differ:
- Census is the most complete count. It covers every veterinary location with at least one employee, including hospitals owned by national chains, and reports receipts actually taken in. Large emergency and specialty hospitals pull the average up.
- The AVMA figure is a survey of owners. The 2025 analysis covers practices that reported between $50,000 and $9 million in gross revenue, so the biggest hospitals are excluded. It is the better benchmark for a single general practice.
- The two AVMA per-vet numbers are not the same metric. The 2024 figure is revenue per FTE veterinarian; the 2025 article reports revenue per veterinarian in the represented practices. Do not read the jump from $554,982 to $671,830 as a 21% raise.
- The IRS does not help here. Its standard sole proprietorship table for tax year 2023 and its corporation tables roll veterinary services into broader “other professional services” lines, so there is no veterinary-only margin to pull from tax returns.
What a typical vet clinic brings in (the median is lower than the average)
Census also publishes veterinary firms by revenue band. The table adds the share of firms, the cumulative share and the average per firm in each band. Note that this table counts firms, so a 300-location chain is one row entry in the top band.
| Annual receipts of the firm | Firms | Share of firms | Cumulative share | Average receipts per firm (my calculation) | Share of all veterinary receipts |
|---|---|---|---|---|---|
| Under $100,000 | 1,875 | 7.1% | 7.1% | $48,273 | 0.1% |
| $100,000 to $499,999 | 5,749 | 21.9% | 29.0% | $278,642 | 2.5% |
| $500,000 to $999,999 | 5,886 | 22.4% | 51.4% | $736,360 | 6.9% |
| $1 million to $2.49 million | 8,804 | 33.5% | 84.8% | $1,565,379 | 21.8% |
| $2.5 million to $4.99 million | 2,944 | 11.2% | 96.0% | $3,322,124 | 15.5% |
| $5 million to $9.99 million | 723 | 2.7% | 98.8% | $6,474,736 | 7.4% |
| $10 million to $99.9 million | 288 | 1.1% | 99.9% | $20,657,861 | 9.4% |
| $100 million or more | 37 | 0.1% | 100% | $620,828,892 | 36.4% |
Source: Census SUSB 2022, receipts-size table, NAICS 541940. The published $5M to $7.49M and $7.5M to $9.99M bands are combined here, as are the nine bands from $10M to $99.9M.
Three things stand out:
- The median veterinary firm takes in just under $1 million. 51.4% of firms fall below $1 million, so the middle firm sits at the top of the $500,000 to $999,999 band.
- The single most common size is $1 million to $2.49 million, which is where the AVMA’s $1.57 million average practice lands.
- 37 firms take in 36.4% of all veterinary revenue. Those firms, each with $100 million or more in receipts, operate 6,193 of the 34,000 locations (18.2%). That concentration is the corporate consolidation you hear about, measured.
Average revenue per vet location by firm size
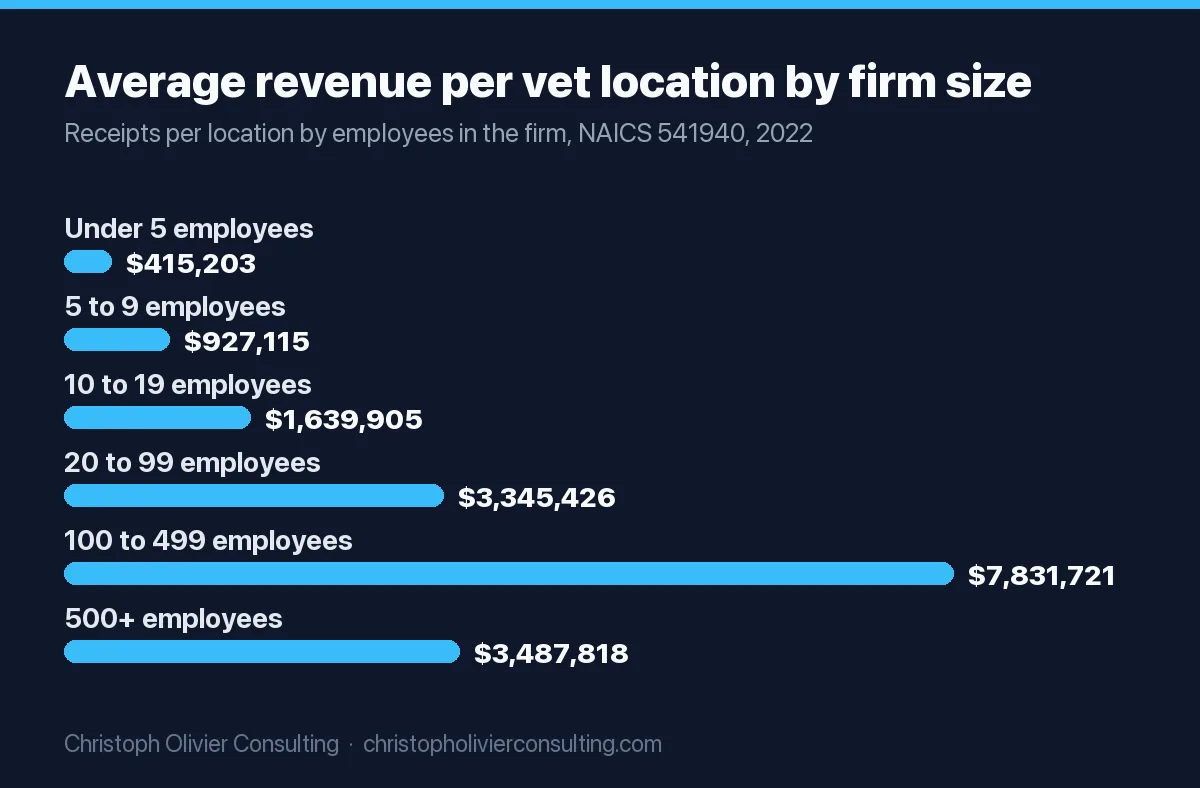
The second Census cut, by number of employees in the firm, shows how revenue scales with staff, and how much of it goes straight to payroll.
| Employees in the firm | Firms | Locations | Average receipts per location | Payroll as % of receipts | Receipts per employee |
|---|---|---|---|---|---|
| Under 5 | 8,547 | 8,559 | $415,203 | 26.1% | $244,410 |
| 5 to 9 | 6,573 | 6,600 | $927,115 | 28.9% | $135,612 |
| 10 to 19 | 7,178 | 7,317 | $1,639,905 | 32.8% | $123,637 |
| 20 to 99 | 3,831 | 4,457 | $3,345,426 | 37.6% | $123,239 |
| 100 to 499 | 133 | 451 | $7,831,721 | 39.2% | $157,676 |
| 500 or more | 44 | 6,616 | $3,487,818 | 39.4% | $136,929 |
| All veterinary firms | 26,306 | 34,000 | $1,858,528 | 36.0% | $134,841 |
Source: Census SUSB 2022, US and state file, NAICS 541940. All averages and ratios are my calculations from published receipts, payroll, employment and location counts. The 500+ receipts cell carries a moderate noise flag (2% to 5%).
The 100 to 499 employee group averages $7.8 million per location because those firms tend to run large emergency and specialty hospitals. The 44 largest firms (500+ employees) run 6,616 locations at about $3.5 million each. Very small firms show a low payroll ratio partly because an unincorporated owner’s draw is not payroll: in a one-vet clinic the owner can be paid out of profit.
Veterinary clinic average revenue by state
Revenue per location varies by more than 2.5x between states. Highest and lowest averages, plus the four largest markets:
| State | Veterinary locations | Total receipts | Average receipts per location (my calculation) |
|---|---|---|---|
| Massachusetts | 581 | $1.87 billion | $3,211,733 |
| Delaware | 79 | $227 million | $2,869,937 |
| New Jersey | 709 | $1.93 billion | $2,725,595 |
| Hawaii | 92 | $220 million | $2,387,554 |
| Connecticut | 371 | $877 million | $2,363,660 |
| New York | 1,451 | $3.34 billion | $2,299,484 |
| California | 3,379 | $7.42 billion | $2,195,587 |
| Texas | 2,762 | $4.97 billion | $1,797,688 |
| Florida | 2,574 | $4.25 billion | $1,652,659 |
| Oklahoma | 548 | $678 million | $1,237,832 |
| Idaho | 269 | $332 million | $1,234,130 |
| Arkansas | 345 | $418 million | $1,210,565 |
| Montana | 230 | $267 million | $1,159,578 |
Source: Census SUSB 2022, NAICS 541940, state totals. Massachusetts and Delaware receipts carry a moderate noise flag (2% to 5%). The District of Columbia is left out (23 locations, $5.1 million average) because its cell is flagged high noise, meaning the published value was changed by 5% or more under the Census Bureau’s disclosure method.
A high state average does not mean a small clinic earns more there: the state figure mixes small clinics with large specialty and emergency hospitals. Compare yourself with the firm-size table first, then the state.
Where vet clinic revenue comes from
The AVMA’s 2025 owner survey split practice revenue across 13 profit centers. Seven of them produce 85.1% of revenue, and every one of the seven depends on veterinarian time.
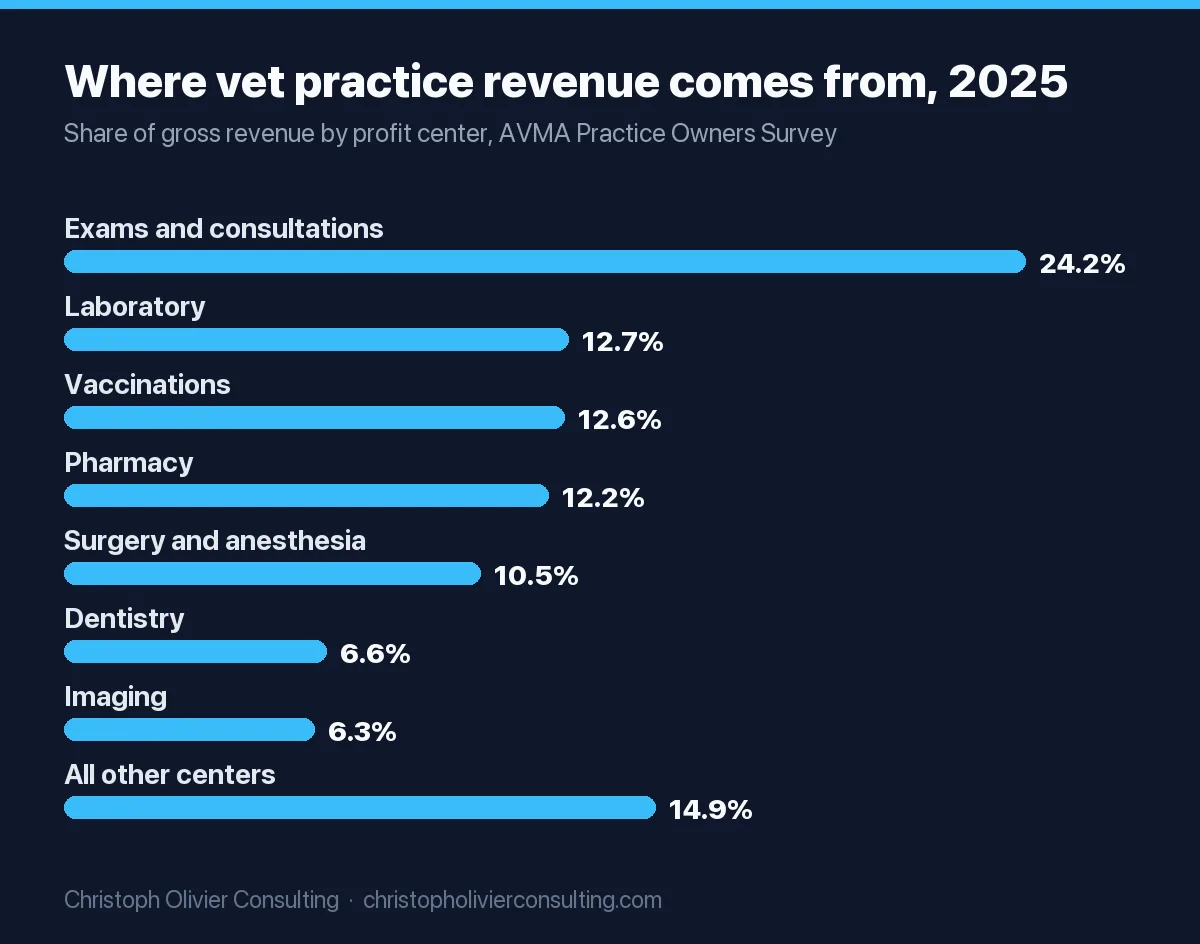
| Profit center | Share of revenue, 2025 | Share of revenue, 2023 | Dollars in a $1,572,379 practice (my calculation) |
|---|---|---|---|
| Examinations and consultations | 24.2% (about 25 cents per dollar) | 23.5% | $380,516 |
| Laboratory | 12.7% | 12.2% | $199,692 |
| Vaccinations | 12.6% | 12.0% | $198,120 |
| Pharmacy | 12.2% | 13.6% | $191,830 |
| Surgery and anesthesia | 10.5% | 11.9% | $165,100 |
| Dentistry | 6.6% | 6.3% | $103,777 |
| Imaging | 6.3% | 7.0% | $99,060 |
| All other centers | 14.9% | not reported | $234,284 |
Sources: 2025 shares from AVMA News, October 8, 2026; 2023 shares from AVMA News on the 2024 Practice Owner Survey. AVMA reported exams as “about 25 cents”; 24.2% and 14.9% are my calculations (85.1% minus the six listed shares, and 100% minus 85.1%).
Pharmacy’s share fell from 13.6% to 12.2% between the two surveys, which fits AVMA’s note that more practices now use online pharmacies. If your clinic still counts on in-house pharmacy markup, that line is under pressure.
Is owning a vet clinic profitable?
Usually yes, but nobody publishes a verified industry net margin, and you should distrust pages that state one without a source. Here is what the public record actually shows:
- Payroll is the biggest cost and it grows with size. Census payroll runs 36.0% of receipts across all veterinary firms, from 26.1% in the smallest firms to 39.4% in the largest. Payroll here includes associate veterinarians and, in incorporated practices, any salary the owner pays themselves.
- Owners describe margins as tight. In AVMA’s coverage of its 2026 practice ownership session, consultant Dr. Peter Weinstein described owners balancing rising pay expectations “against the reality of tight profit margins.” Owners in the survey ranked HR and staffing (30.9%) and financing (27.6%) as the hardest parts of starting a practice.
- Revenue growth is flat after inflation. AVMA reports average practice revenue rose from about $1.5 million in 2024 to $1.6 million in 2025, roughly 0.3% in real terms, while revenue per square foot fell from $528 to $513.
- Low-price wellness models run very thin. PetIQ’s last annual report, its 10-K for fiscal 2023, shows Services segment revenue of $133.8 million and Segment Adjusted EBITDA of $2.6 million, a 2.0% margin by my calculation (3.1% in 2022, 3.6% in 2021). The segment ran vaccine and wellness clinics hosted in retail stores, and closed 149 underperforming wellness centers in 2023.
My reading: a full-service general practice is not a low-margin retail clinic, and it is not a high-margin software business either. The honest way to answer “how profitable is a vet clinic” for a specific clinic is to build its P&L line by line, which the worksheet below does. For how other service industries compare on reported margins, see profit margins by industry.
Do vet clinics make money? A worked owner-earnings example
An owner who also practices gets paid two ways: for clinical work, and from whatever profit is left after every cost, including that clinical pay. The table below shows how the second piece changes owner earnings. The margins are hypothetical scenarios, not benchmarks; plug in your own.
| Scenario | Practice revenue | Profit after all costs incl. owner’s clinical pay | Owner’s clinical pay | Total owner earnings (pre-tax) |
|---|---|---|---|---|
| 5% profit (hypothetical) | $1,572,379 | $78,619 | $163,014 | $241,633 |
| 10% profit (hypothetical) | $1,572,379 | $157,238 | $163,014 | $320,252 |
| 15% profit (hypothetical) | $1,572,379 | $235,857 | $163,014 | $398,871 |
Revenue is the AVMA 2025 average practice. Clinical pay uses the AVMA’s 2025 average professional income for all veterinarians, $163,014, as a stand-in for what you would pay an associate to do your clinical work. Profit percentages are illustrative only. Debt service on a practice loan comes out of the profit column.
The point of the exercise: if your clinic cannot pay you a market associate wage and leave a profit, you own a job, not a business. The buyer of your practice will run exactly this math.
How much do vet clinic owners make?
There is no free, current, primary-source average for practice owner income. These are the closest verified numbers:
| Measure | Figure | Who it covers | Source |
|---|---|---|---|
| Average professional income, 2025 | $163,014 | All US veterinarians, owners and employees | AVMA 2026 Census of Veterinarians |
| Median annual wage, May 2025 | $130,100 | Veterinarians on payroll, all industries | BLS Occupational Outlook Handbook |
| Median annual wage in veterinary services, May 2025 | $129,990 | Veterinarians employed by clinics and hospitals | BLS Occupational Outlook Handbook |
| Top 10% of wages, May 2025 | more than $215,700 | Veterinarians on payroll | BLS Occupational Outlook Handbook |
| Average starting pay, 2026 graduates in private practice | $133,056 | New graduates, full-time | AVMA News, October 8, 2026 |
AVMA’s 2026 data show owners earn more than non-owners in every practice type, though the specific owner figures sit in a chart and in the paid 2026 Economic State of the Profession report rather than in public text. About 34.0% of the roughly 84,000 veterinarians in clinical practice are owners and 56.1% are associates, per the same AVMA ownership article. Income was not the top reason owners gave for opening a practice: 86.0% ranked greater control first, against 62.3% who cited higher income potential.
Can a vet make $200K a year?
Yes. On payroll it is uncommon: BLS puts the top 10% of veterinarian wages above $215,700, so $200,000 is roughly 90th-percentile pay for an employee. As an owner, $200,000 or more is reachable in the worked example above once the practice clears a modest profit on top of market clinical pay.
Vet clinic health scorecard: pass or flag
Use this on your own clinic, or on a clinic you are thinking of buying. The national benchmarks come from AVMA’s practice owner surveys. Where AVMA’s economist gave a target, the scorecard uses it; every other pass rule is labeled “my rule”.
| Metric | How to calculate | National benchmark | Pass if | Your clinic |
|---|---|---|---|---|
| Revenue per veterinarian | Gross revenue ÷ number of vets | $671,830 (2025) | At or above $671,830 (my rule) | |
| Revenue per square foot | Gross revenue ÷ total square feet | $513 (2025) | At or above $513 (my rule) | |
| Revenue per exam room | Gross revenue ÷ exam rooms | $503,988 (2025) | At or above $503,988 (my rule) | |
| FTE vets per exam room | FTE veterinarians ÷ exam rooms | 0.92 actual (2024) | About 0.5, the target AVMA’s economist gave | |
| Vet to total staff ratio | Non-vet staff ÷ FTE vets | Productivity gains stop above 1:4 to 1:5 | Between 1:4 and 1:5 (AVMA data) | |
| Patients per vet per day | Daily patients ÷ FTE vets on duty | About 15 (2025) | 15 or more (my rule) | |
| Active clients per FTE vet | Clients seen in last 12 to 24 months ÷ FTE vets | 1,749 (2025) | 1,749 or more (my rule) | |
| Payroll share of revenue | Total payroll ÷ gross revenue | 36.0% (Census 2022, all firms) | At or below your size band in the firm-size table above |
Benchmarks: 2025 figures from AVMA, October 2026; 2024 figures and the 0.5 vets-per-room target from AVMA, October 2025; staff ratio from AVMA’s 2024 owner survey coverage; payroll from Census SUSB 2022.
Three or more flags on a clinic you want to buy is not a reason to walk away, but it tells you where the price should come down and where the first year of work will go. If the gap is client volume rather than efficiency, that is a marketing problem, and the channels that win new pet owners are covered in veterinary marketing.
Copy-ready vet clinic P&L worksheet
Copy this into a spreadsheet. The benchmark column fills in the revenue side with AVMA’s 2025 average practice so you can see the shape; the cost lines are blank on purpose, because no public source publishes them for veterinary clinics and inventing them would mislead you. Pull the costs from your own books or the seller’s last three years of tax returns.
| Line | Benchmark (AVMA 2025 average practice) | Your clinic | % of revenue |
|---|---|---|---|
| Exams and consultations | $380,516 | ||
| Laboratory | $199,692 | ||
| Vaccinations | $198,120 | ||
| Pharmacy | $191,830 | ||
| Surgery and anesthesia | $165,100 | ||
| Dentistry | $103,777 | ||
| Imaging | $99,060 | ||
| All other (boarding, grooming, retail, other) | $234,284 | ||
| A. Gross revenue | $1,572,379 | 100% | |
| Drugs, medical supplies, outside lab fees | from your books | ||
| Staff payroll (excluding owner) | Census all-firm ratio: 36.0%, or $566,056 | ||
| Payroll taxes and benefits | from your books | ||
| Rent or mortgage, utilities, repairs | from your books | ||
| Equipment leases and depreciation | from your books | ||
| Software, card processing, insurance, CE, marketing | from your books | ||
| B. Total costs before owner | |||
| C. Owner earnings before debt (A minus B) | |||
| Market pay for owner’s clinical work | AVMA all-vet average: $163,014 | ||
| D. True business profit (C minus market clinical pay) | |||
| Practice loan payments (principal and interest) | from your lender | ||
| E. Cash left after debt (D minus loan payments) |
Line C is what the owner takes home in a good year. Line D is what the business earns as a business, and it is the line a buyer or lender cares about. If D is negative, the clinic is paying you less than an associate would earn.
How much money do you need to open a vet clinic?
No government or AVMA source publishes a current, verified start-up cost for a veterinary clinic, and the estimates that rank online range from a few hundred thousand dollars to well over a million with no shared method. What you can pin down with primary data:
- The size you are building. The average practice in AVMA’s 2025 survey occupied about 4,000 square feet with 3.6 exam rooms. Get build-out and equipment quotes for your actual floor plan.
- The revenue the space can support. At the 2025 national average of $513 per square foot, a 2,500-square-foot clinic would need about $1.28 million a year to match the average (my calculation). Use that to sanity-check the loan.
- The financing ceiling. The SBA’s 7(a) loan program, a common government-backed option for small-business purchases and build-outs, caps a loan at $5 million.
- The ramp. Budget working capital to cover payroll until you reach AVMA-level patient volume, about 15 patients per vet per day. Financing was the second-hardest start-up challenge owners named (27.6%), behind staffing.
Is a vet clinic a good investment?
The case for it: large consolidators actively buy practices, which is what turns years of production into a sellable asset. The Census data show 37 firms already account for 36.4% of US veterinary revenue. Practice counts keep growing, too: AVMA cites 34,296 practices in 2023 and about 362 new ones a year since 2010.
The case for caution: the 2025 data show patient visits per vet flat or falling, revenue per square foot down, and real revenue growth of about 0.3%. Margin comes from running the clinic well, not from the market lifting everyone. If you are comparing healthcare practices as investments, the same Census method applied to dentistry is in this breakdown of dental practice average revenue.
Who is the largest owner of veterinary clinics?
Mars, Incorporated. In a November 10, 2026 press release, Mars said it supports “over 2,000 veterinary clinics and hospitals across the country,” including its Banfield and BluePearl pet hospital brands. Mars is family-owned and does not file with the SEC, so its clinic revenue is not disclosed.
The public companies that run clinics disclose only part of the picture:
| Company | Veterinary footprint | Revenue disclosed | Filing |
|---|---|---|---|
| Petco | About 300 full-service veterinary hospitals; about 1,600 Vetco clinics operated weekly (as of January 31, 2026) | Services and other: $1.025 billion in fiscal 2025, 17.2% of net sales (my calculation). Includes grooming and training; veterinary revenue alone is not disclosed. | 10-K, fiscal 2025 |
| PetIQ | Over 2,600 community clinic locations and 133 wellness centers in 39 states (end of 2023) | Services segment: $133.8 million revenue, $2.6 million Segment Adjusted EBITDA in 2023 | 10-K, fiscal 2023 (its last annual report on EDGAR) |
Can a non-vet own a vet clinic?
It depends on the state. A 2020 analysis by the law firm Arnall Golden Gregory lists New York, New Jersey, Minnesota and North Carolina as states that prohibit the corporate practice of veterinary medicine, Connecticut, Georgia and Massachusetts as states with no such prohibition, and Florida, Oregon and California as middle-ground states. In restrictive states, investors often use a “friendly veterinarian” model: a management company owns the non-clinical assets and a licensed veterinarian owns the practice. These rules change, so confirm with your state veterinary board and a healthcare attorney before you sign anything. The existence of Mars’s 2,000-plus clinics shows that non-veterinarian corporate ownership is common where the law allows it.
If you own a clinic and the scorecard shows the gap is new-client flow rather than operations, that is the part I work on with practice owners; you can book a consultation and bring your numbers.
Ready to scale your revenue?
Book a free 30-min consultation. We’ll diagnose your growth bottleneck and map out the 3 highest-leverage moves for your business.
Frequently asked questions
What is the average revenue of a veterinary clinic?
About $1.86 million per veterinary location. Census Statistics of U.S. Businesses data for 2022 show 34,000 employer veterinary locations (NAICS 541940) with $63.2 billion in receipts. The AVMA's survey of practice owners puts the average practice at $1,572,379 for 2025, and the median veterinary firm takes in just under $1 million, because a few large chains pull the average up.
Is owning a vet clinic profitable?
Usually, but no public dataset reports a verified net margin for veterinary clinics. What is published: payroll takes 36.0% of receipts across all veterinary firms (Census 2022), AVMA's 2026 coverage quotes a practice consultant on owners' tight profit margins, and real revenue grew only about 0.3% in 2025. Profit depends on revenue per vet, payroll control and debt, so build the clinic's own P&L before deciding.
How much do vet clinic owners make?
There is no free, current primary-source average for owner income. AVMA reports average professional income of $163,014 for all veterinarians in 2025 and says owners earn more than non-owners in every practice type. An owner's total earnings are market pay for their clinical work plus the practice's profit, so in a hypothetical average-size practice clearing 5% to 15% profit, the owner would earn roughly $240,000 to $400,000 before tax and debt.
What is the profit margin of a veterinary practice?
It is not published as an official statistic. The IRS does not break out veterinary services in its standard tables, and the AVMA's free summaries give revenue, not margin. The public 10-K data point is PetIQ, whose retail-hosted veterinary clinic segment earned $2.6 million Segment Adjusted EBITDA on $133.8 million revenue in 2023, about 2%. A full-service general practice typically runs a different model and should be measured on its own P&L.
How much revenue does a veterinarian generate?
About $671,830 per veterinarian in 2025, according to the AVMA's practice owner survey. The AVMA's 2024 figure, measured per full-time-equivalent veterinarian, was $554,982, down in inflation-adjusted terms from nearly $600,000 in 2019. The two numbers use different definitions, so do not read the difference as a 21% increase.
Can a vet make 200k a year?
Yes. BLS data for May 2025 show the top 10% of employed veterinarians earned more than $215,700, so $200,000 is roughly 90th-percentile pay on payroll. Practice owners can reach it more often, because they earn market clinical pay plus whatever profit the practice produces after all costs.
Who is the largest owner of veterinary clinics?
Mars, Incorporated. In a November 10, 2026 press release Mars said it supports over 2,000 veterinary clinics and hospitals across the US, including its Banfield and BluePearl brands. Mars is family-owned and does not disclose clinic revenue. Among public companies, Petco reports about 300 full-service veterinary hospitals and about 1,600 Vetco clinics in its fiscal 2025 10-K.
Practice economics benchmarks